
Ocean Protocol (OCEAN) has created a triple bottom pattern close to its all-time lows. However, technical indicators do not yet confirm the potentially bullish pattern.
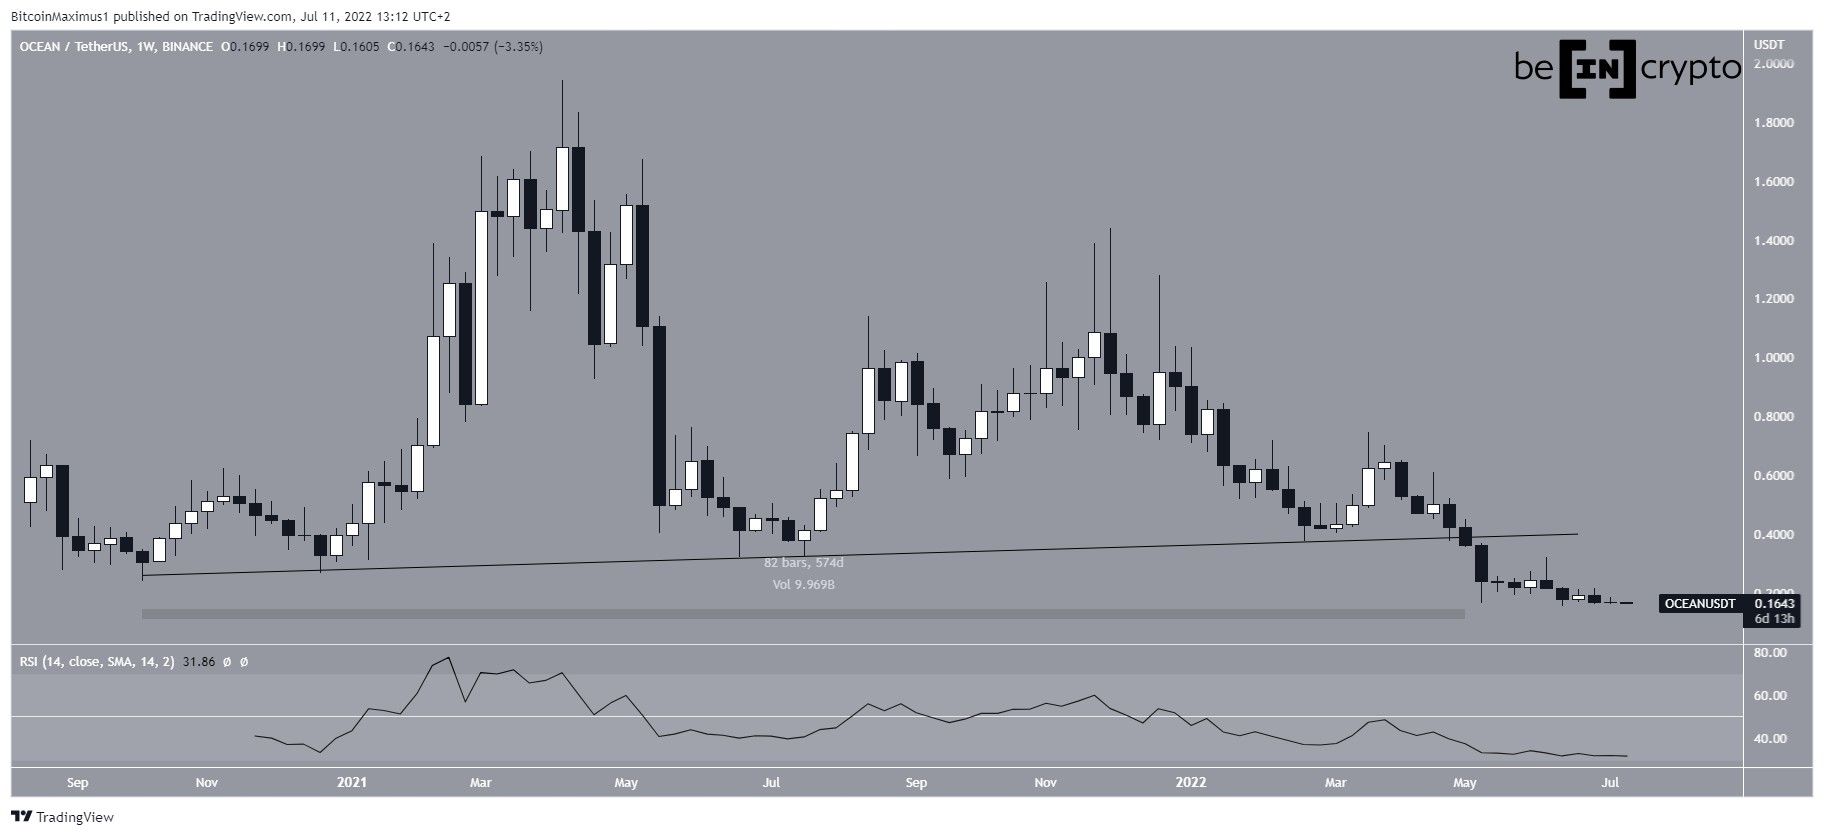
OCEAN has been falling since reaching an all-time high price of $1.94 in April 2021. The downward movement has so far led to a low of $0.16 in July. Measuring from the all-time high, this amounts to a drop of 91%.
More importantly, the price has broken down from a long-term ascending support line that had previously been in place for 574 days. Such breakdowns often mean that the previous trend has come to an end. If a bounce transpires, the line would now be expected to provide resistance.
While the weekly RSI is at an all-time low, it has not yet generate bullish divergence nor is it in oversold territory.
Short-term movement
Cryptocurrency trader @eliz883 tweeted a chart of OCEAN, stating that a short-term double/triple bottom is being created.
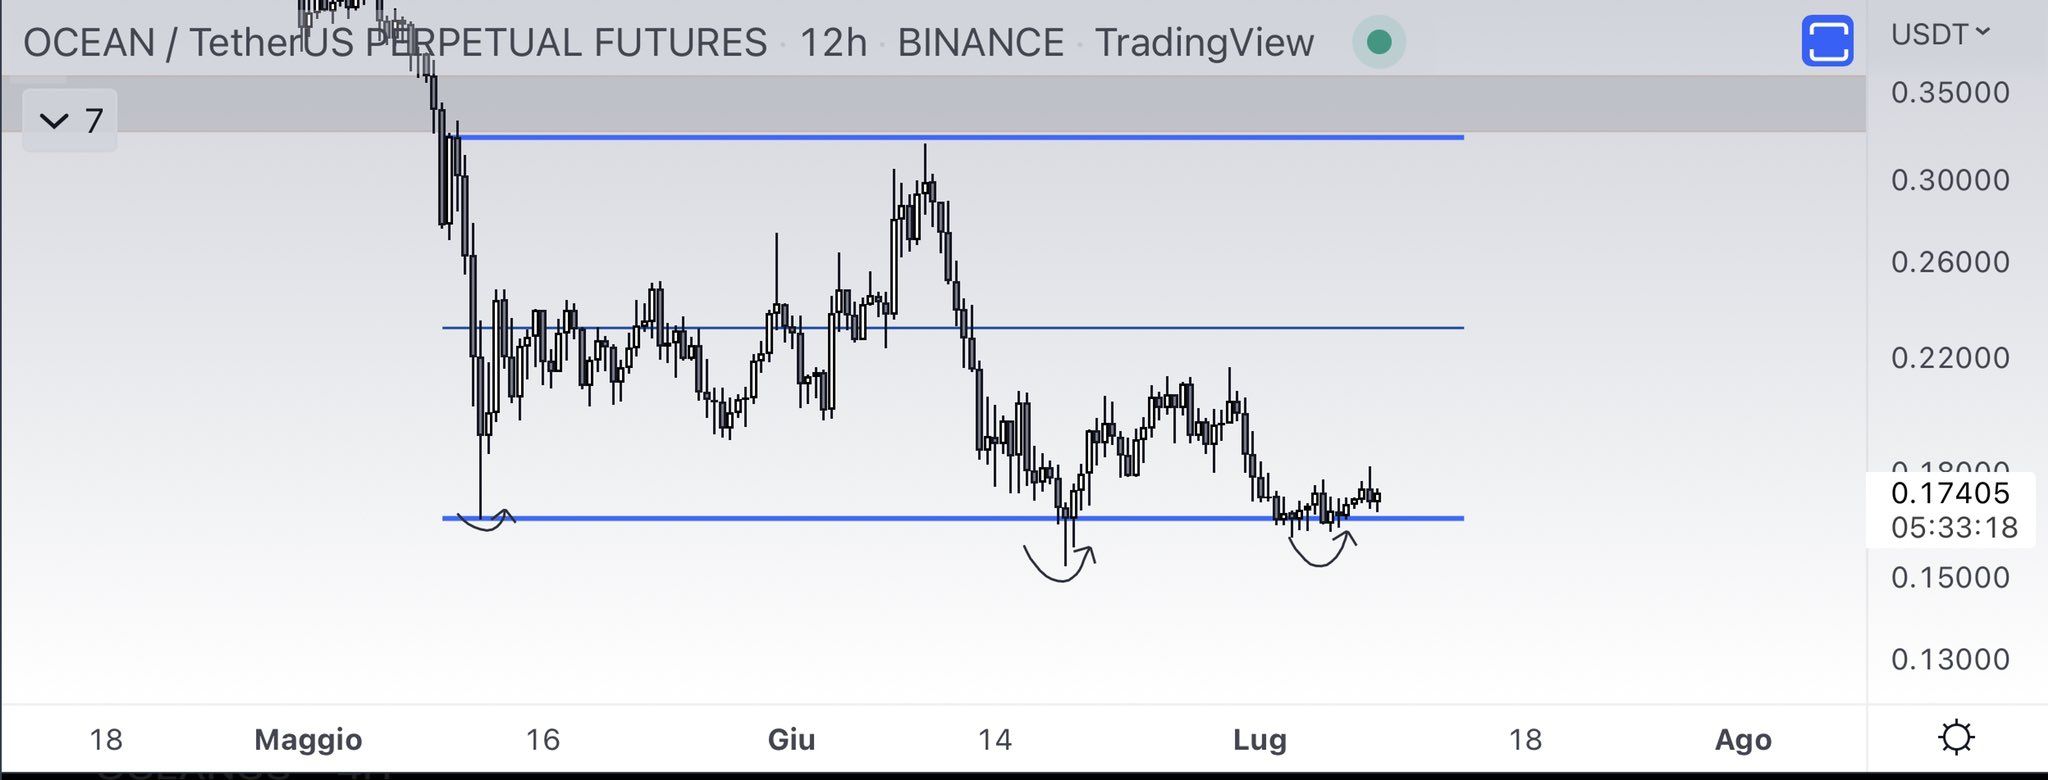
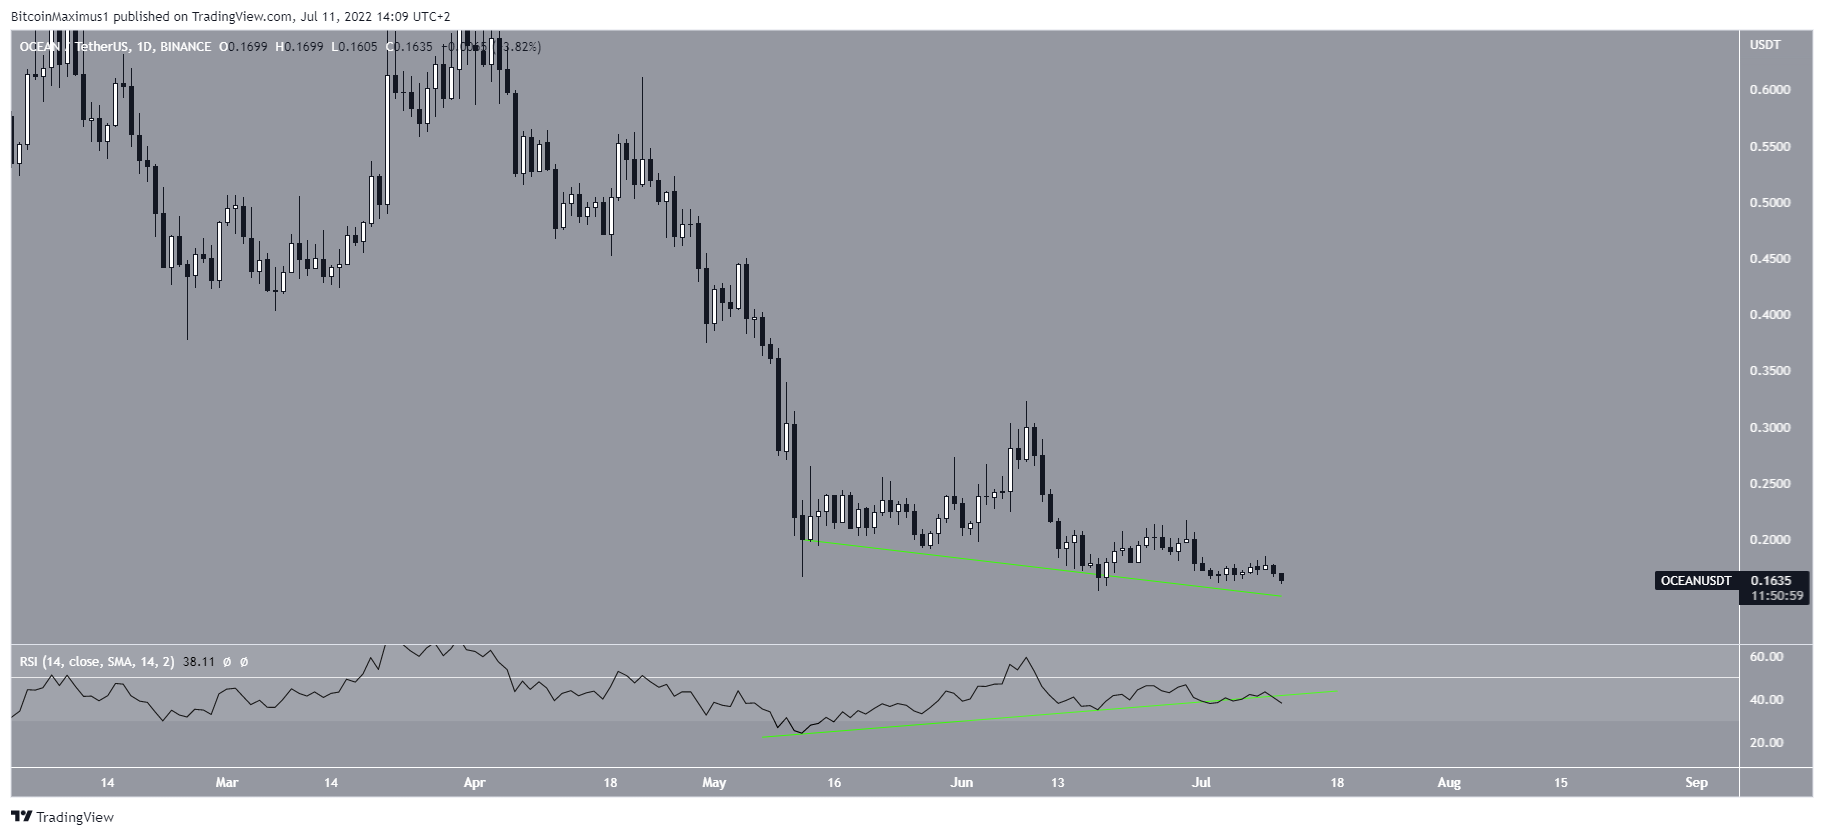
Initially, it seemed that the price was in the process of creating a triple bottom pattern that was combined with bullish divergence in the RSI.
While the triple bottom is still in place, the RSI is at risk of breaking down from its bullish divergence trendline (green). Also, it has fallen below 50. This is a sign that the trend is gradually turning bearish and the bullish reversal as a result of the triple bottom might not transpire.
OCEAN/BTC
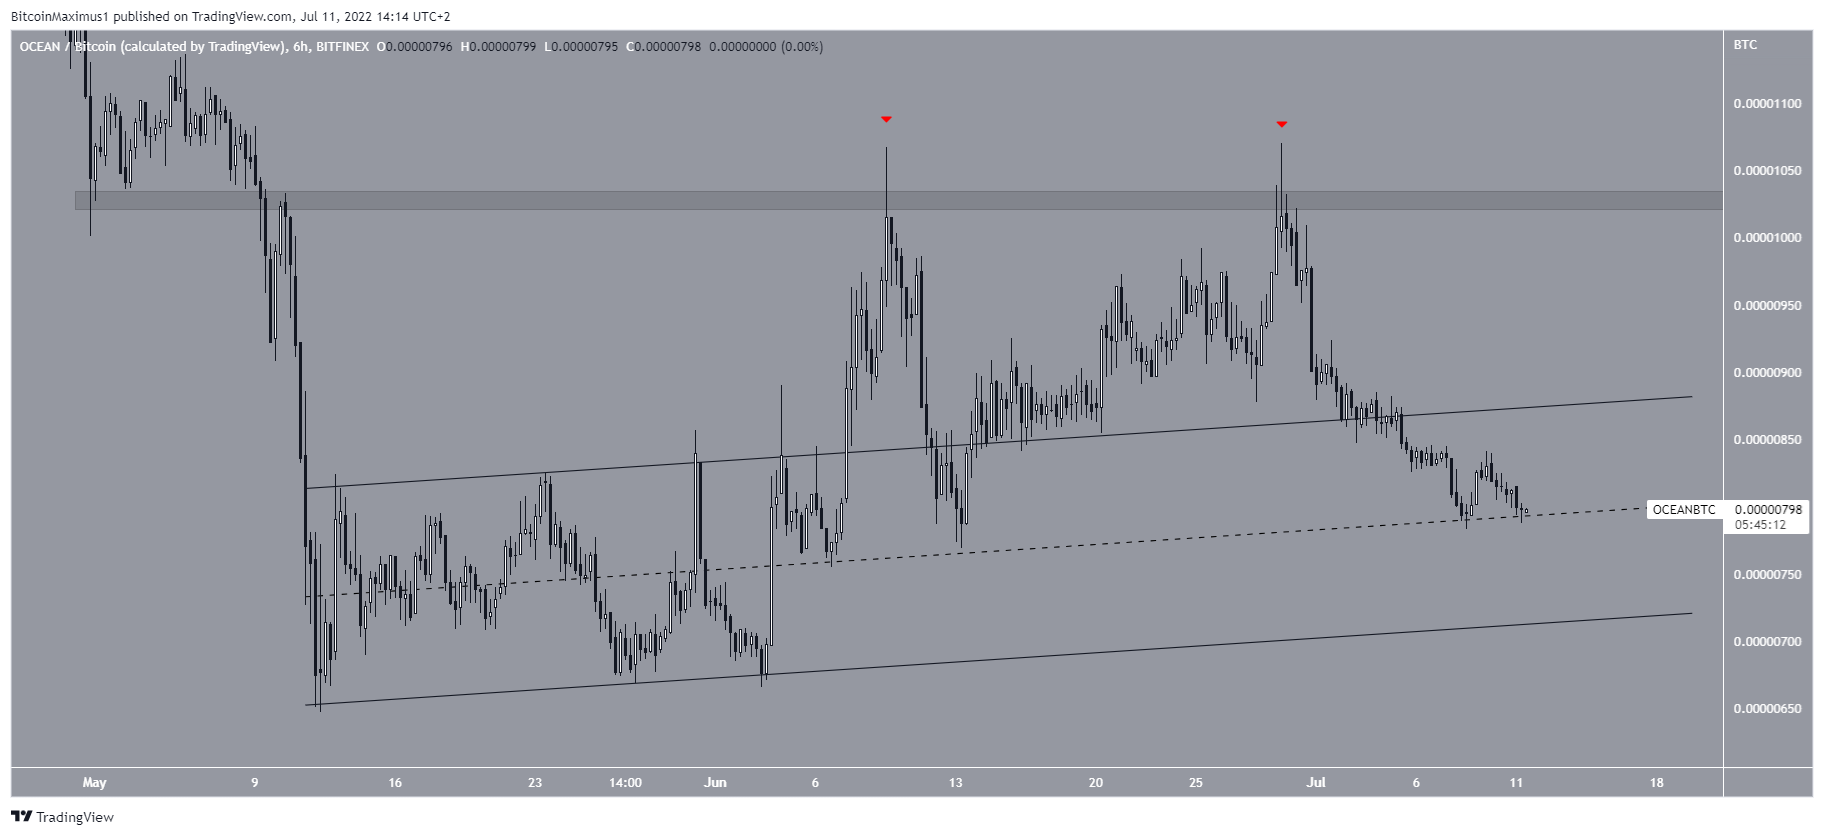
The OCEAN/BTC pair is slightly more bullish than its USD counterpart. The main reason for this is that the price has broken out from an ascending parallel channel.
However, it was rejected twice by the 1,020 satoshi resistance area (red icons) and has failed to hold on above the resistance line of the channel.
Due to the fact that the price has fallen back inside the channel, it is possible that new lows will follow.
For Be[in]Crypto’s latest bitcoin (BTC) analysis, click here.
