


The Ocean Protocol (OCEAN) price has been decreasing since Aug 18 and is approaching two crucial support levels that could bring an end to the ongoing correction.
OCEAN Dives Lower
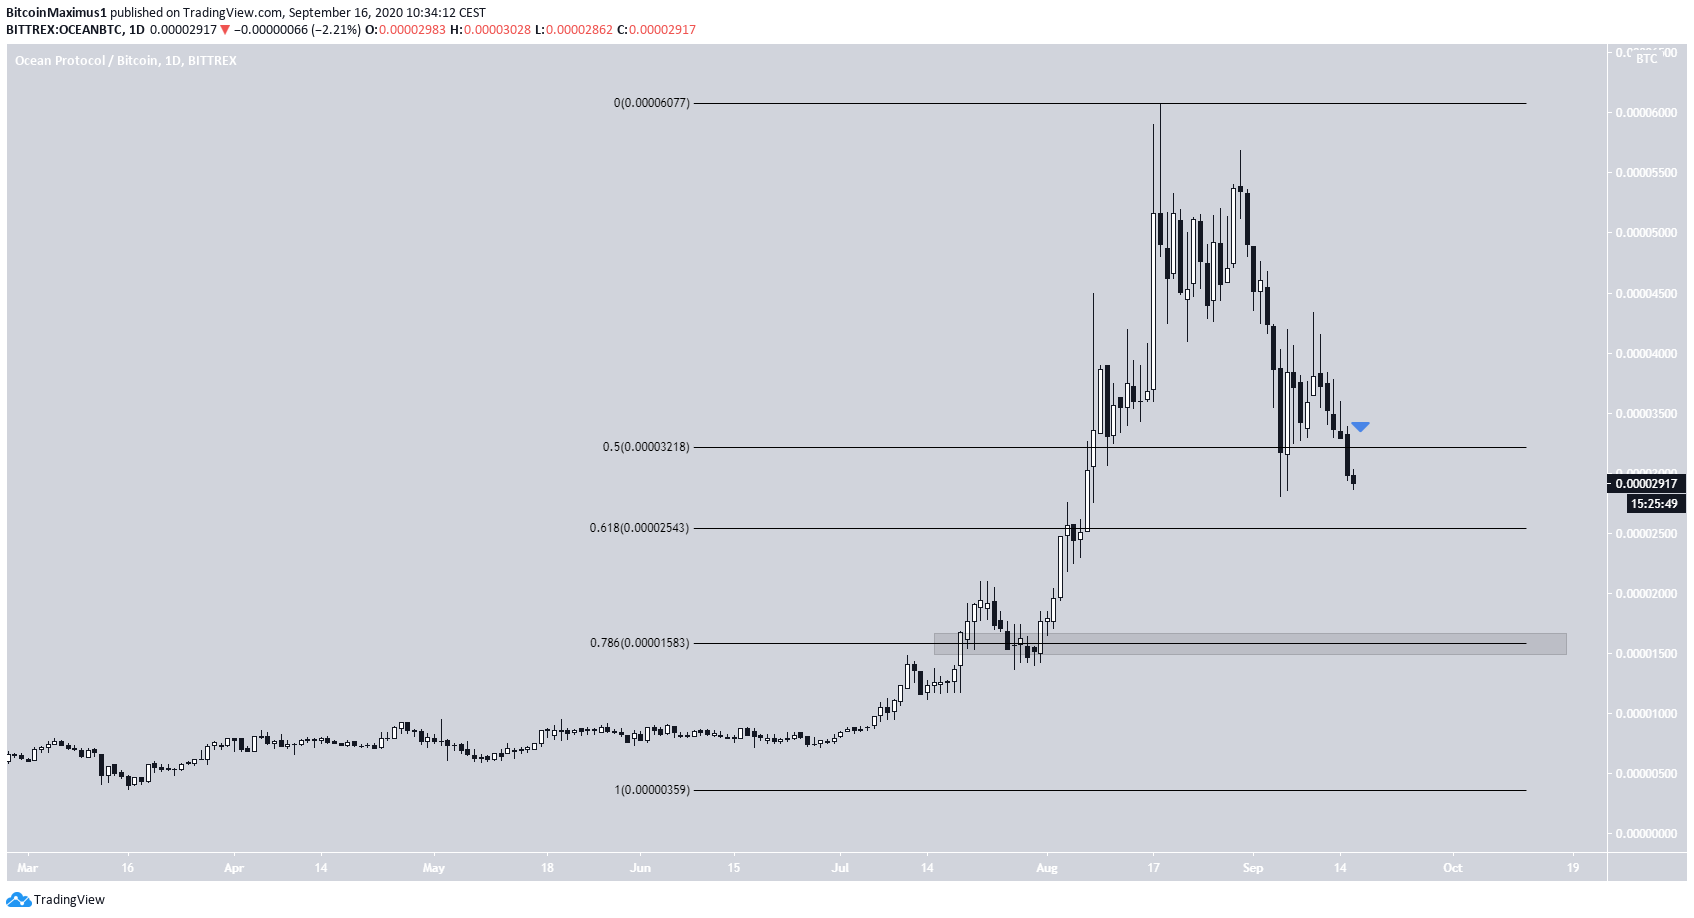
The OCEAN price has been decreasing since Aug 18, when the price reached a high of 6,031 satoshis. The drop has been sharp and has already fallen below the 0.5 Fib level of the entire upward move.
The next support levels are found at 2,543 satoshis (the 0.618 Fib level) and 1,583 satoshis (0.786 Fib level and previous support area).
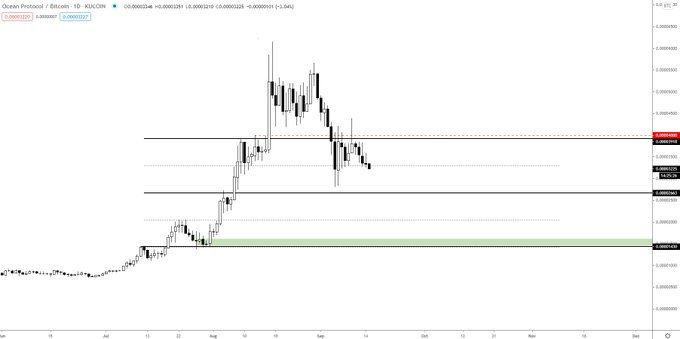
Cryptocurrency trader @TheEurosniper outlined a chart that highlights the 1,550 satoshi level that coincides with the Fib and minor support area discussed in the previous section.
No Signs of Reversal
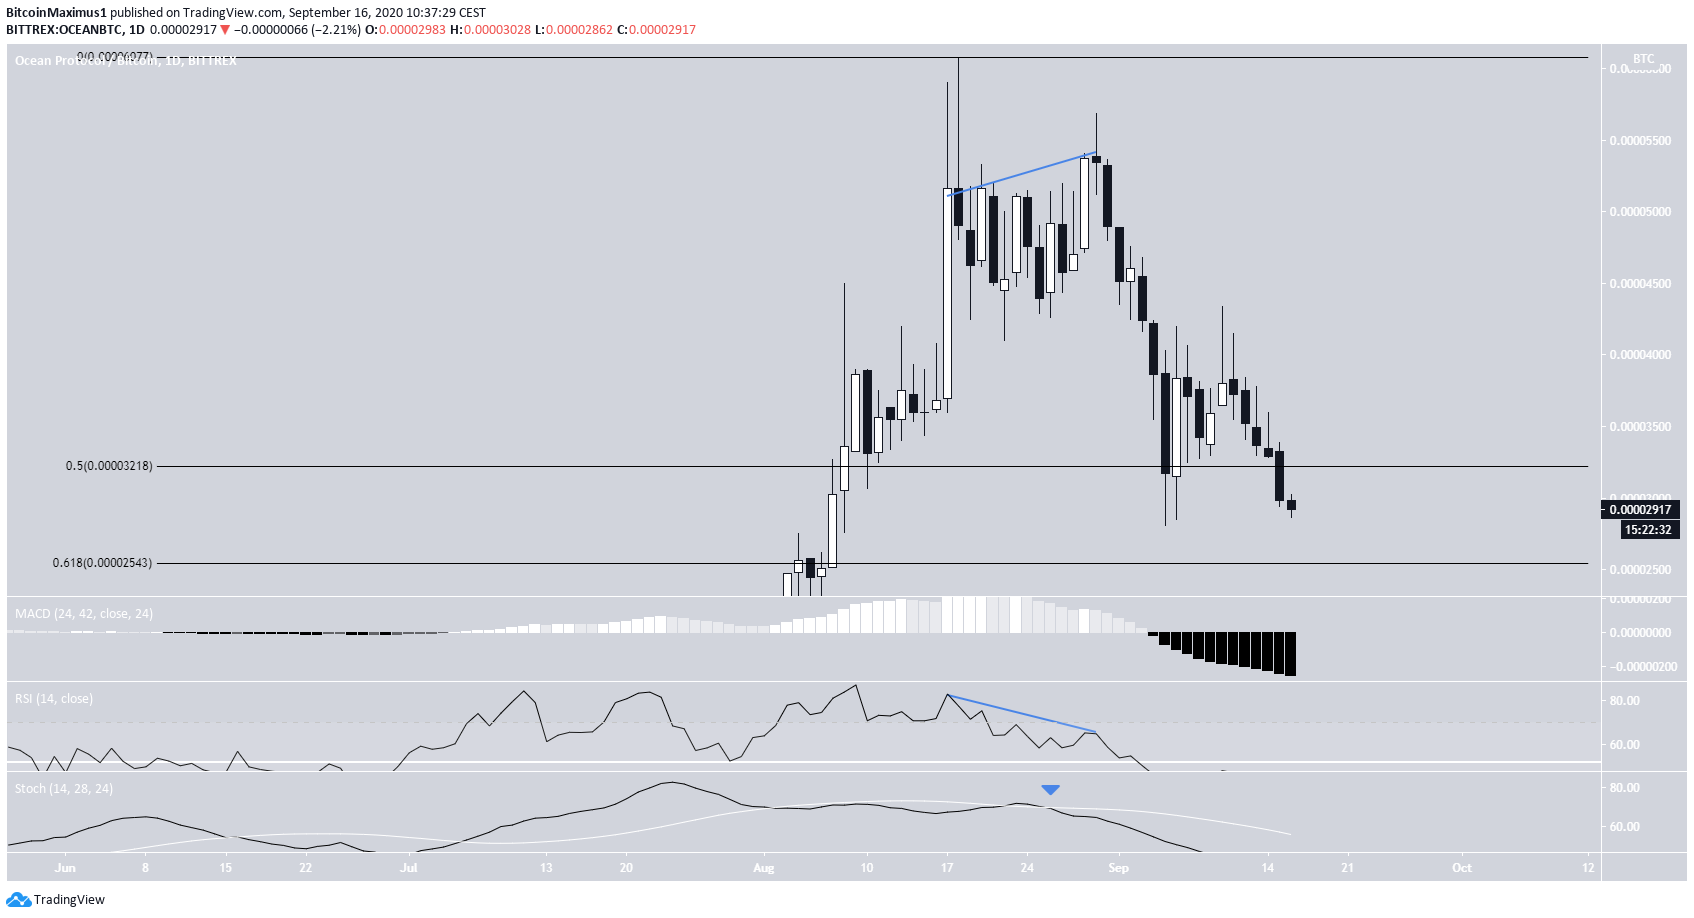
A look at technical indicators reveals that the decrease was preceded by considerable bearish divergence in the RSI.
Furthermore, there are no bullish reversal signs yet;
- The MACD is steadily decreasing
- The RSI is decreasing and has fallen below 50
- The Stochastic oscillator has made a bearish cross.
Therefore, OCEAN is expected to decrease towards the two support areas outlined previously before possibly beginning another upward move.
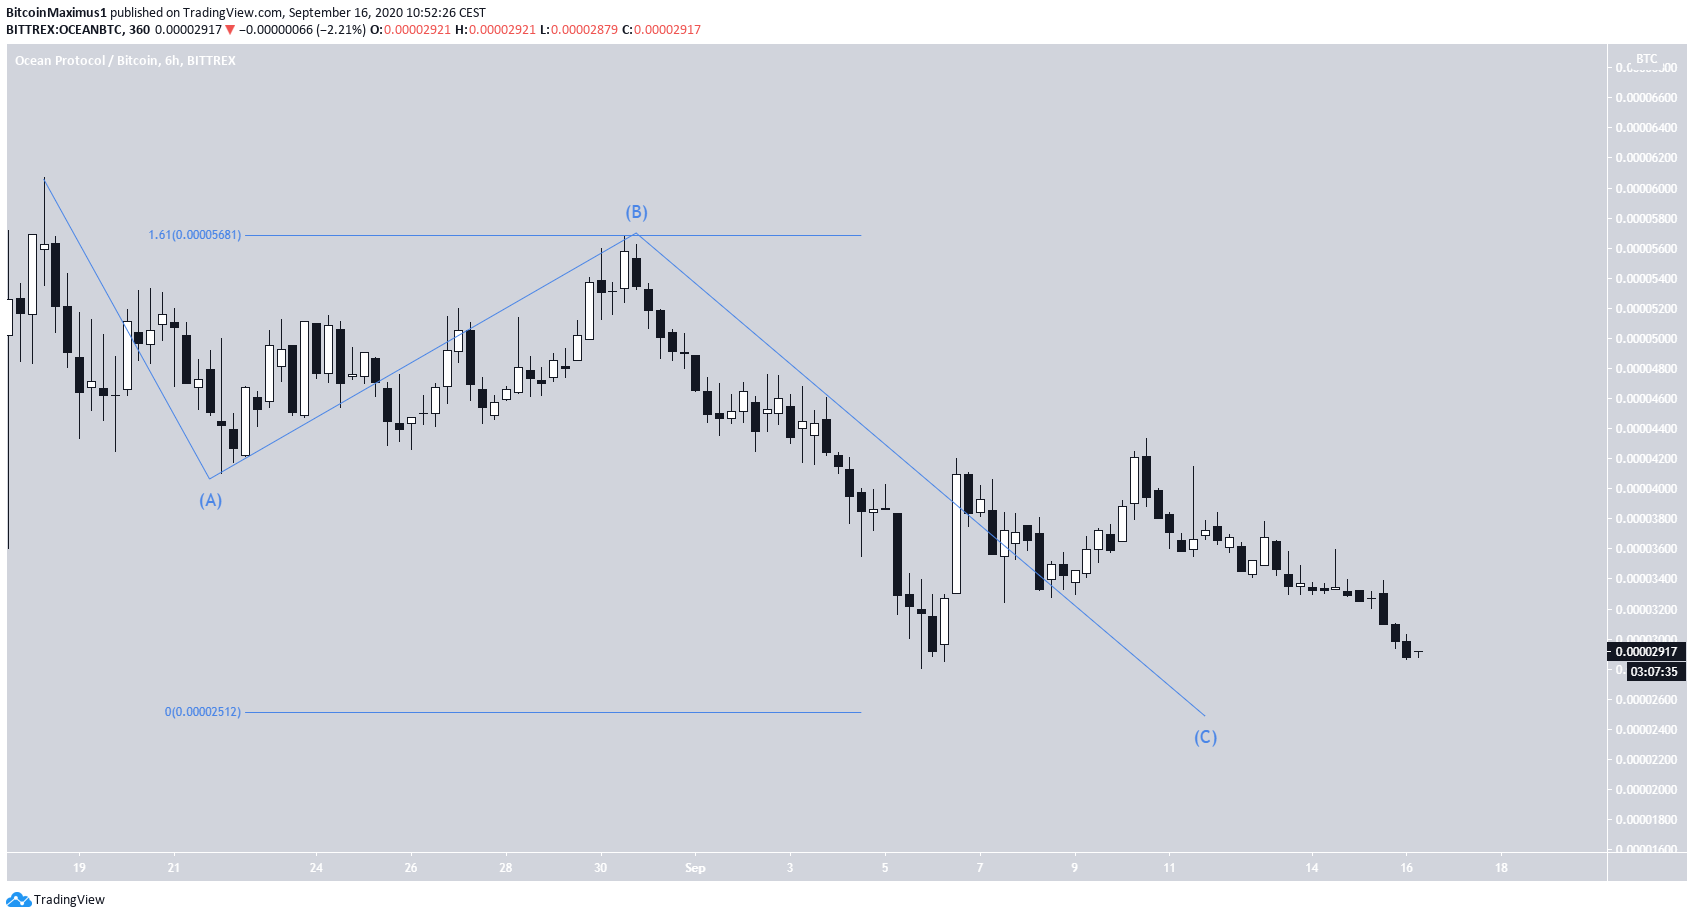
If the price is following an A-B-C correction (in blue below), then a possible bottom for the move would be found at 2,540 satoshis (the 0.618 Fib level outlined in the previous section).
This decrease would make a ratio of 1:1.61 for the A:C waves, a very common occurrence in such corrections.
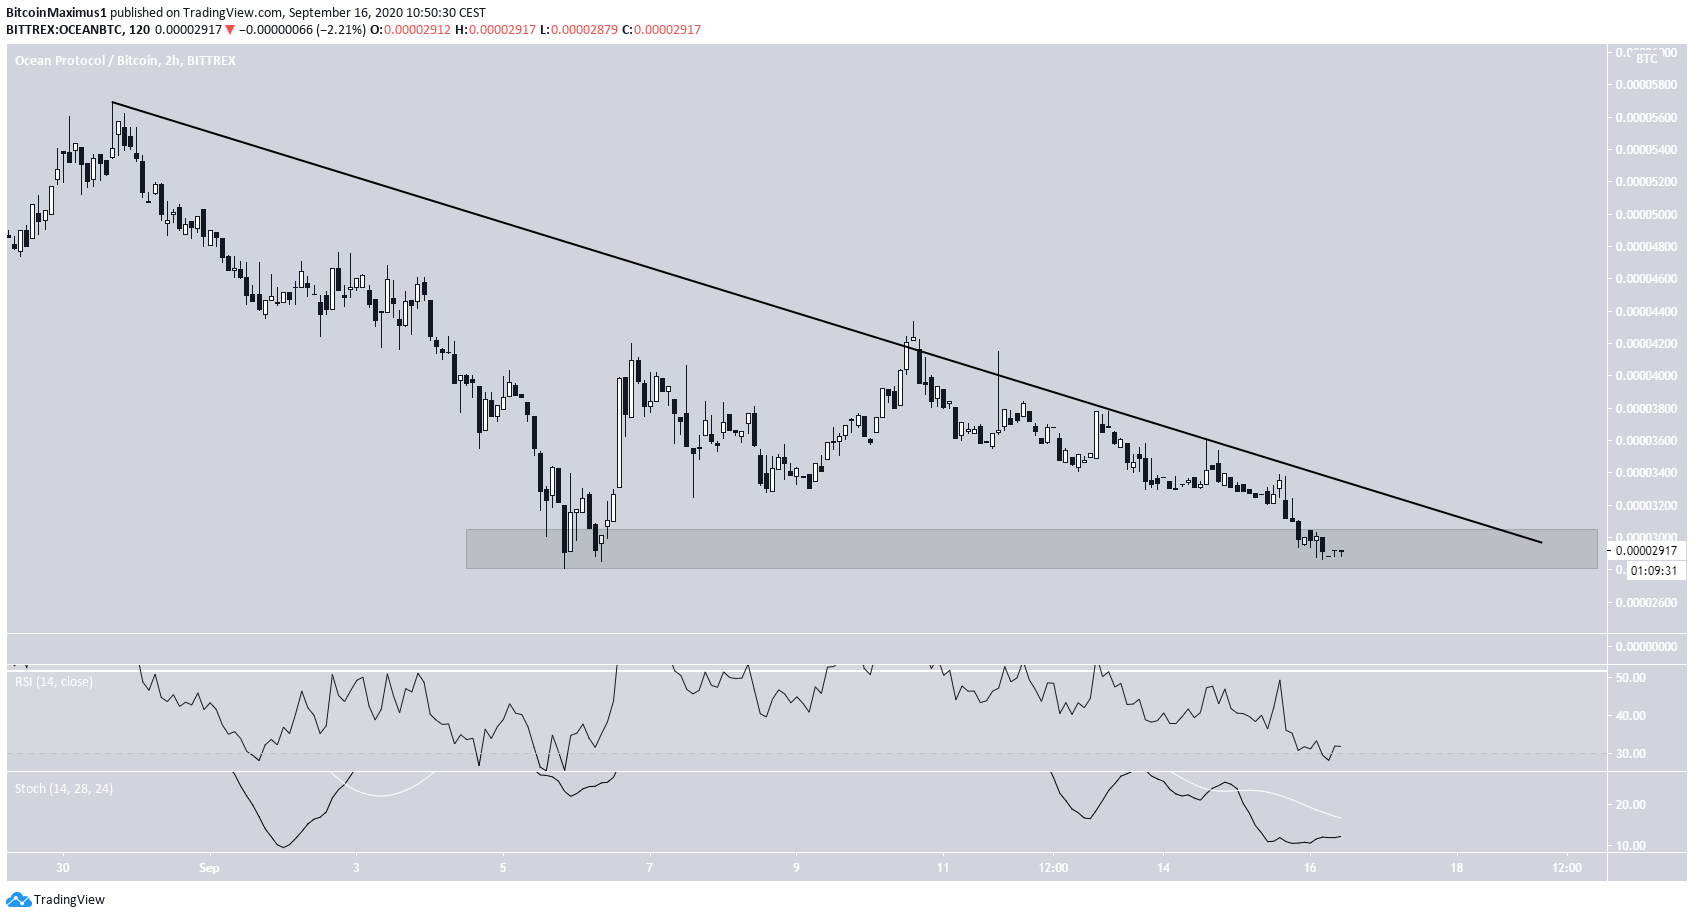
Short-Term Breakdown
The short-term chart shows that the price is following a descending resistance line and is possibly creating a double-bottom near 2,900 satoshis.
Since there are no short-term reversal signs and the longer-term outlook is bearish, the price is expected to break down from this support area and head lower.
To conclude, the OCEAN price is expected to continue decreasing towards 2,540 satoshis and could possibly reach 1,550 satoshis before eventually resuming its upward movement.
For BeInCrypto’s latest Bitcoin (BTC) analysis, click here!


