


The OmiseGo (OMG) Developer Program (ODP) was announced on Mar 5, 2019. Reportedly, applicants will be given early access to the Alpha release of the OMG network to build and test new services.
As the OMG network continues to evolve, usage of its services may increase. This could result in increased prices. However, much of OMG’s success or failure is speculative and based on events that have not occurred.
OMG has generated several partnerships, hosted a successful ICO, and appears to be developing its network and services offered on it. However, the company has still released very little, and the ODP program may yield more failures than successes.
Key Highlights for Mar 5, 2019
- A flash crash on Feb 24 brought prices down to $1.28.
- An overall downtrend brought prices to nearly $1.15 on Mar 4.
- Price increased to nearly $1.25 reached on Mar 6.
- Price broke down from a descending triangle.
- There is resistance near $1.41.
- There is support near $1.28.
- OMG has been consistently trading below support between Mar 3 and 5.
Learn about the OmiseGO Developer Program (ODP), an initiative that is part of the product development process that facilitates usage and thorough testing of Proof-of-Concepts (PoCs) and early stage products.#OmiseGO #OMGNetwork #OMG #Blockchain https://t.co/wOtckIRMKU
— Boba Network 🧋 (@bobanetwork) March 5, 2019
Breakdown From The Support
The price of OMG on Binance was analyzed on 1-hour intervals from Feb 24 to Mar 5.
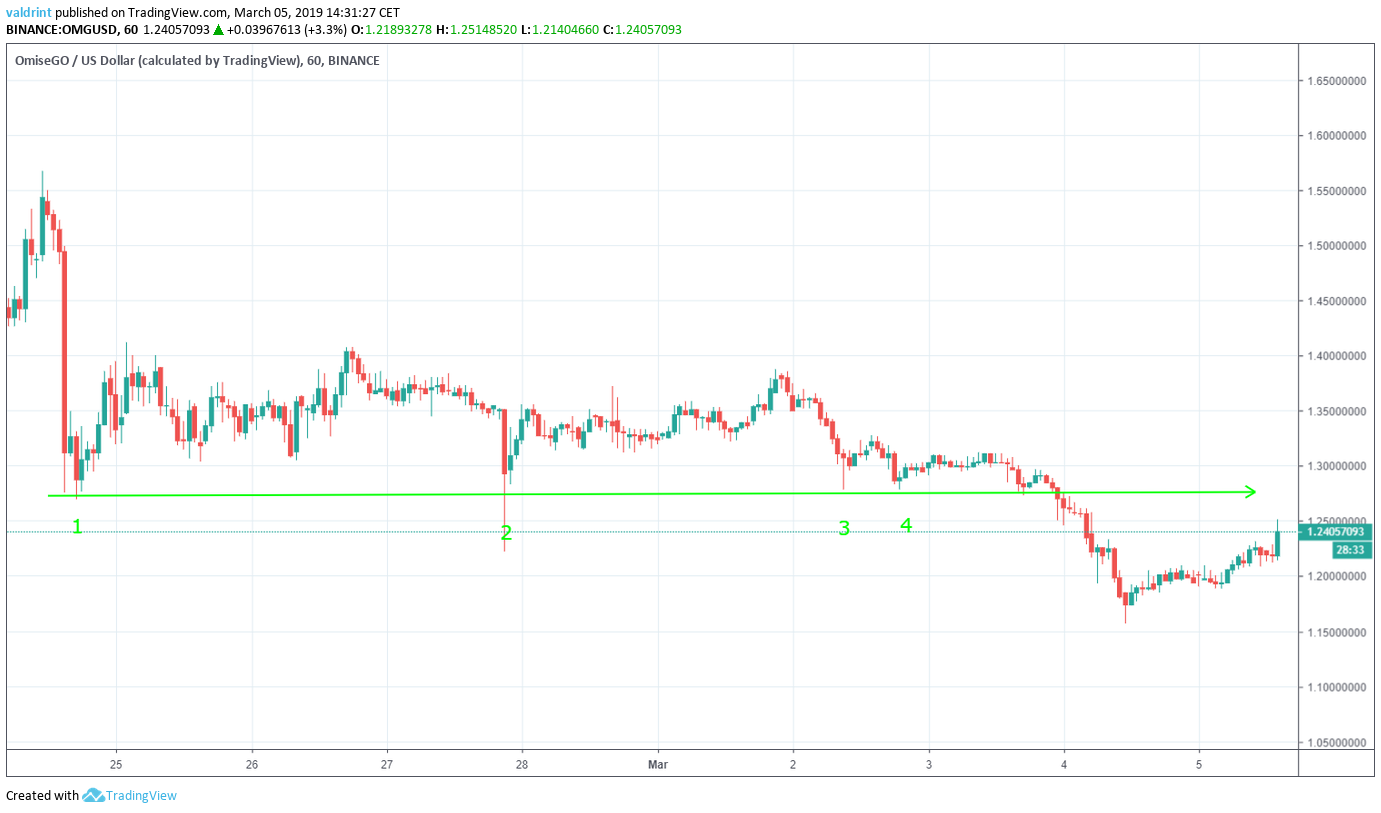
The price of OMG reached a high of $1.55 on Feb 24. Subsequently, a market-wide flash crash brought the price to lows of $1.28. The price created a support line—which is formed by tracing recurring lows over a period of time.
The number of times the line is touched and its validity have a positive correlation. The support line for OMG was validated four times. On Mar 3, OMG fell below the price line.
When support is broken for a significant period, a new support line may develop. Currently, the price of OMG is increasing and appears to be returning to the support line. If this continues, the current support may be maintained.
Completing The Channel
The resistance line is created by inverting the method used to create the support line. The successive highs at the same level are traced to form the resistance line.
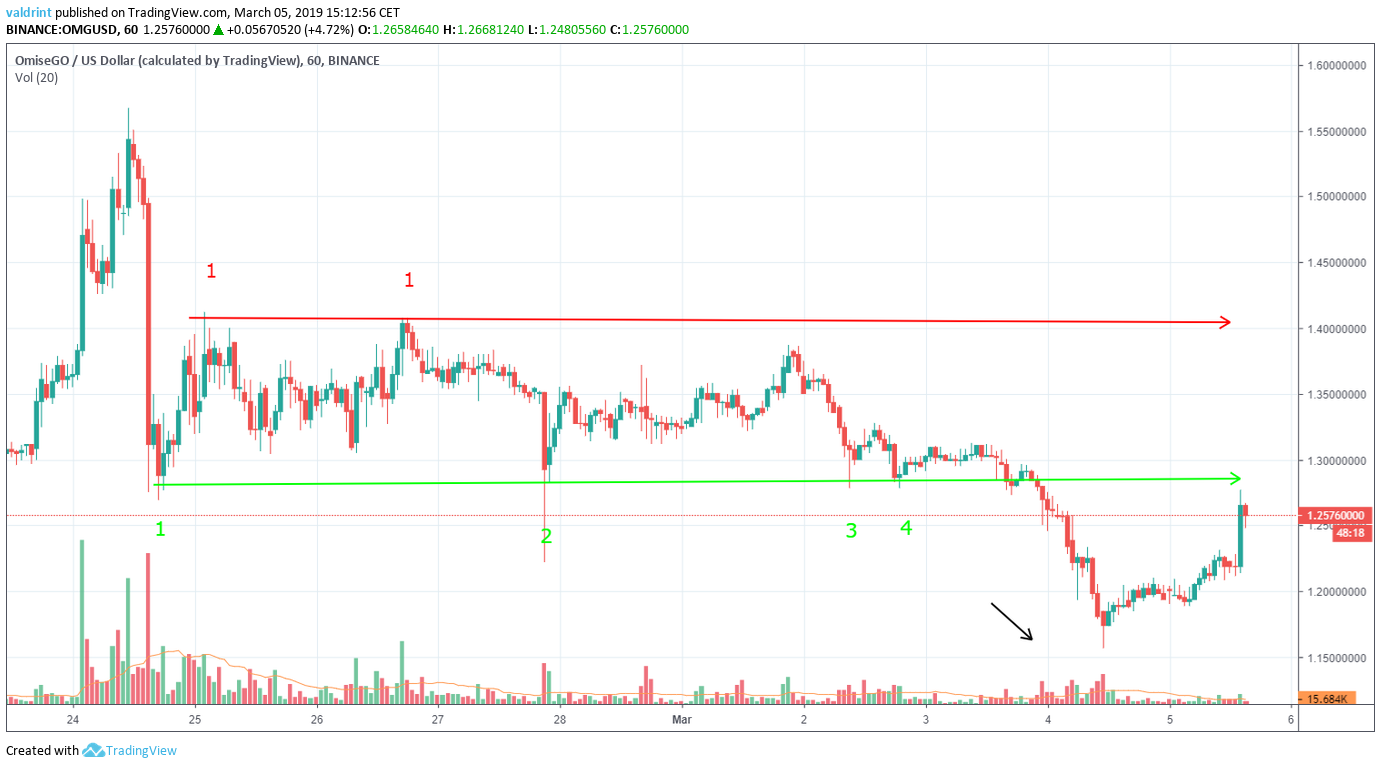
The line was validated twice. Afterward, the price started increasing at a smaller rate than predicted by the line, leading to an unsuccessful third attempt at validating it.
The support and resistance lines combined create a horizontal channel. If price moves outside this channel for a significant period, new resistance and support lines may develop. If OMG’s price does not increase above the support line, then the horizontal channel may be broken.
A Look at The Moving Averages
The MACD is a momentum and trend indicator that shows the relationship between two moving averages (long and short-term) and the price. It is used to measure the strength of an existing move. It is positive when the short-term average is above the long-term one and negative when the long-term average is above the short-term.
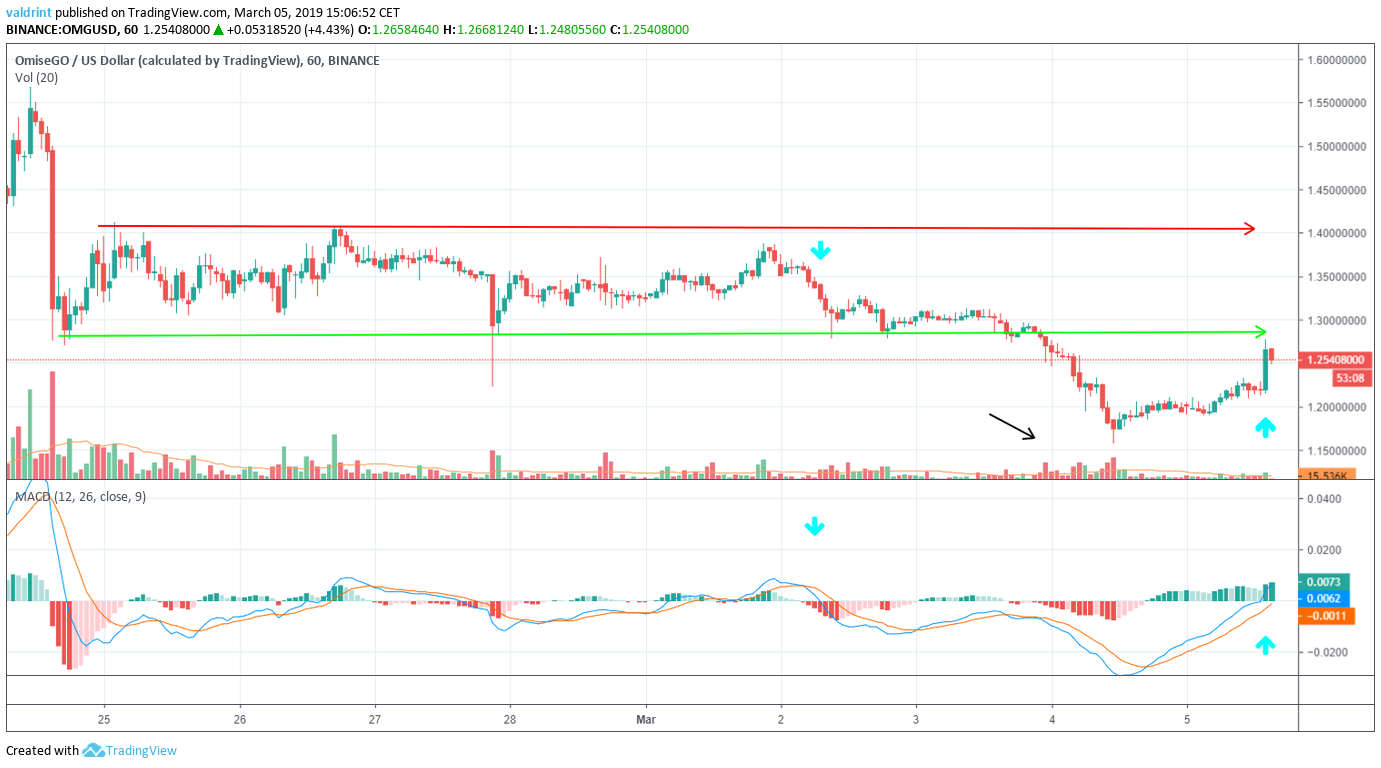
Combined with simple moving averages (SMA), it can be used as a trigger for buy and sell signals. Whenever the MACD line is above 0 and the price is above the 21 (red) and 50-period (green) SMAs.
In the case of OMG, a sell signal would have been triggered on Mar 2nd when the price was at $1.34. Conversely, a buy signal would have been triggered on Mar 5—when the price was at $1.23
As long as prices continue rising—and OMG returns above the support—OMG may move back inside the trading range between $1.28 and $1.40. However, if even if it reaches the support, subsequent price drops might bring OMG to new lows. This would generate possibly new levels of resistance and support.
Do you think that the price of OMG will move inside the trading channel or are price drops looming on the horizon? Let us know what you think in the comments, and be sure to check out our latest Bitcoin Price Predictions!
Disclaimer: This article is not trading advice and should not be construed as such. Always consult a trained financial professional before investing in cryptocurrencies, as the market is particularly volatile.


