


The NEO price has been decreasing since Feb. 14, when it reached a high of ₿.001631. It is currently approaching the important support area found at ₿0.0012.
Neo (NEO) Highlights
- The price broke out from a symmetrical triangle.
- There is support at ₿0.0012.
- NEO is following an ascending support line.
- The weekly RSI is bullish.
Crypto trader @CryptoNTez outlined a NEO chart that shows the price breaking down from the ₿0.00135 support area without even the slightest bounce. He is giving a target of ₿0.0012 as the next area that can initiate a reversal.
update on $NEO
Reached ~1350sats support level and crossed below it like nothing. Our current short here at 10%+ profit..
Next support at ~1200sats w/ UCTS Sell signal printing on the daily..#NEO pic.twitter.com/pWzp8yT2SE
— Nico (@CryptoNTez) February 26, 2020
Will NEO reach the target? If yes, will it bounce afterwards? Continue reading below if you are interested in finding out.
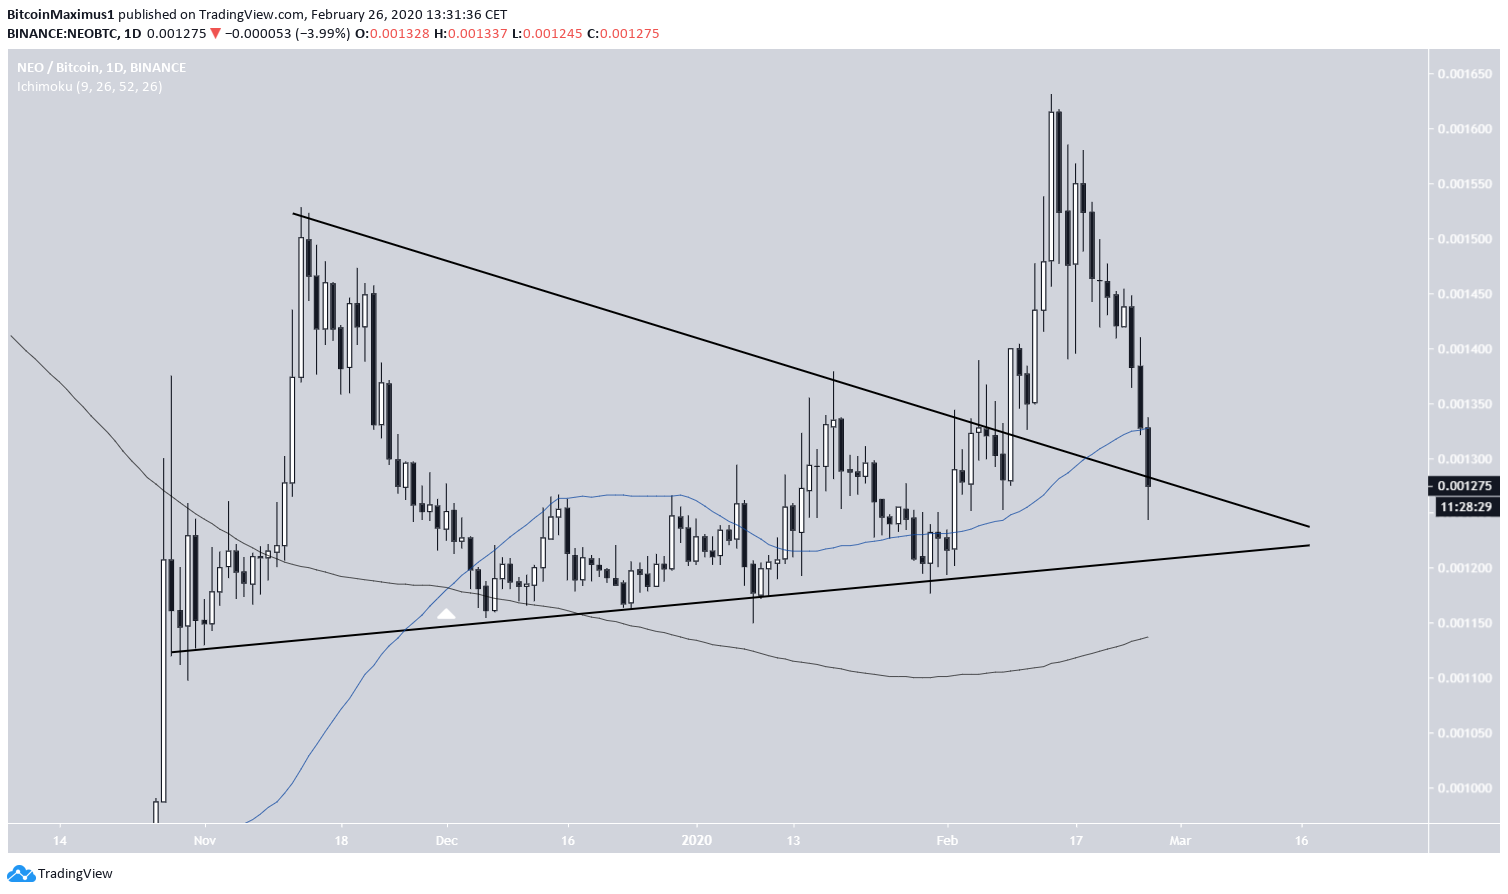
Triangle Breakout
On Feb. 9, the NEO price broke out from a symmetrical triangle. It continued to increase until Feb. 14, when it reached a high of ₿0.001631, but has been decreasing since.
The price is at the resistance line of that triangle. While it seems too late for a validation of it at support, the price could still bounce at the ascending support line of the triangle, which is only slightly below the current price.
In addition, a bullish cross between the 50- and 200-day moving averages (MA) has previously transpired. While the price has fallen below the 50-day MA, it could still find support above the 200-day MA.
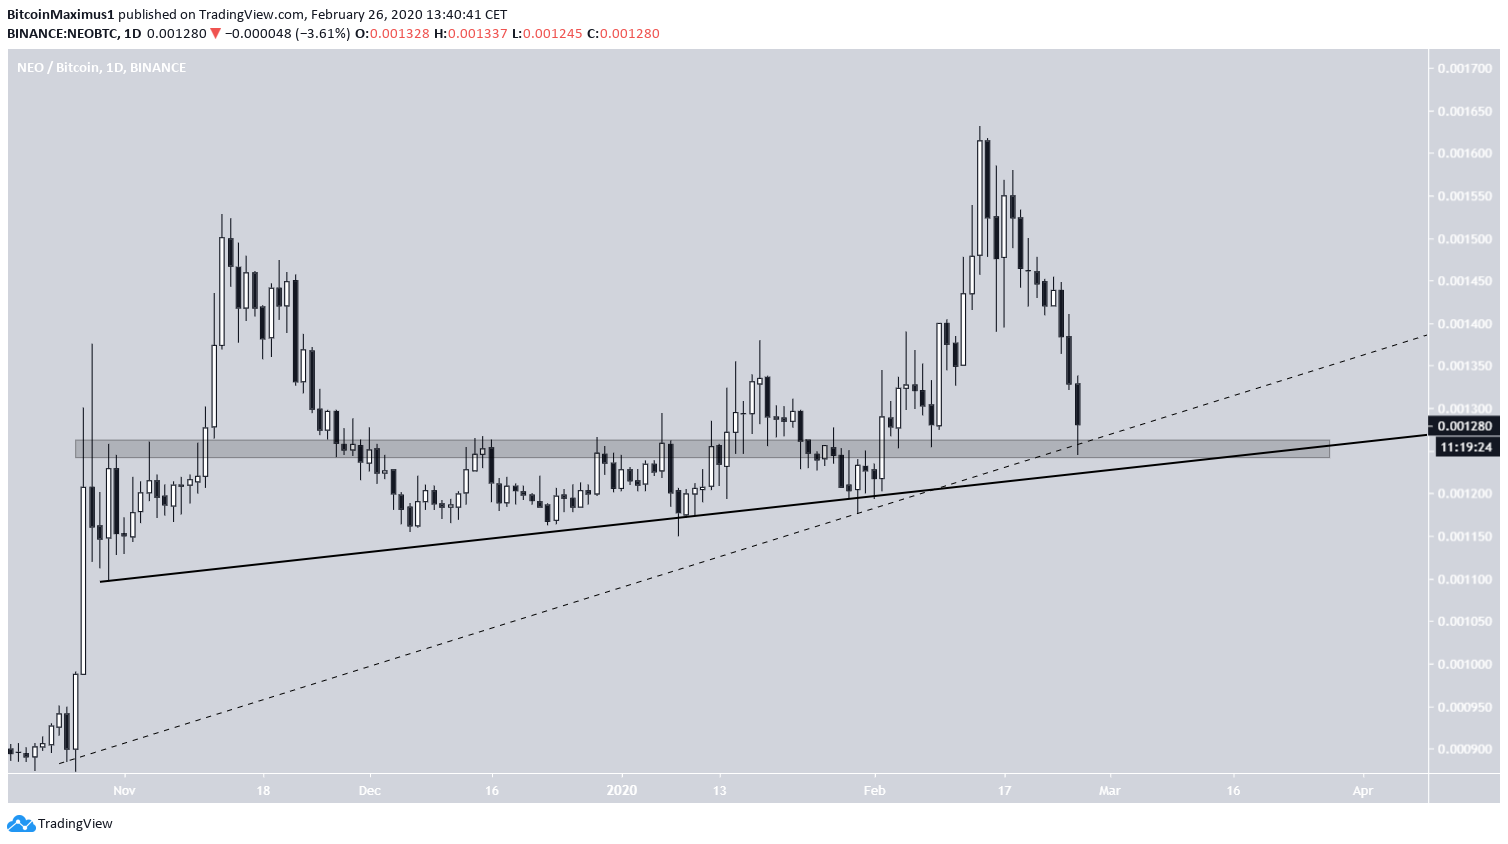
Furthermore, we can see a very strong support area at ₿0.00125, along with a possible ascending support line (dashed). Therefore, the price is at a confluence of supports and is expected to move upwards soon.
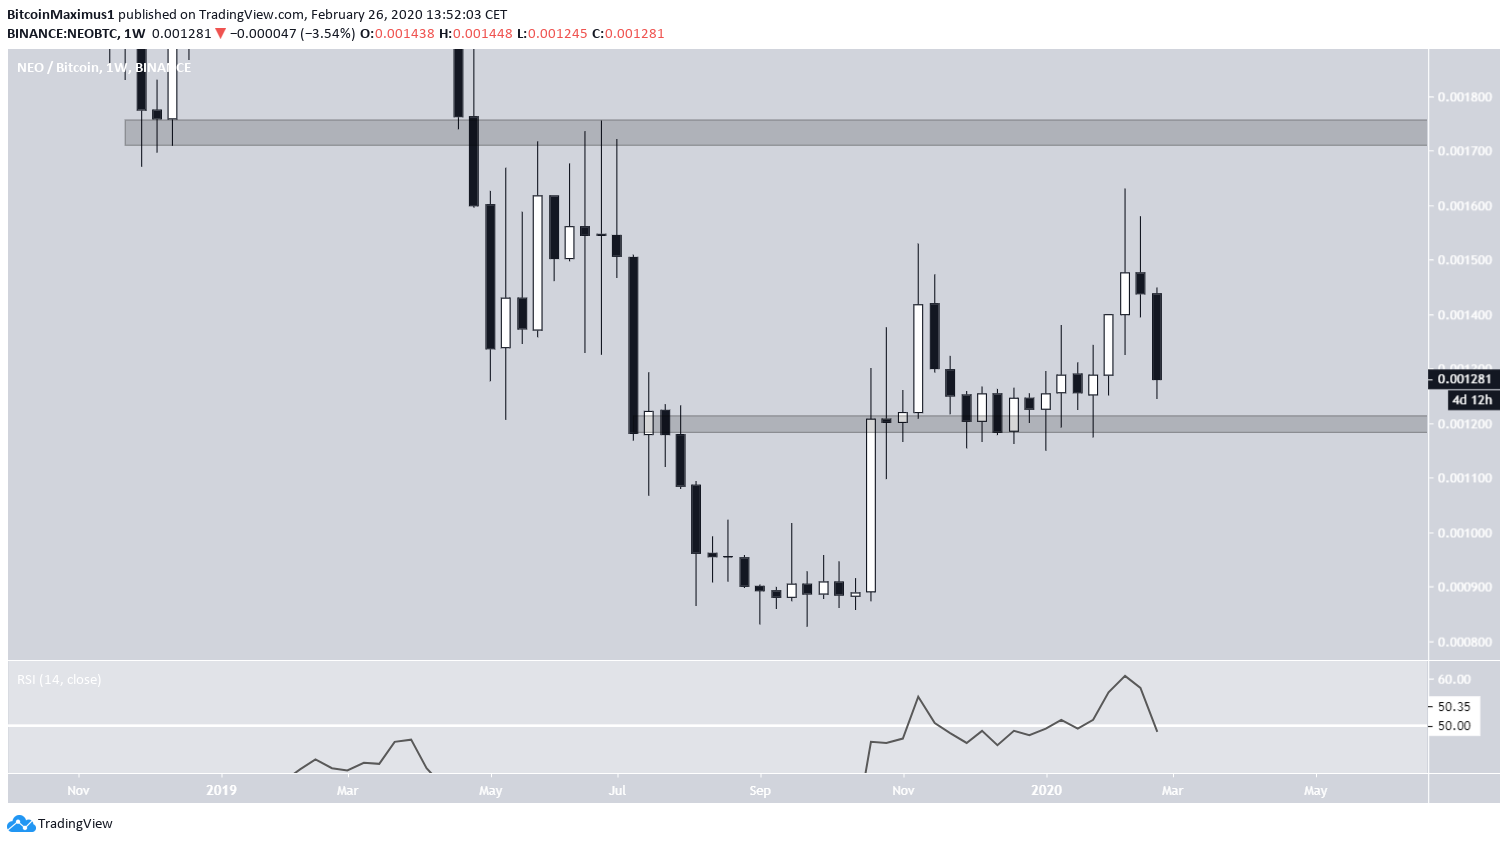
Long-Term Outlook
The weekly outlook is quite bullish. First, we can see that the ₿0.0012 area is the previous breakout level, which has been validated as support.
On a more important note, the weekly RSI has just reached the 50-line from upwards. Therefore, combining this with the confluence of support areas/lines, it makes it an ample place to initiate a bounce.
If the price does so, the next resistance level is found at ₿0.00175. This possible movement would be invalidated with a clear close below the ₿0.0012 area.
To conclude, the NEO price has been decreasing significantly but is approaching a significant support area at ₿0.0012, which we believe will be successful in reversing the current bearish trend.


