


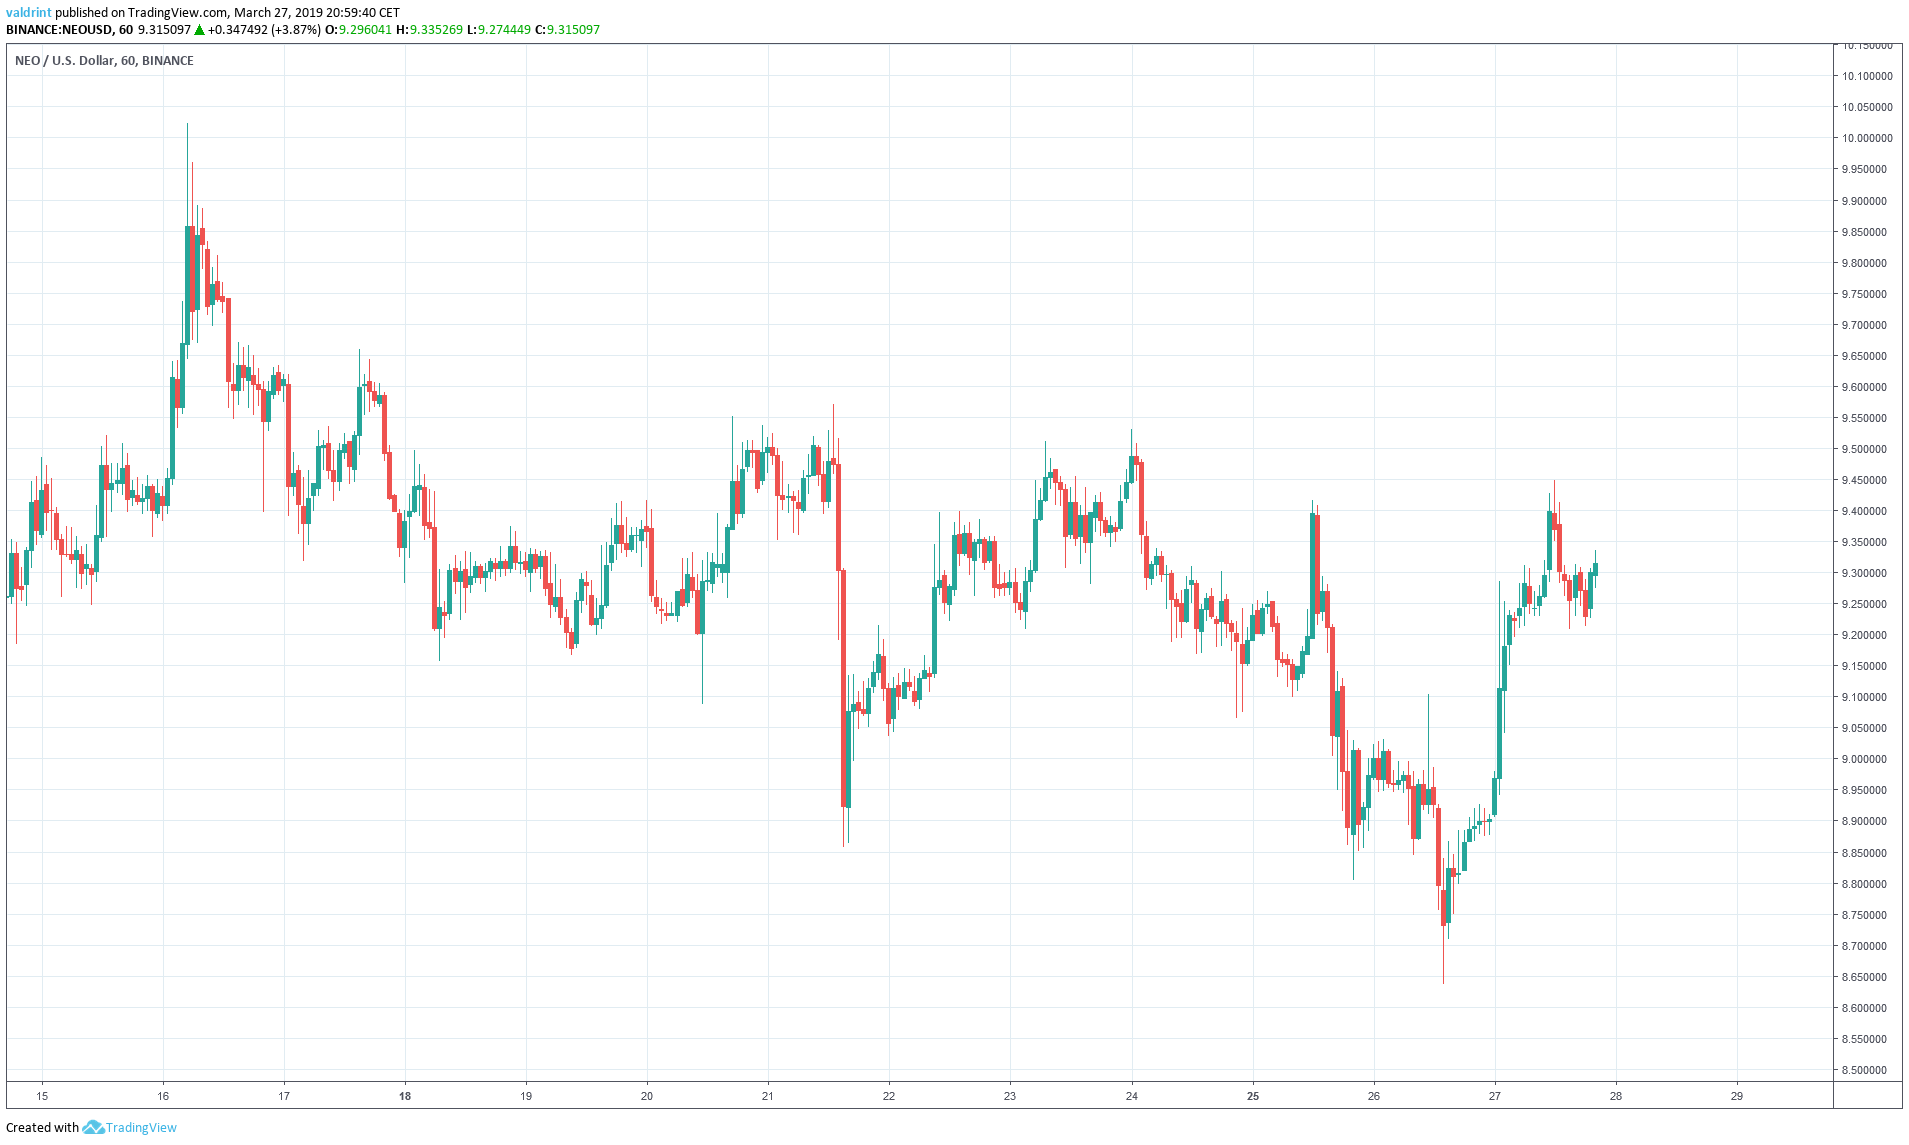
On Mar 16, 2019, the price of NEO (NEO) reached a high of $10. It has been on a downtrend since, alternating between gradual and sharp decreases. It reached a low of $8.63 on Mar 26.
Will NEO’s price keep falling or can we expect a rebound to new highs?
Based on today’s analysis, we believe the price of NEO is likely to decrease at a steady rate as predicted by the channel defined below until a possible breakout.
NEO (NEO): Trends and Highlights for March 27, 2019
- The price has been on a downtrend since Mar 16.
- NEO is trading inside a descending channel.
- There is bullish divergence developing in the RSI and the MACD.
- There are resistance areas near $9.85 and $9.60.
- There are support areas near $8.75 and $8.30.
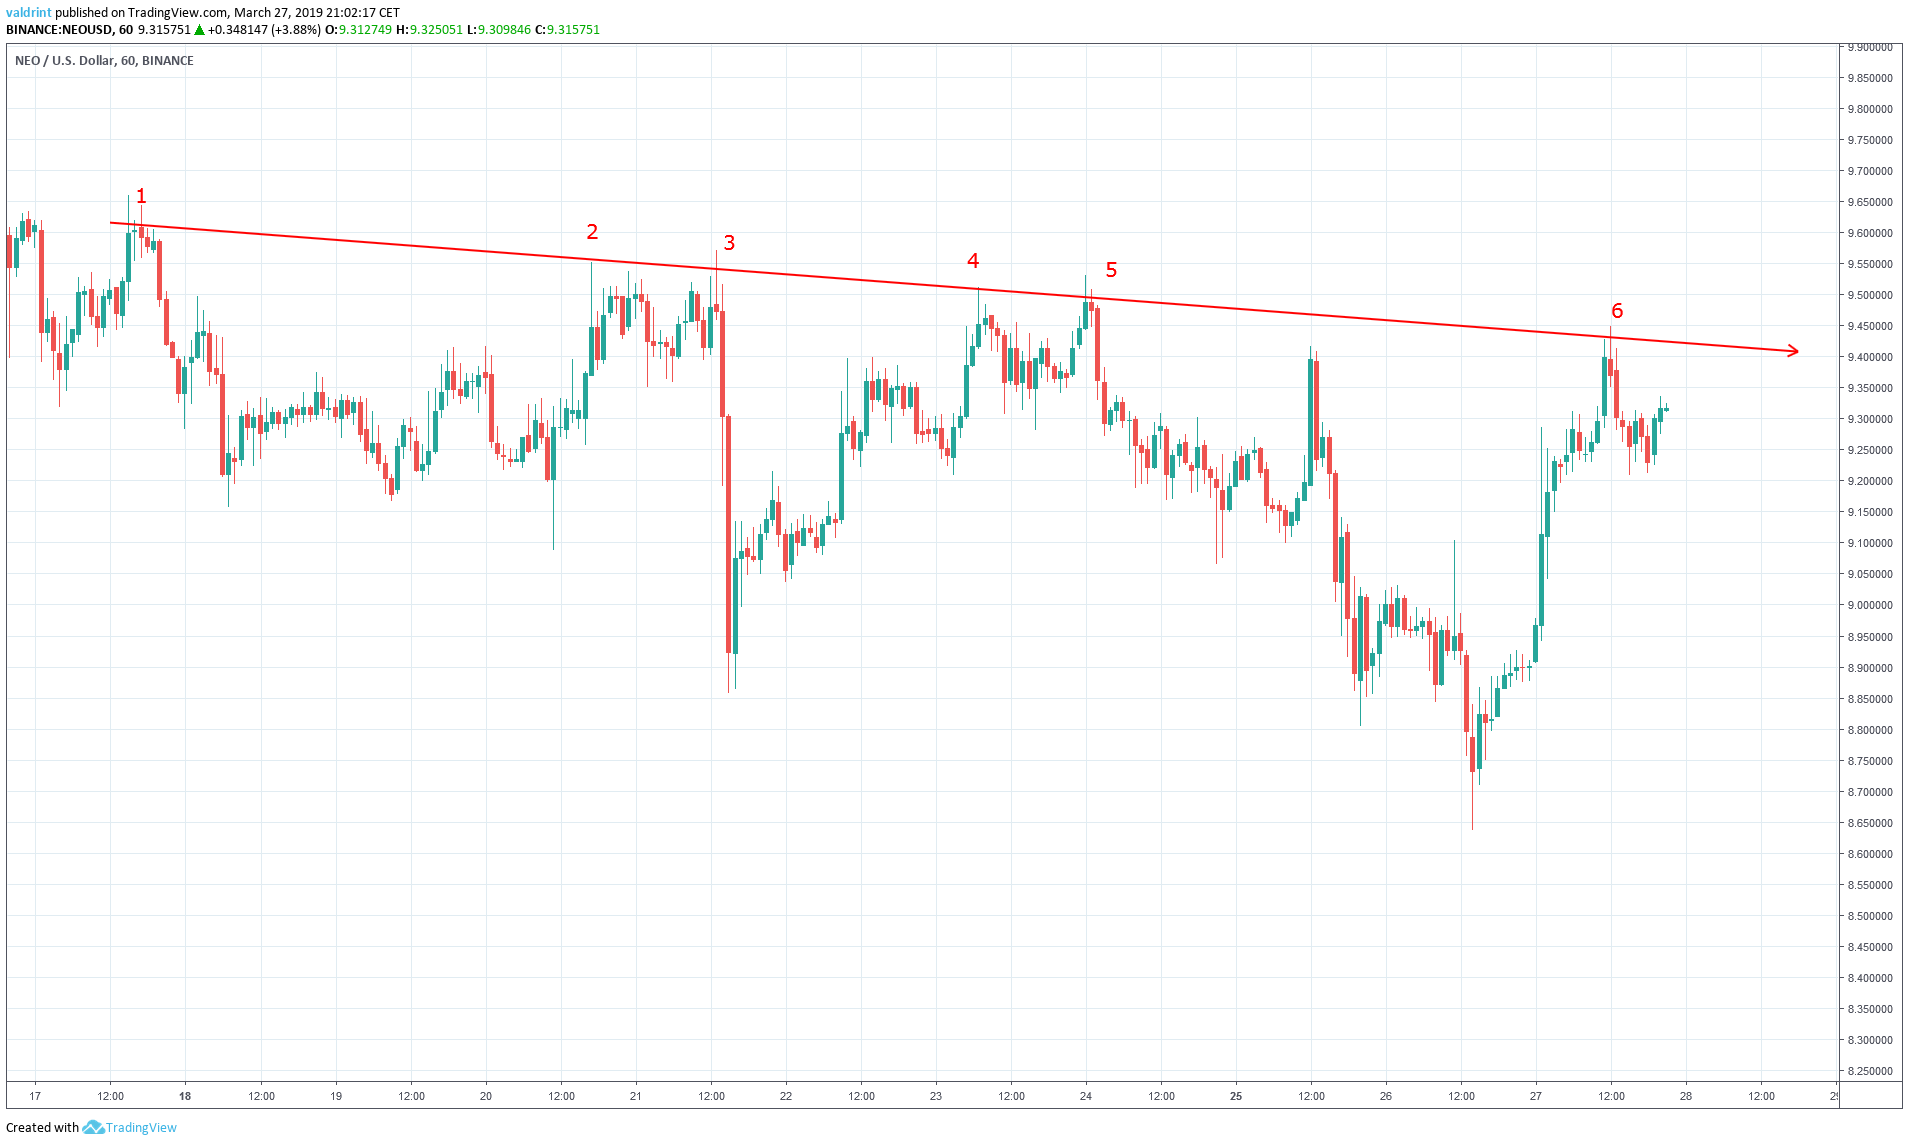
Descending Channel
To begin, we define NEO’s current trading pattern by analyzing the price of NEO on Binance at one-hour intervals from Mar 17 to Mar 27.
The price made a high of $9.65 on Mar 17. A gradual drop ensued. Several market cycles have been completed with each high being lower than the previous one. Tracing these highs gives us a descending resistance line:
On Mar 21, the price made a low of $8.85. A sharp upward move ensued, followed by a gradual downtrend. Price made a lower low of $8.63 on Mar 26.
Tracing these lows gives us a descending support line:
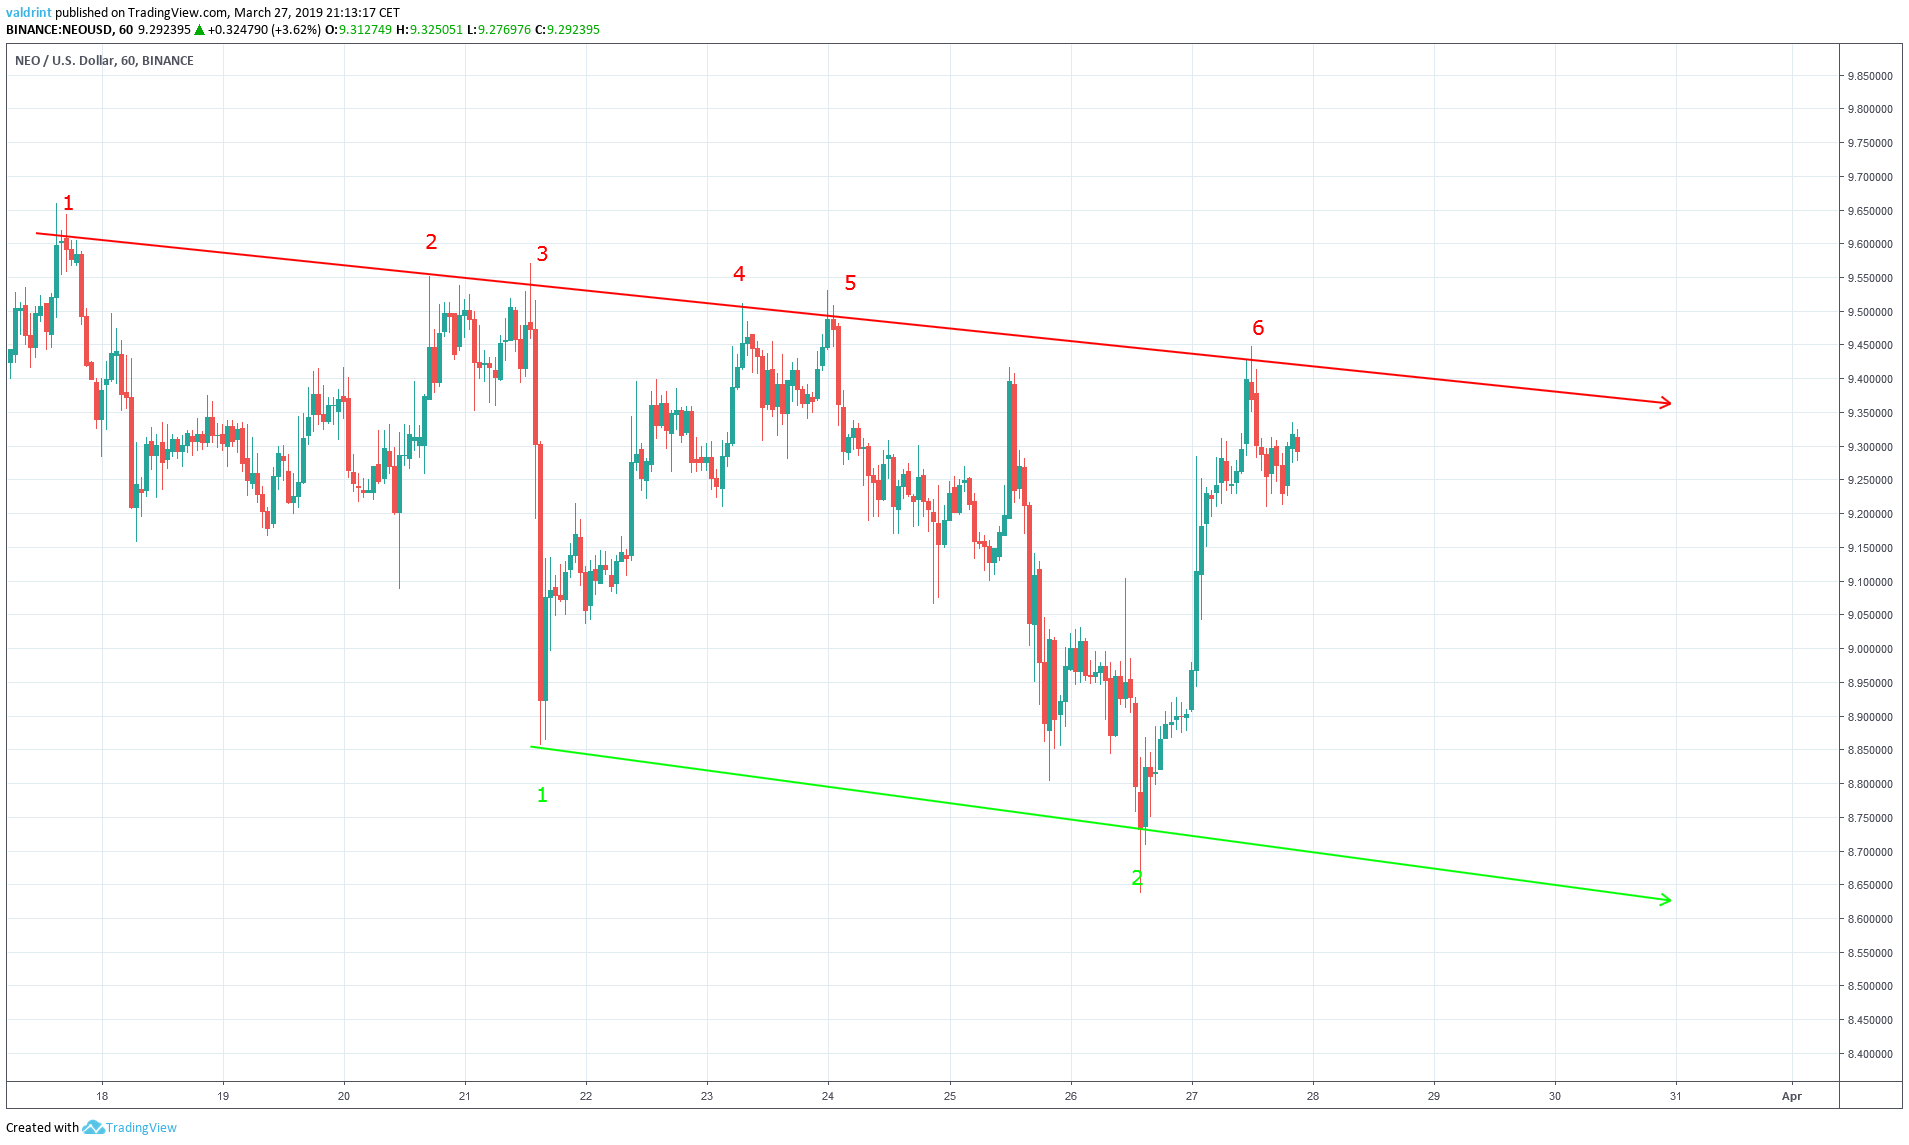
The resistance and support lines combine to create a descending channel, which is a neutral pattern, making price increases and decreases equally likely within the channel.
However, the support line has only been touched twice compared to the resistance line which has been touched six times. The support traced, thus, may not be valid. We must wait to see if it will be touched a third time before this can be assessed for certain.
Bullish Divergence
Now we use technical indicators to better analyze price fluctuations.
Combining MACD and RSI bullish/bearish divergence with support/resistance essentially predicts price fluctuations.
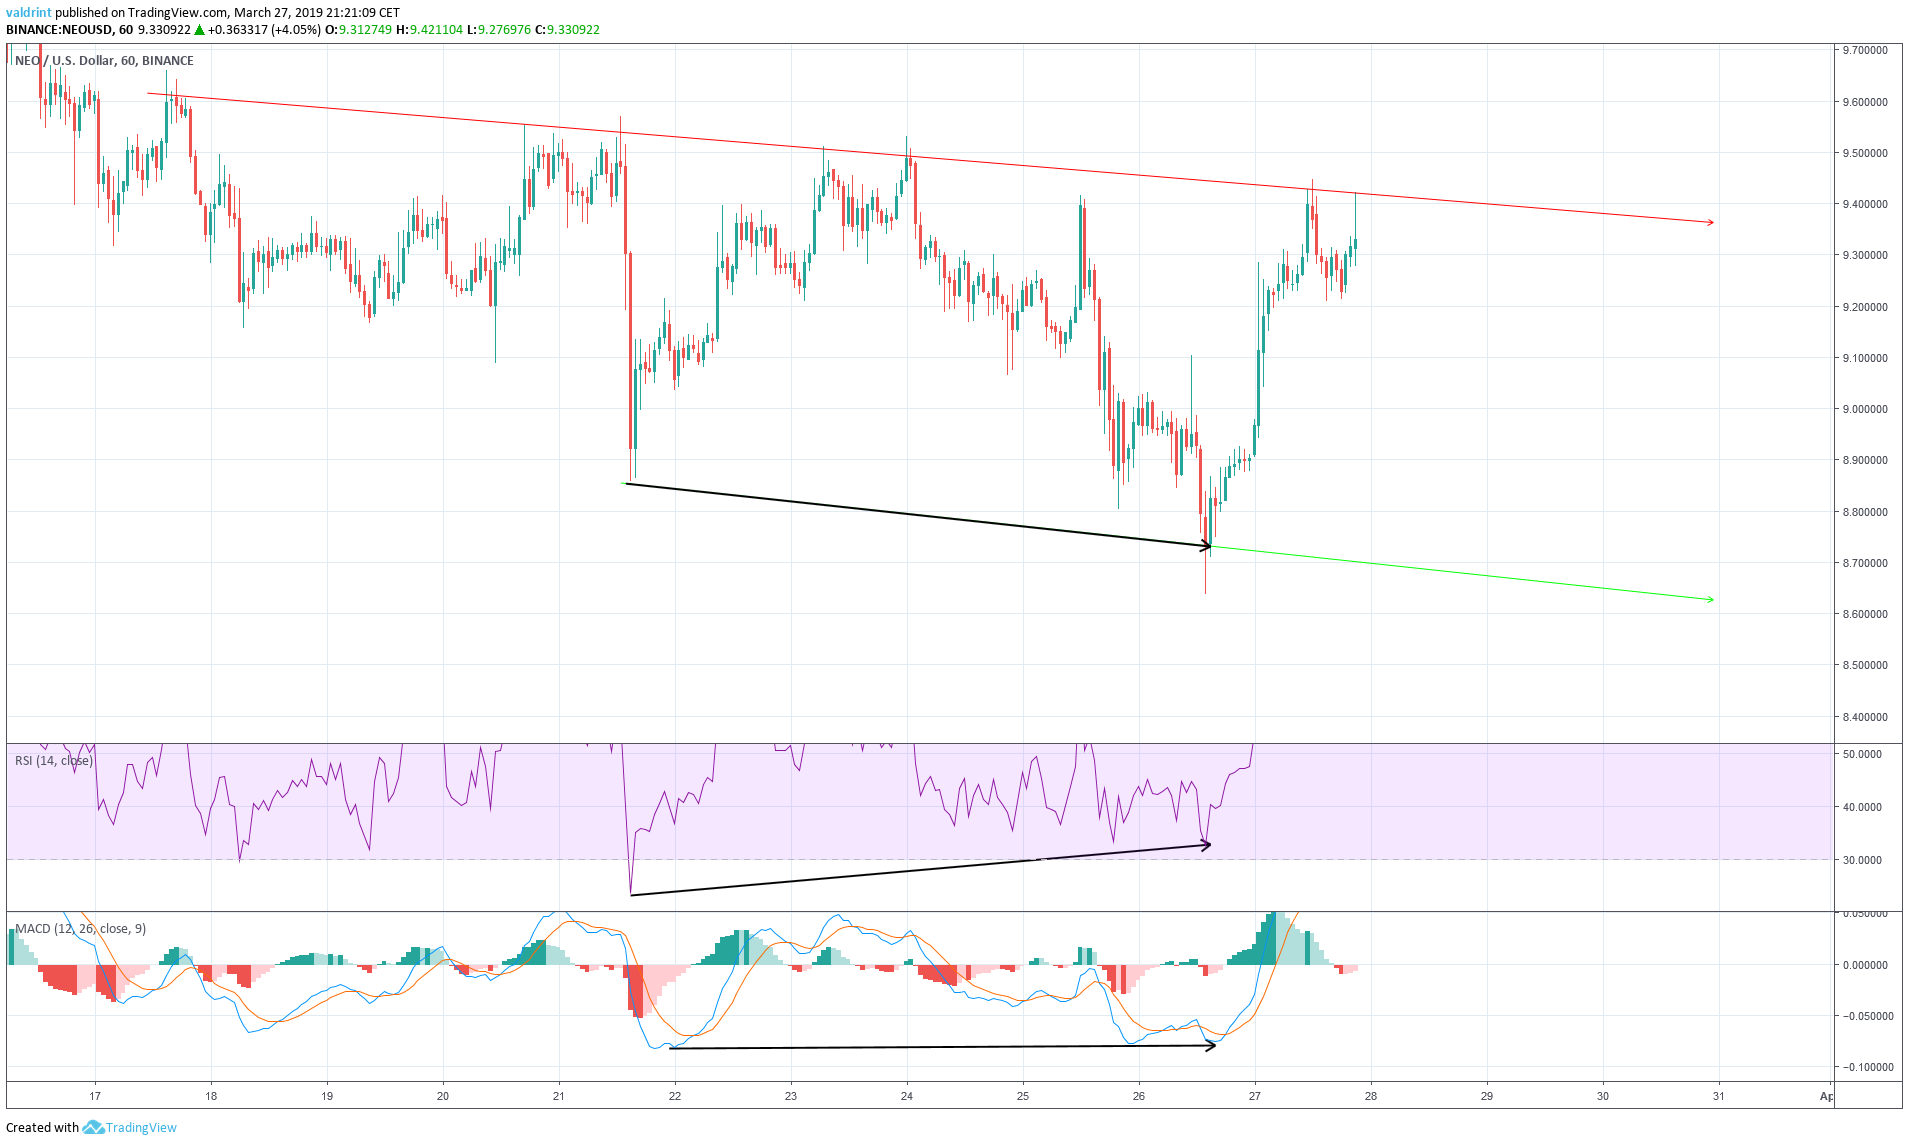
On Mar 21, the price made a low of $8.85. It made a lower low of $8.63 on Mar 26.
Similarly, the RSI and the MACD made the first low on Mar 21. However, they proceeded to generate higher values on Mar 26.
This is known as bullish divergence and often precedes price increases. In the case of NEO, an upward move was initiated shortly after the development of the divergence.
Reversal Areas
The price of NEO on Binance is analyzed at two-hour intervals from Mar 9 to Mar 27 in order to better visualize potential reversal areas in the future.
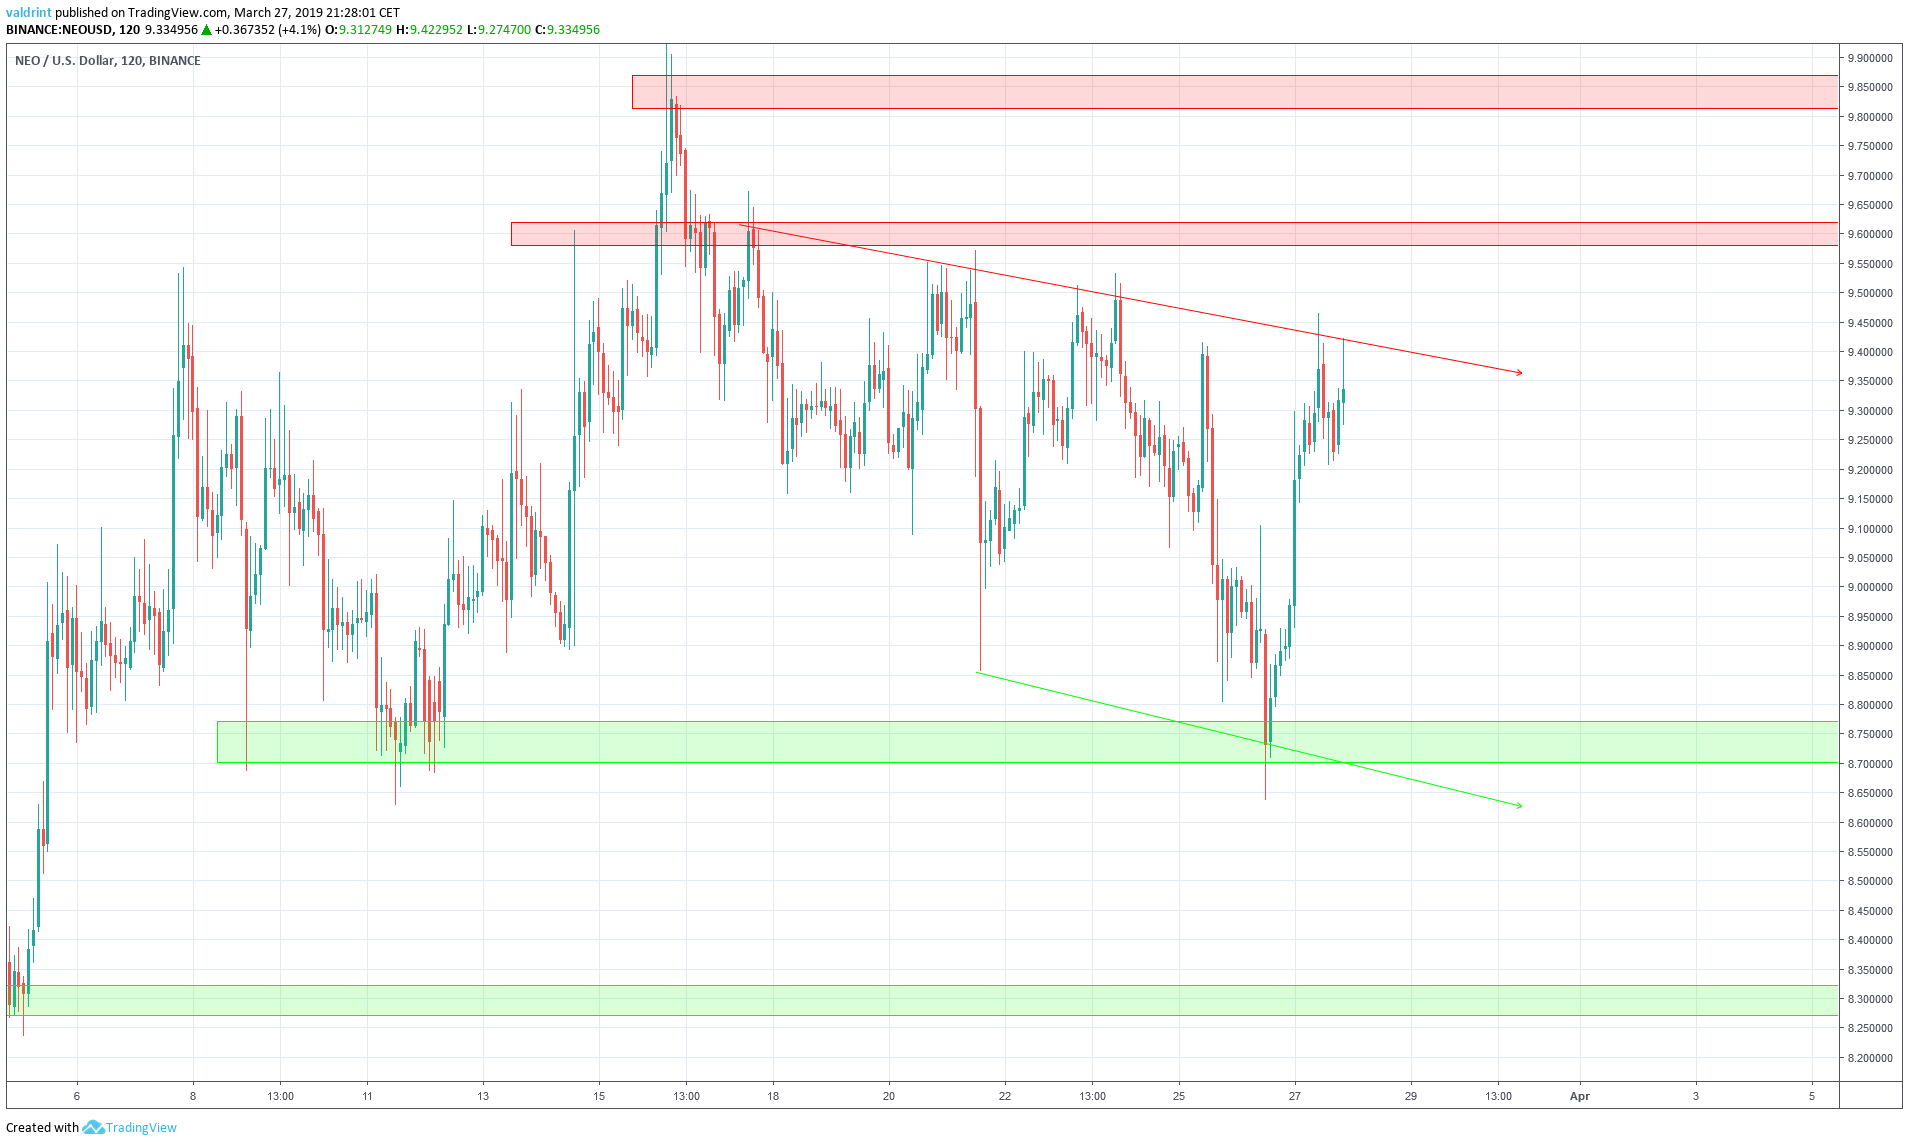
The first area of resistance is found near $9.60. If the price breaks out from the channel, it is likely that it would provide a reversal. The next area of resistance is found near $9.85. Based on this analysis, the price may eventually reach at least one of these areas.
The closest support area is found near $8.75. If the price keeps decreasing at the rate predicted by the channel, it will eventually reach this area. The next support area is found near $8.25. Based on this analysis, it is unlikely that the price will reach this level.
Summary of Analysis
Based on this analysis, the price of NEO is likely to keep decreasing at a steady rate predicted by the channel until a breakout occurs.
Do you think the price of NEO will keep decreasing at a steady rate? Let us know in the comments below.
Disclaimer: This article is not trading advice and should not be construed as such. Always consult a trained financial professional before investing in cryptocurrencies, as the market is particularly volatile.


