
The NEO price has broken out above an important resistance area and moving average, and has validated them as support afterward.
As long as the price stays above these two levels, its outlook is bullish and NEO is expected to continue increasing.
NEO Long-Term Movement
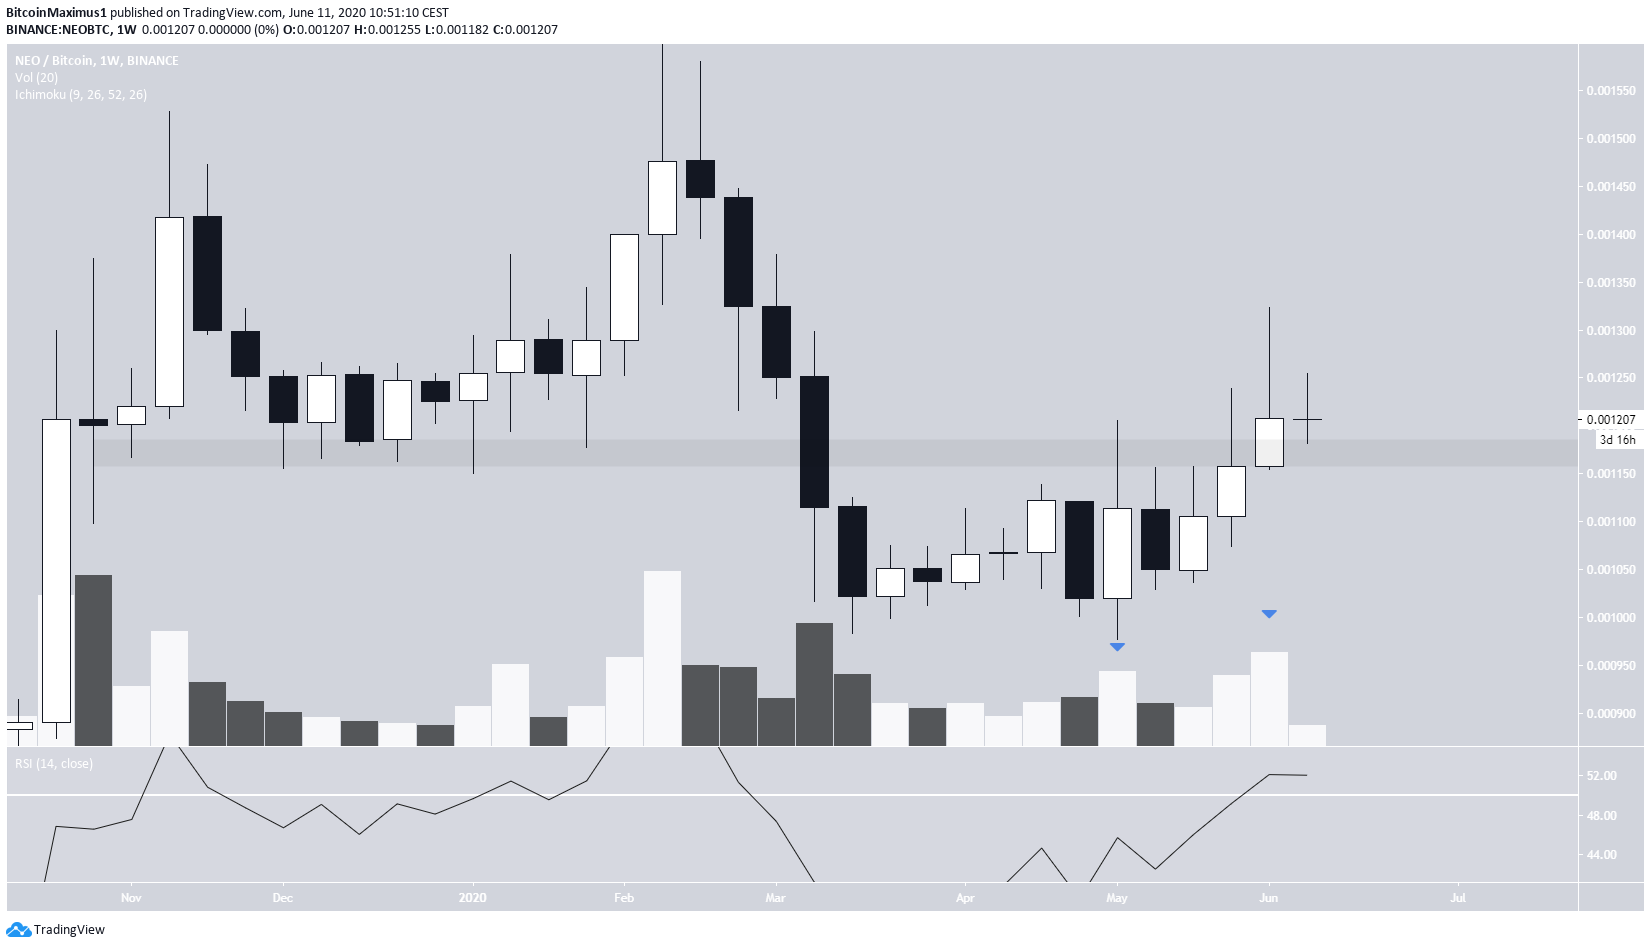
The weekly chart shows that NEO has moved above an important resistance area at ₿0.001190 with high volume. If the price is able to validate this area as support, which looks likely, it is expected to continue increasing towards ₿0.0015.
During this breakout, the weekly RSI moved above 50, a sign that the price is in a bullish trend.
Moving Average
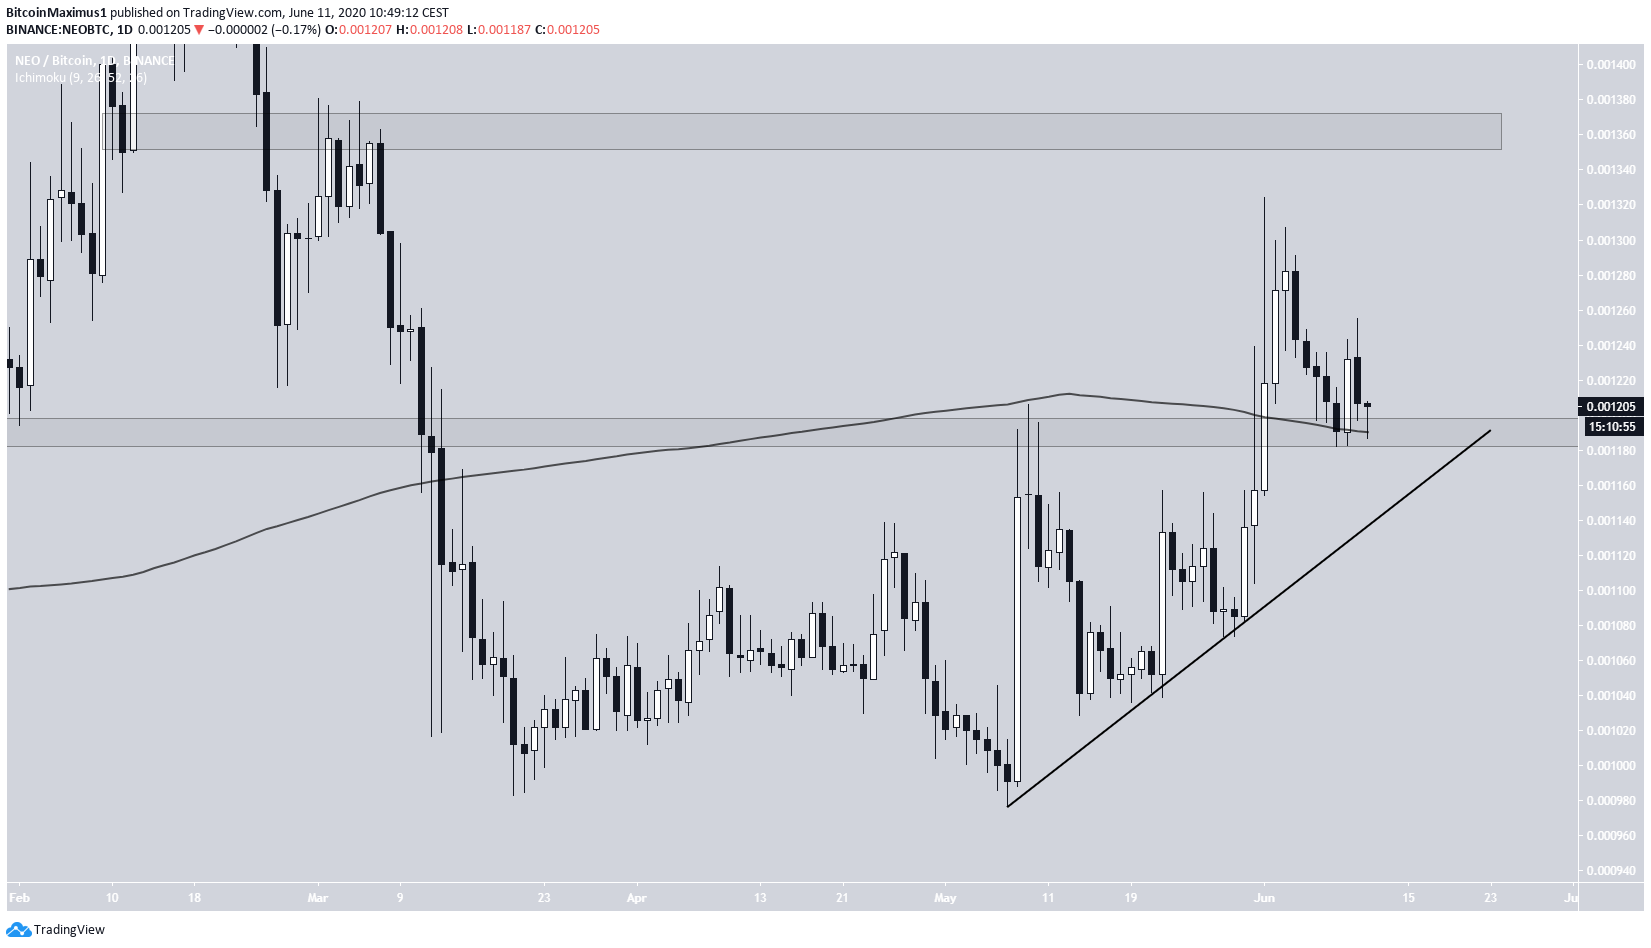
The daily chart provides a bullish outlook. The price has moved above the 200-day moving average (MA), which had been providing resistance since March, and has validated it as support afterward. In addition, it is following an ascending support line, which will soon coincide with the MA and the ₿0.00119 support area.
Therefore, this is a very likely place for a reversal which could take NEO all the way to the closest resistance area at ₿0.00136.
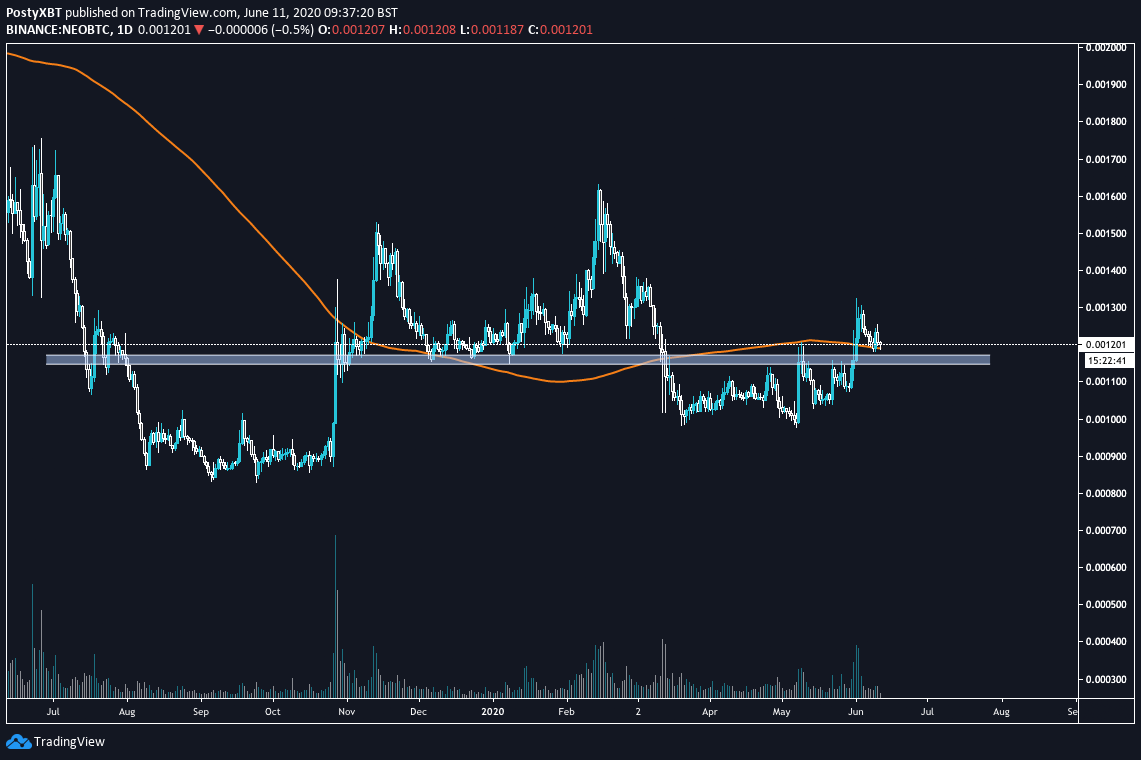
Cryptocurrency trader @PostyXBT agrees with this assessment and stated that the price should begin moving upwards after a re-test of the 200-day MA, which has already occurred.
Short-Term Movement
The short-term price movement aligns with the bullish outlook from the longer-term time-frames.
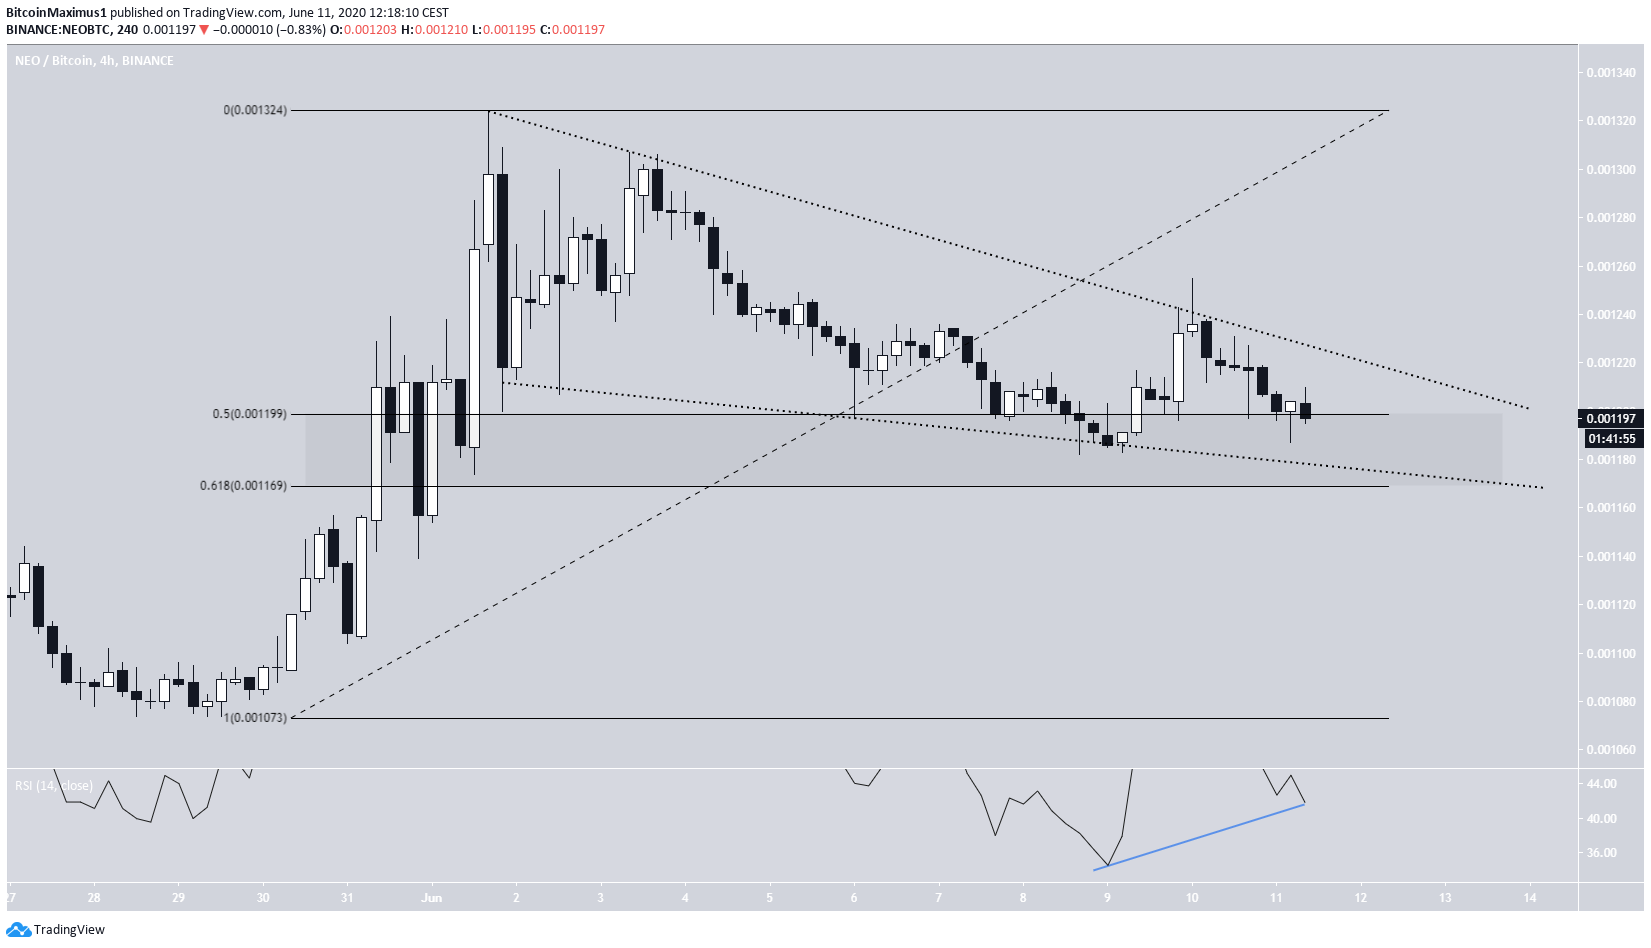
The price seems to be trading inside a descending wedge and is currently between the 0.5-0.618 Fibonacci levels of the entire upward movement. Besides the wedge being considered a bullish pattern, there is a possible bullish divergence in the RSI, which suggests that the price will break out.
If so, this could be the beginning of the upward movement that takes the price towards the resistance area outlined in the previous section.
To conclude, the NEO price has retraced all the way to an important support level and MA and is showing short-term signs of reversal, which could lead to a continuation of its upward move.
