

The Neo (NEO) price decreased considerably on Feb 22-23 but has regained a large part of its losses due to a significant bounce.
NEO should continue increasing towards the long-term $77 resistance area and potentially move higher.
Current Movement
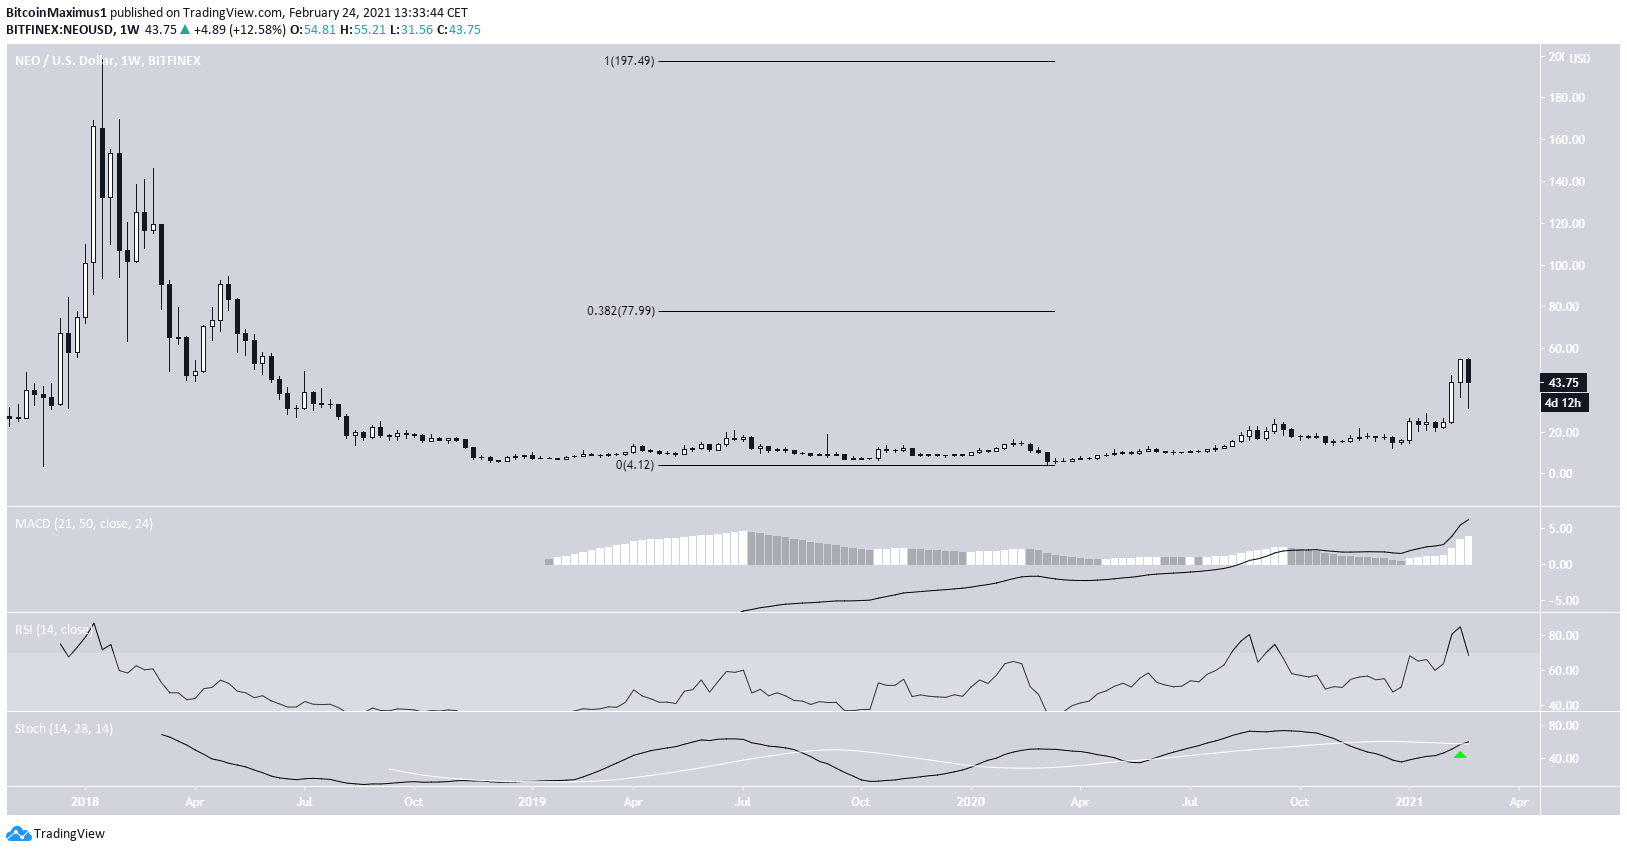
The weekly chart shows that despite the ongoing decline, NEO may create a very long lower wick, resulting in a relatively bullish candlestick before the weekly close.
Technical indicators are also bullish, evident by the bullish cross in the Stochastic oscillator and the ongoing increase in the MACD.
The closest long-term resistance area is at $77, the 0.382 Fib retracement level of the entire downward movement measuring from the all-time high price.
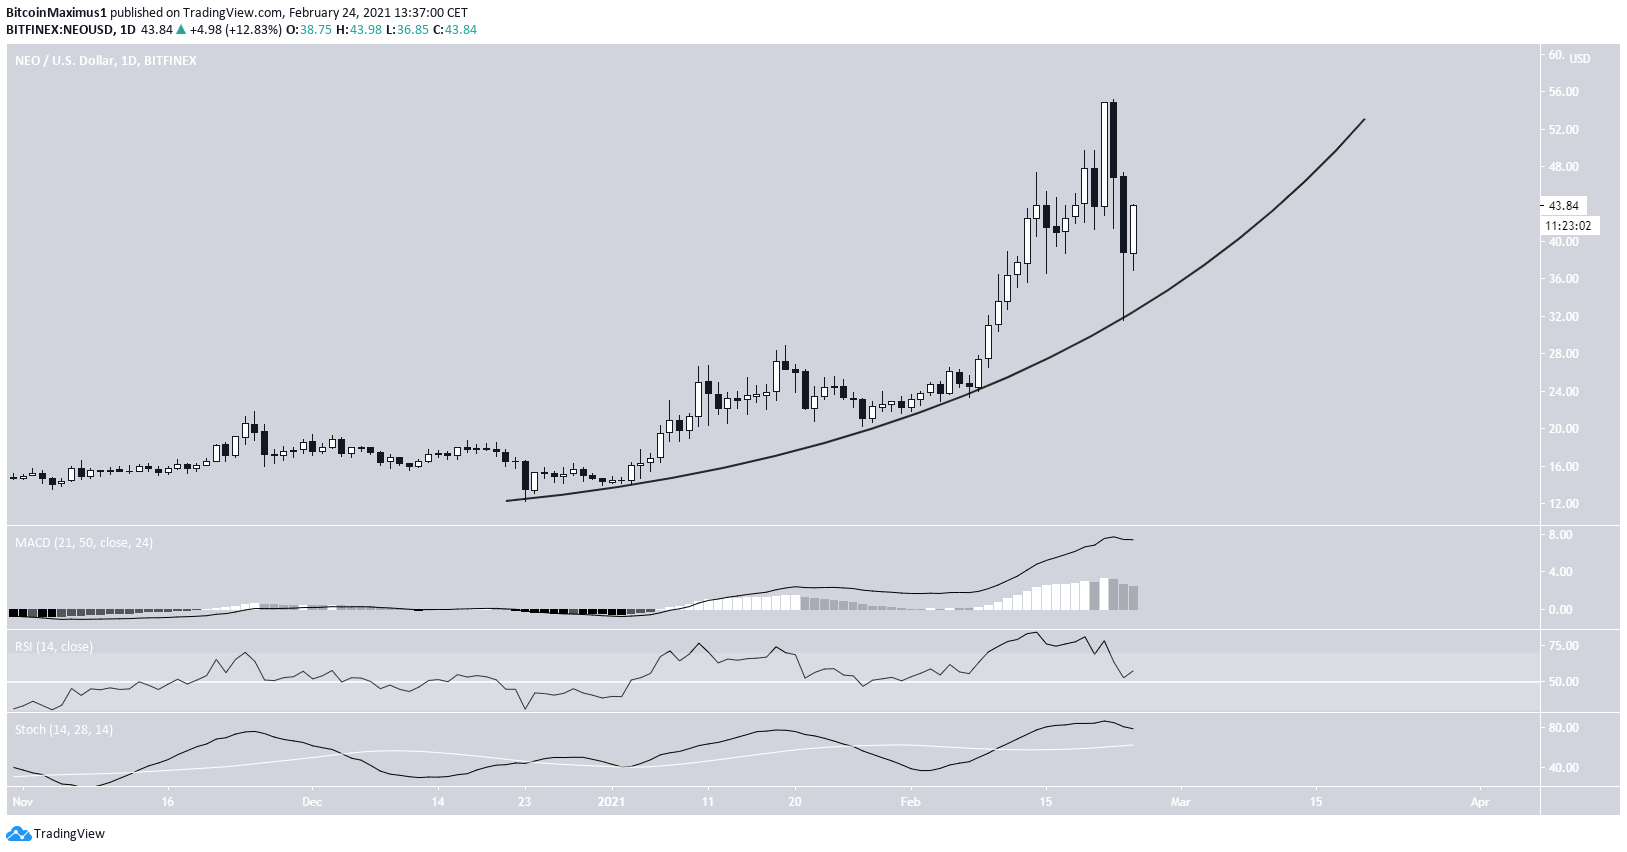
The shorter-term daily chart shows that the current move is parabolic and is devoid of any trading structure.
However, NEO has bounced at this parabolic support line. Technical indicators are also bullish, supporting the possibility of a bullish continuation towards the previously outlined long-term $77 resistance area.
Wave Count
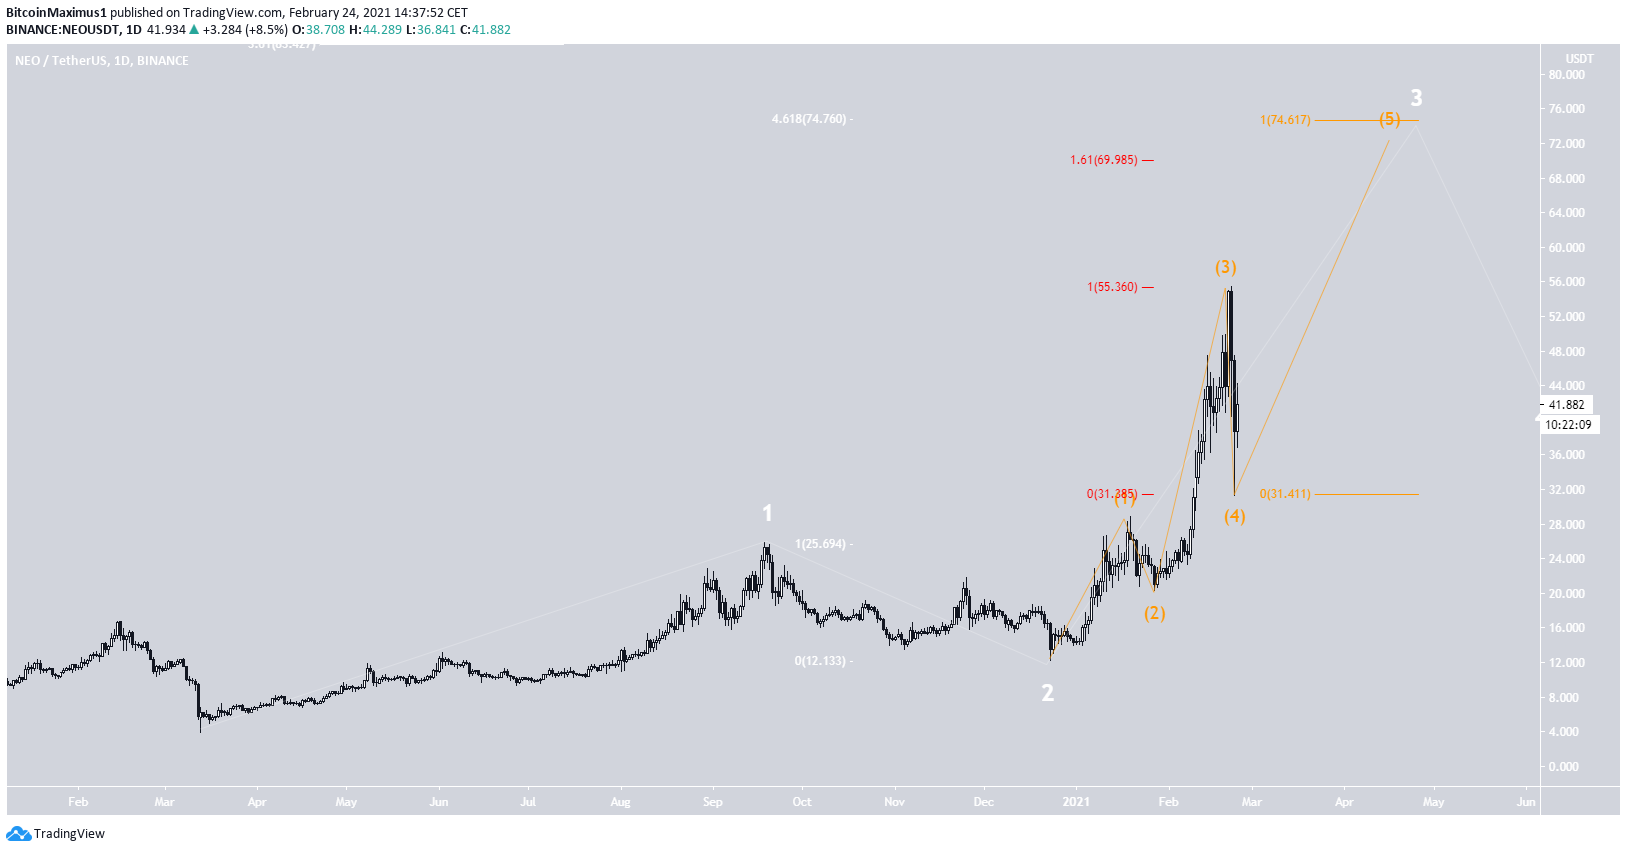
Cryptocurrency trader @CryptoCohen_ outlined a chart showing a bullish impulse that is likely to rally towards $80 and potentially higher.

The wave count suggests that it is in the fifth and final sub-wave (orange) of wave three (white) of a bullish impulse that began on Mar. 2020.
The most likely target for the top of this move is between $70-$75, found by using an external Fib retracement on wave two and sub-wave four (white and red) and a Fib projection on sub-waves 1-3 (orange).
NEO may correct after this.
NEO/BTC
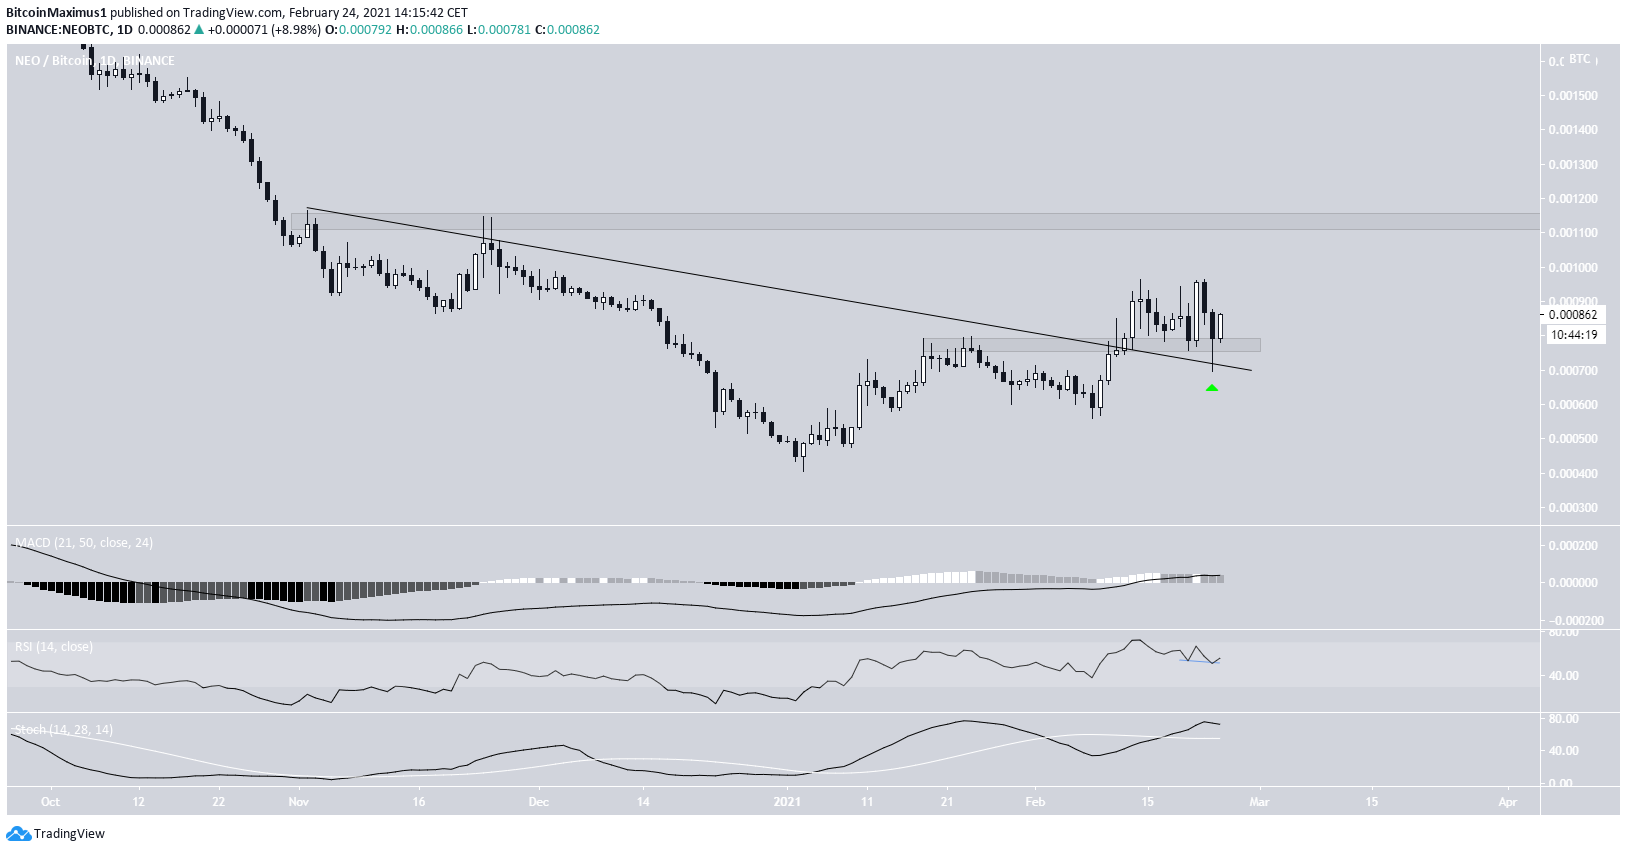
The NEO/BTC chart looks similarly bullish.
NEO has broken out from a descending resistance line and validated it as support alongside the ₿0.00078 area, which should now act as support.
Technical indicators are bullish, especially evident by the hidden bullish divergence in the RSI. This indicates that an upward move is likely to take NEO to ₿0.00114.
Conclusion
To conclude, the USD and BTC charts appear bullish and should move towards their respective resistance areas at $77 and ₿0.00114.
For BeInCrypto’s latest Bitcoin (BTC) analysis, click here.
Disclaimer
In line with the Trust Project guidelines, this price analysis article is for informational purposes only and should not be considered financial or investment advice. BeInCrypto is committed to accurate, unbiased reporting, but market conditions are subject to change without notice. Always conduct your own research and consult with a professional before making any financial decisions. Please note that our Terms and Conditions, Privacy Policy, and Disclaimers have been updated.
