
On January 31, the NEM (XEM) price broke out above a long-term resistance line. The price has increased by 55 percent since.
NEM (XEM) Highlights
- XEM has broken out above a long-term resistance line.
- A golden cross is about to transpire.
- The weekly RSI is bullish
- The price is trading inside a short-term ascending channel.
- There is resistance at 800 and 1400 satoshis.
Trader @CryptoMichNL outlined a XEM chart that shows that the price has broken out above a significant resistance area and is moving upwards. The closest targets are found at 750 and 1040 satoshis.
Nice breakout of a long sideways range here.
Facing next resistance.600 – 630 satoshis area potential levels to look for longs.
Breakout of 750 satoshis and I'd target 1040 satoshis. pic.twitter.com/wohEXpmcuM
— Michaël van de Poppe (@CryptoMichNL) February 14, 2020
Will XEM be successful in reaching the targets? Continue reading below if you are interested in finding out.
Downward Trend
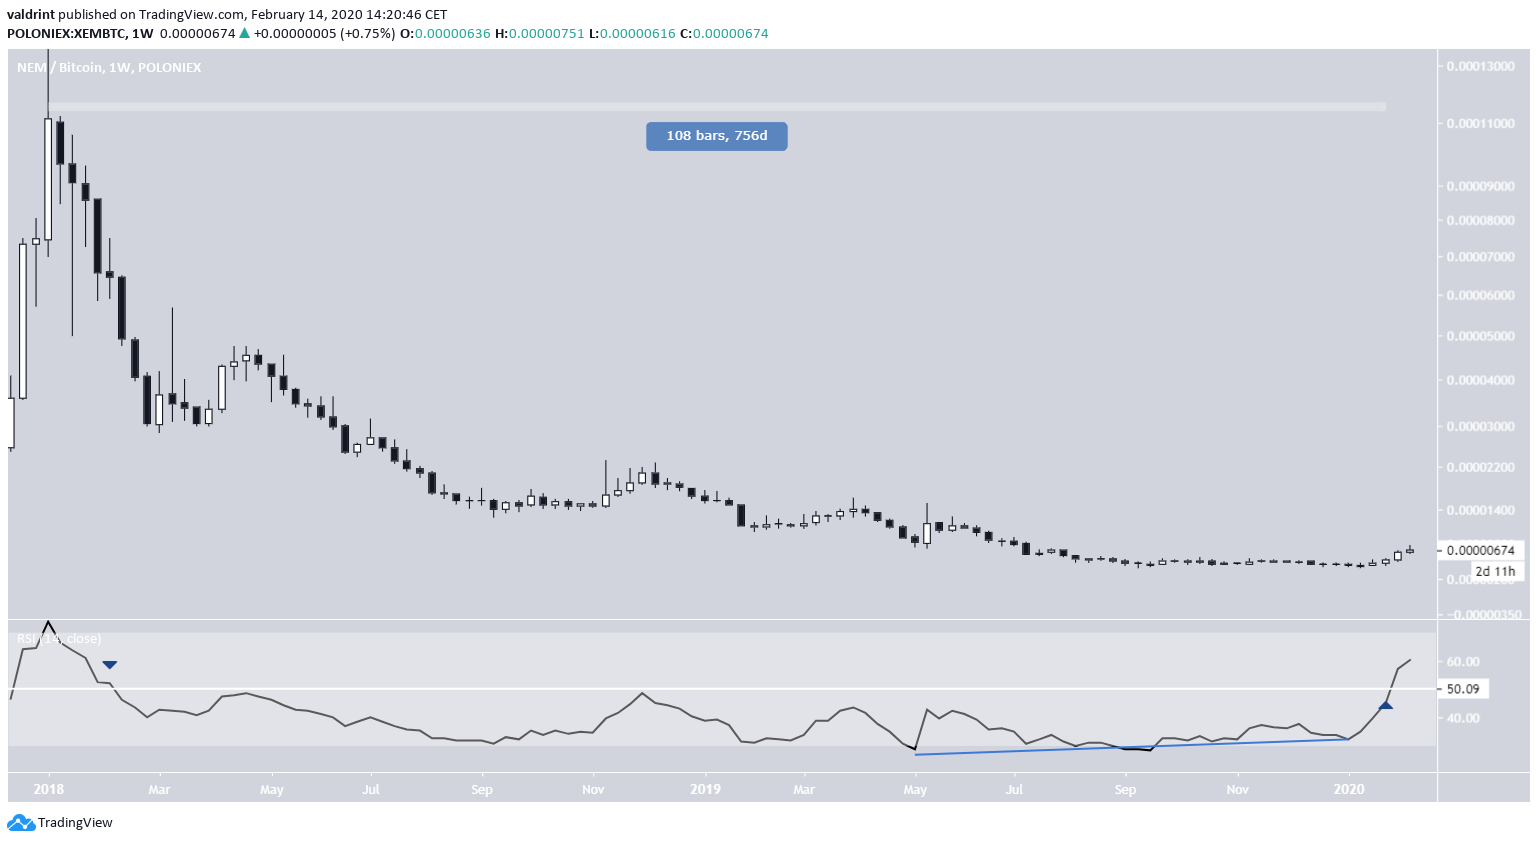
The XEM price has been down-trending since January 2018. The weekly RSI perfectly highlights this, since it decreased below the 50-line shortly afterward and has been below since.
Beginning in May 2019, the weekly RSI began to generate a bullish divergence and moved above the 50-line on January 31 — 756 days after the January 2018 high. This is a strong sign of a trend reversal, especially since it is succeeding a lengthy period of bullish divergence.
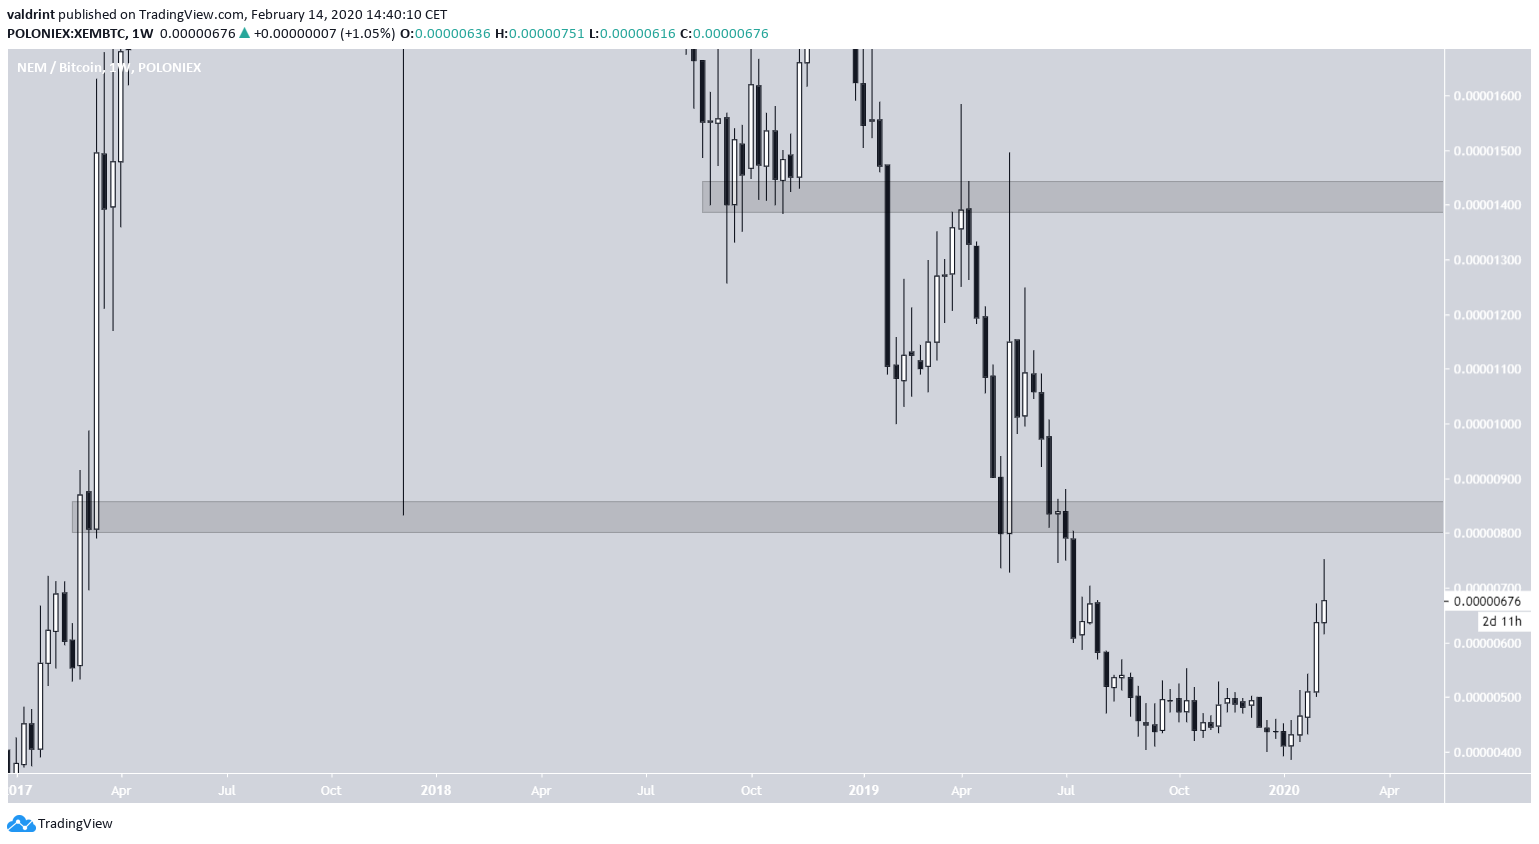
Our resistance areas slightly differ from those in the tweet. The first major resistance area is found at 800 satoshis, an area that previously has acted as support.
While there is minor resistance at 1000 satoshis, the next important resistance area is likely found at 14000 satoshis.
Resistance Line Breakout
On January 31, the date that the weekly RSI moved above 50, the price indeed broke out from a 448-day descending resistance line. The line had been validated numerous times, so combining this breakout with the weekly analysis we can presume that the price has indeed reversed its long-term trend and is now bullish.
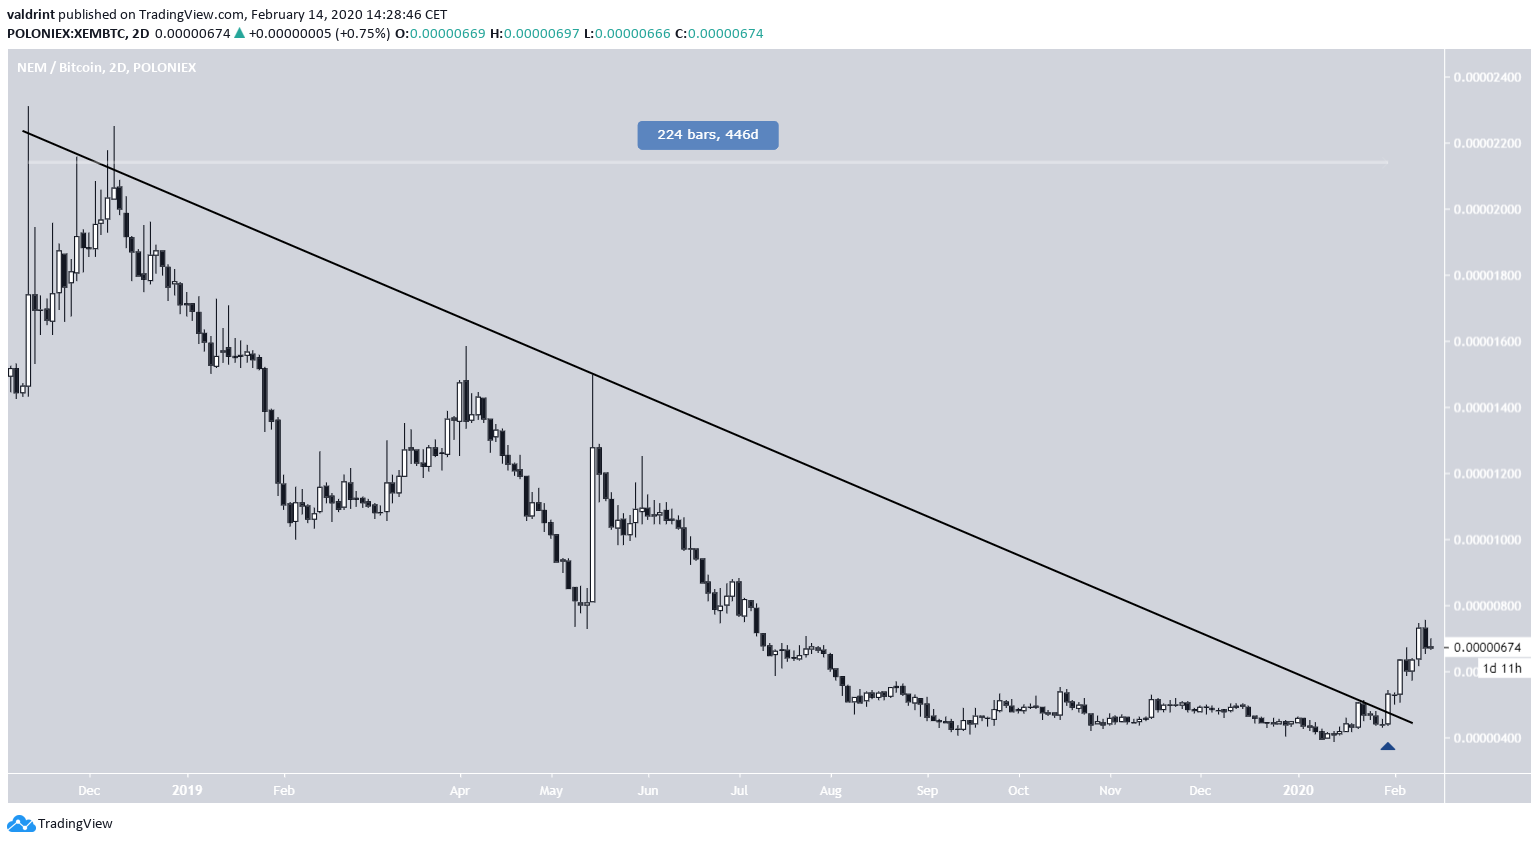
Looking closer at this movement, we can see that a bullish cross between the 50- and 200-day moving averages (MA) has just transpired, otherwise known as a golden cross. This further confirms that the price has already begun an upward trend.
In addition, it is possible that the price is following a very steep ascending support line.
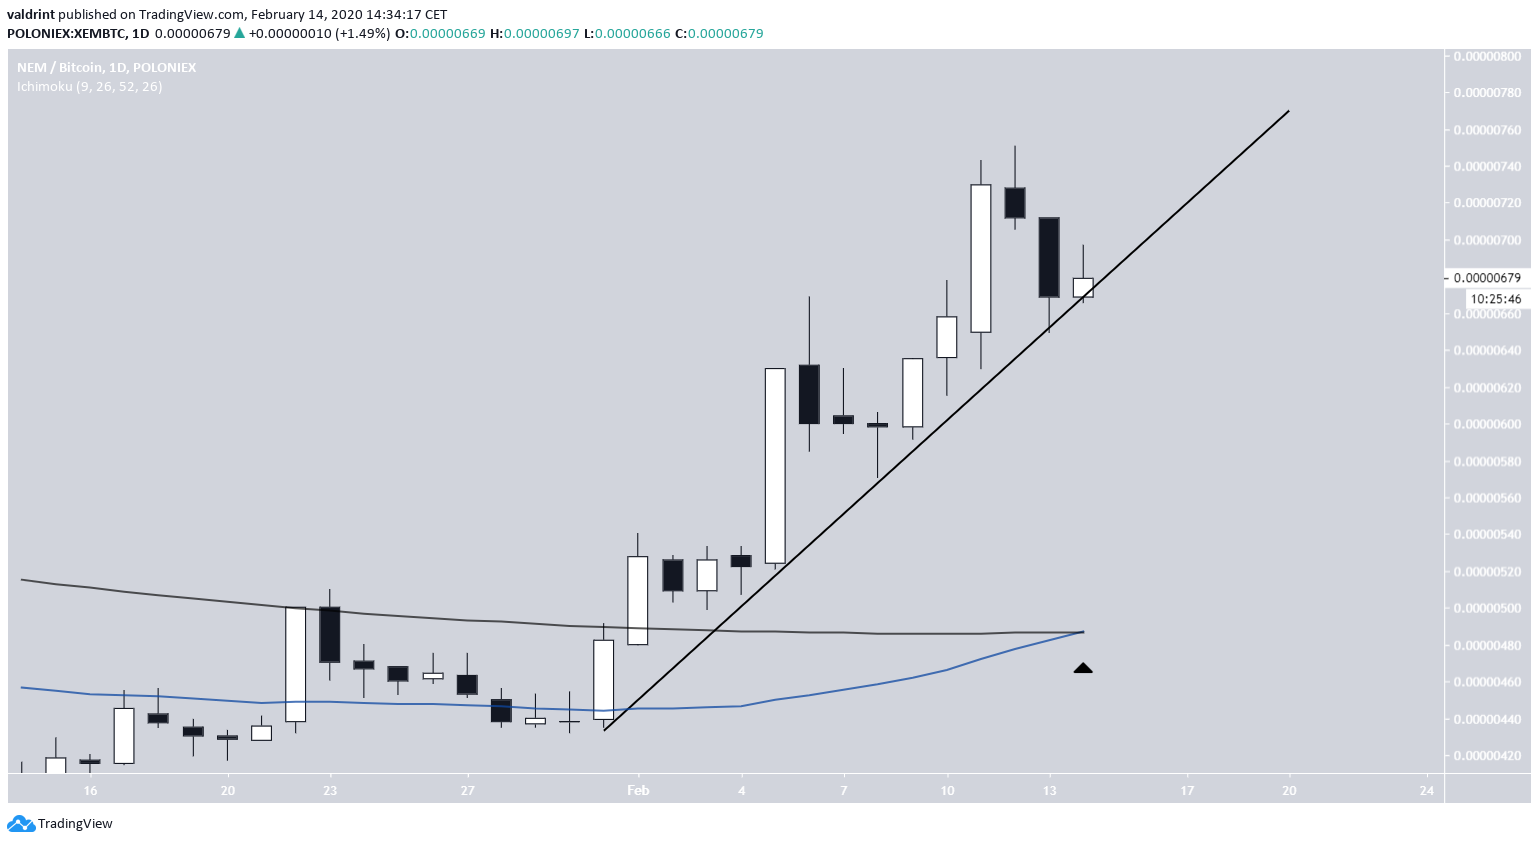
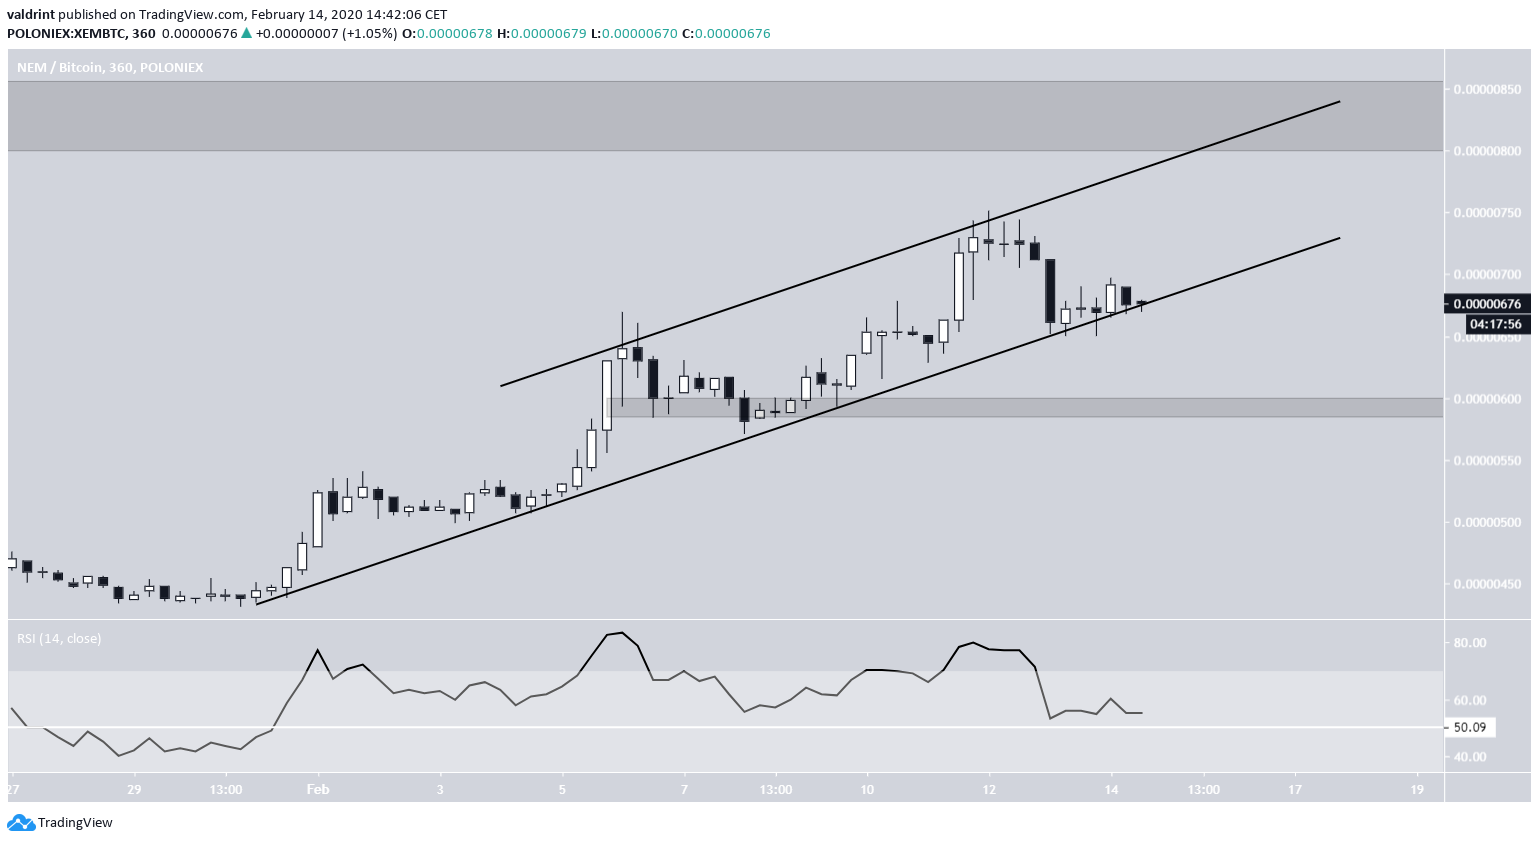
Short-Term XEM Movement
The six-hour chart shows the ascending support line more clearly, and a possibly-developing resistance line — which combines to create an ascending channel.
If the XEM price continues to increase at the rate predicted by the channel, it should reach the 800 satoshi resistance area by February 17.
On the contrary, in case of a breakdown, the closest support area is found at 600 satoshis. We do not believe this is likely, both because of the long-term outlook and the short-term RSI bounce at the 50-line.
To conclude, the XEM price broke out on January 31 and began an upward trend. We believe the increase will continue until the price reaches at least one of the resistance areas outlined above.
