


The Near Protocol (NEAR) price analysis presents a complex picture, indicating varied market sentiments.
A mix of indicators paints a nuanced view of NEAR’s short-term trajectory.
Shifting On-Chain Momentum
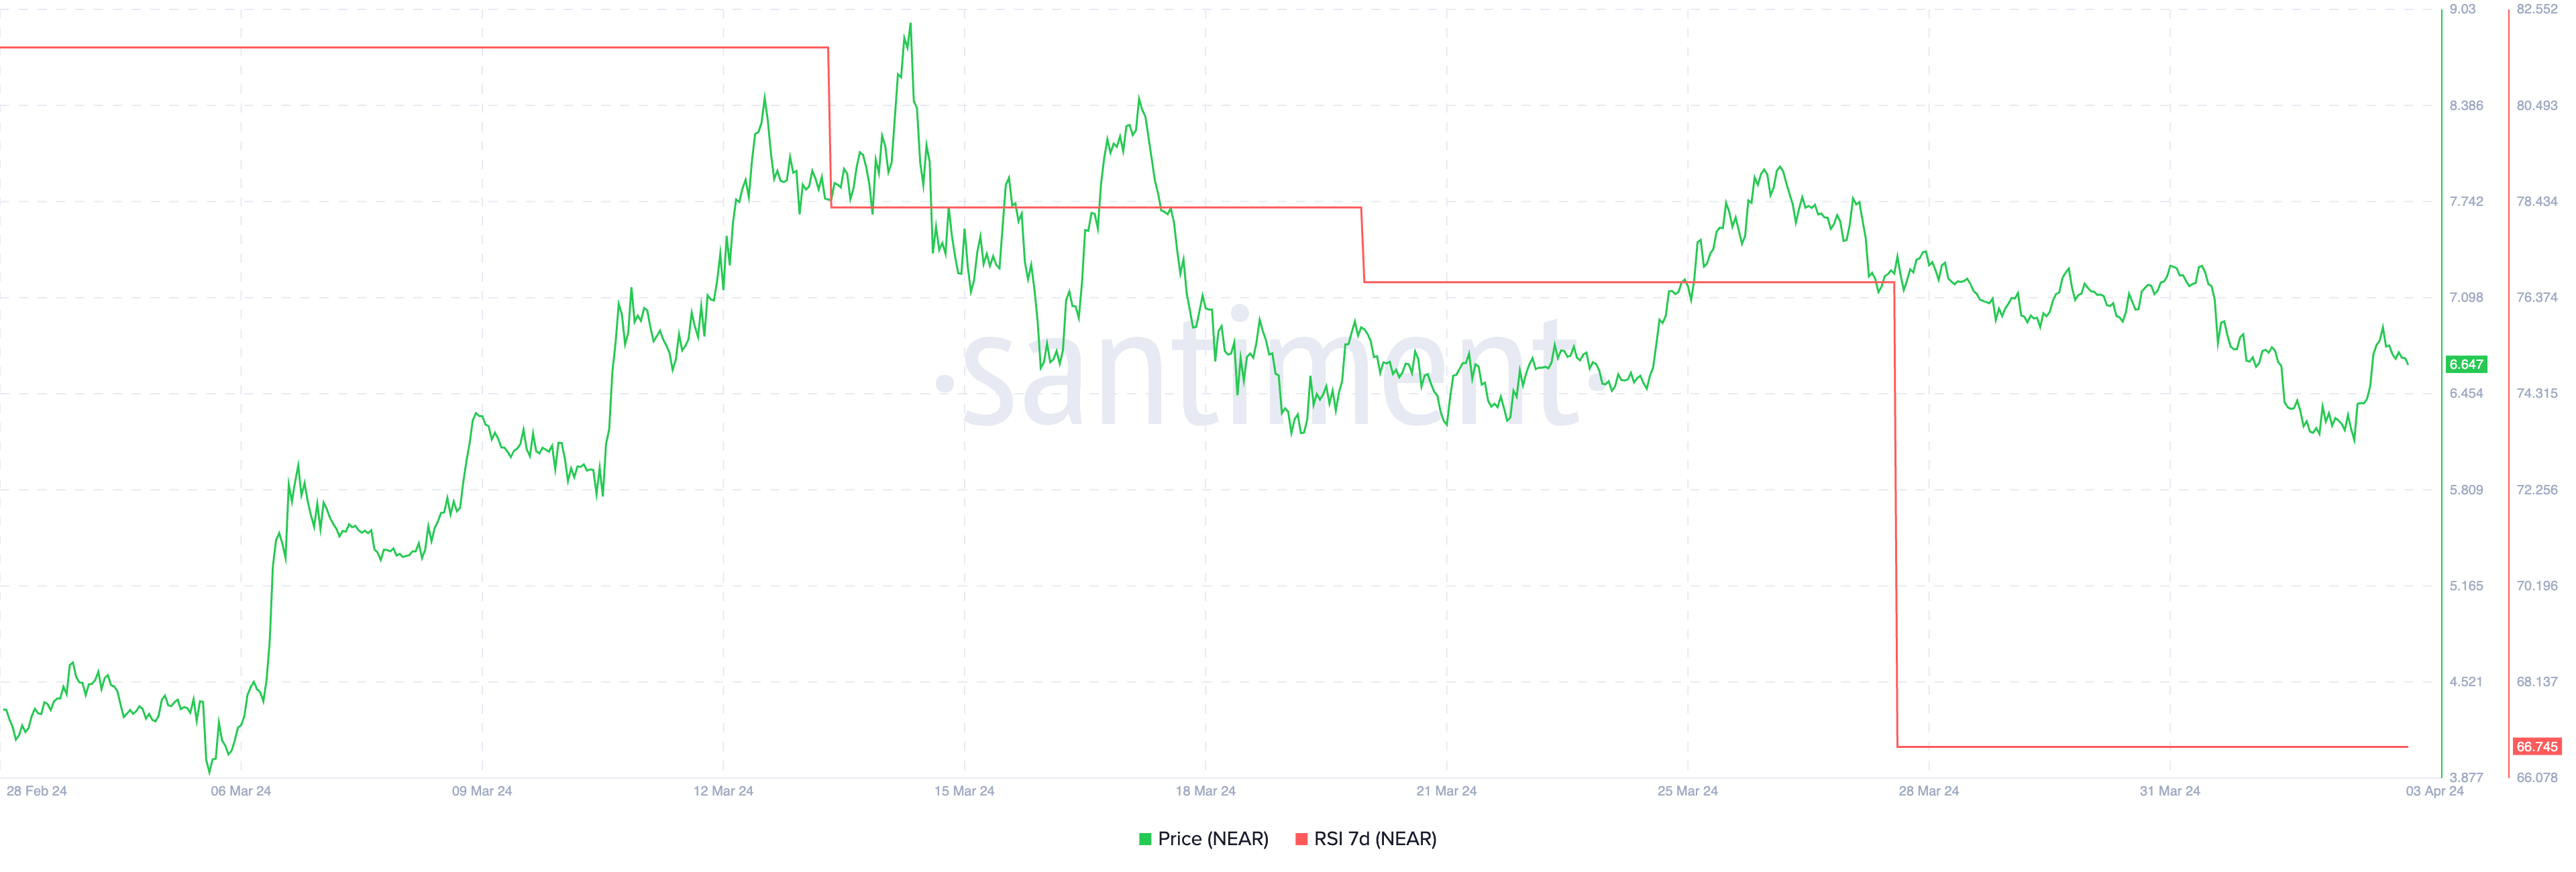
NEAR Protocol‘s market dynamics have taken a turn, as evidenced by the RSI falling to 66 from a previous 76 on March 27, marking its first dip below 70 since November 23. The RSI, which helps identify overbought or oversold conditions, suggests a weakening in buying pressure as it retreats from previously sustained high levels.
Although the current RSI value does not indicate an oversold condition, the noticeable decrease in momentum could signal a forthcoming period of consolidation for NEAR, highlighting a shift in market dynamics.
On the other hand, NEAR’s daily transaction count has rebounded, reaching a peak of 9.02 million on April 2—the highest since December 2023. This recovery follows a period from March 12 to 20, where transaction activity and price showed little variation, indicating a phase of stability.
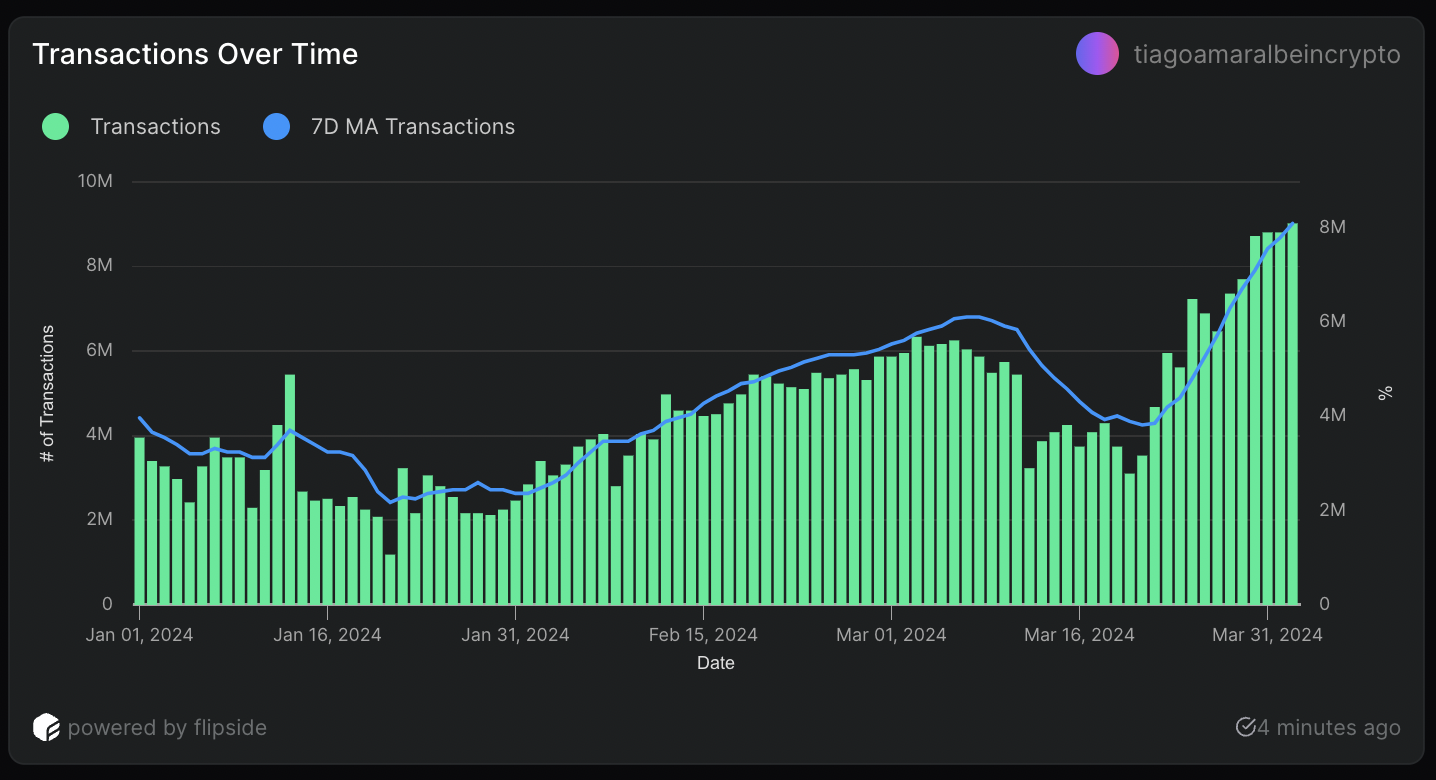
The resurgence in network activity, coupled with a modest increase in NEAR’s price from $5.96 to $6.44, suggests a potential alignment of price with transaction volume, possibly signaling the onset of a bullish trend, albeit the tempered by RSI indicator.
NEAR Price Prediction: Consolidation
NEAR’s price chart reveals a death cross within the Exponential Moving Average (EMA) lines, a bearish signal typically indicating a shift from bullish to bearish sentiment. This pattern, characterized by a short-term EMA crossing below a longer-term line, suggests recent price declines may overshadow previous gains, hinting at the beginning of a downtrend.
Yet, the close proximity of NEAR’s EMA lines, alongside the contrasting increase in transaction volumes and a dipping RSI, suggests a complex market sentiment leaning towards consolidation, supported by strong nearby support and resistance levels.
Should NEAR’s price initiate an upward trajectory, overcoming immediate pressures, it could aim for the $8.0 mark.
Read More: Near Protocol (NEAR) Price Prediction for 2024
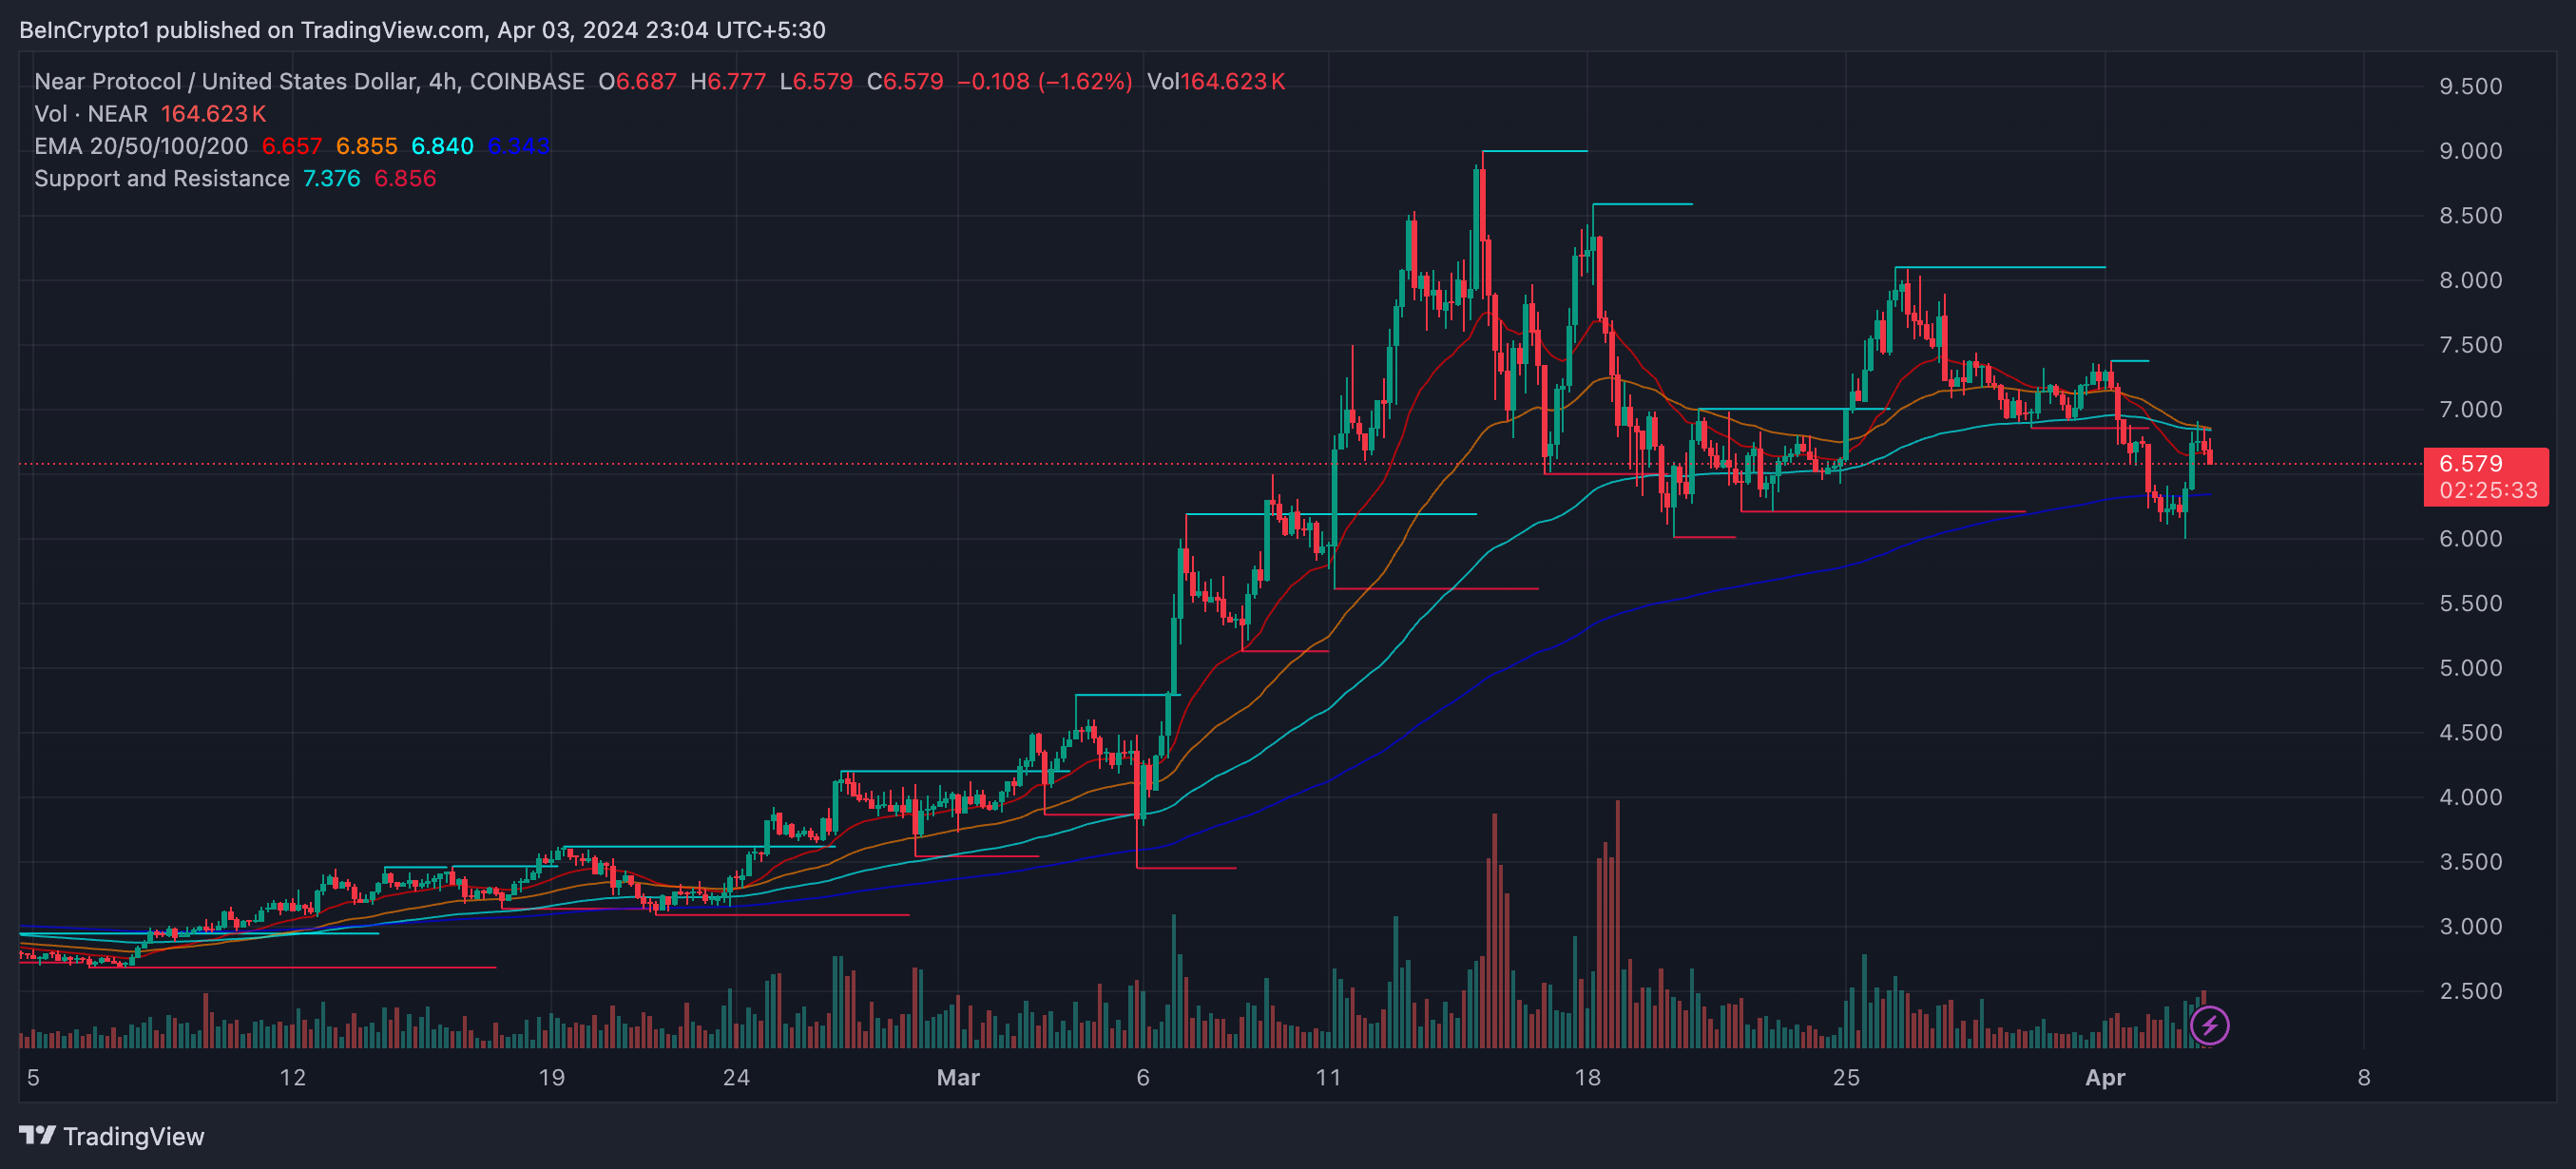
Conversely, a breakdown below the $6.2 support level could see the price retract to as low as $5.6, indicating a delicate balance between potential gains and losses in the near term.


