Near Protocol (NEAR) has increased by 25% so far on Dec 23 and is approaching its all-time high price of $17.50.
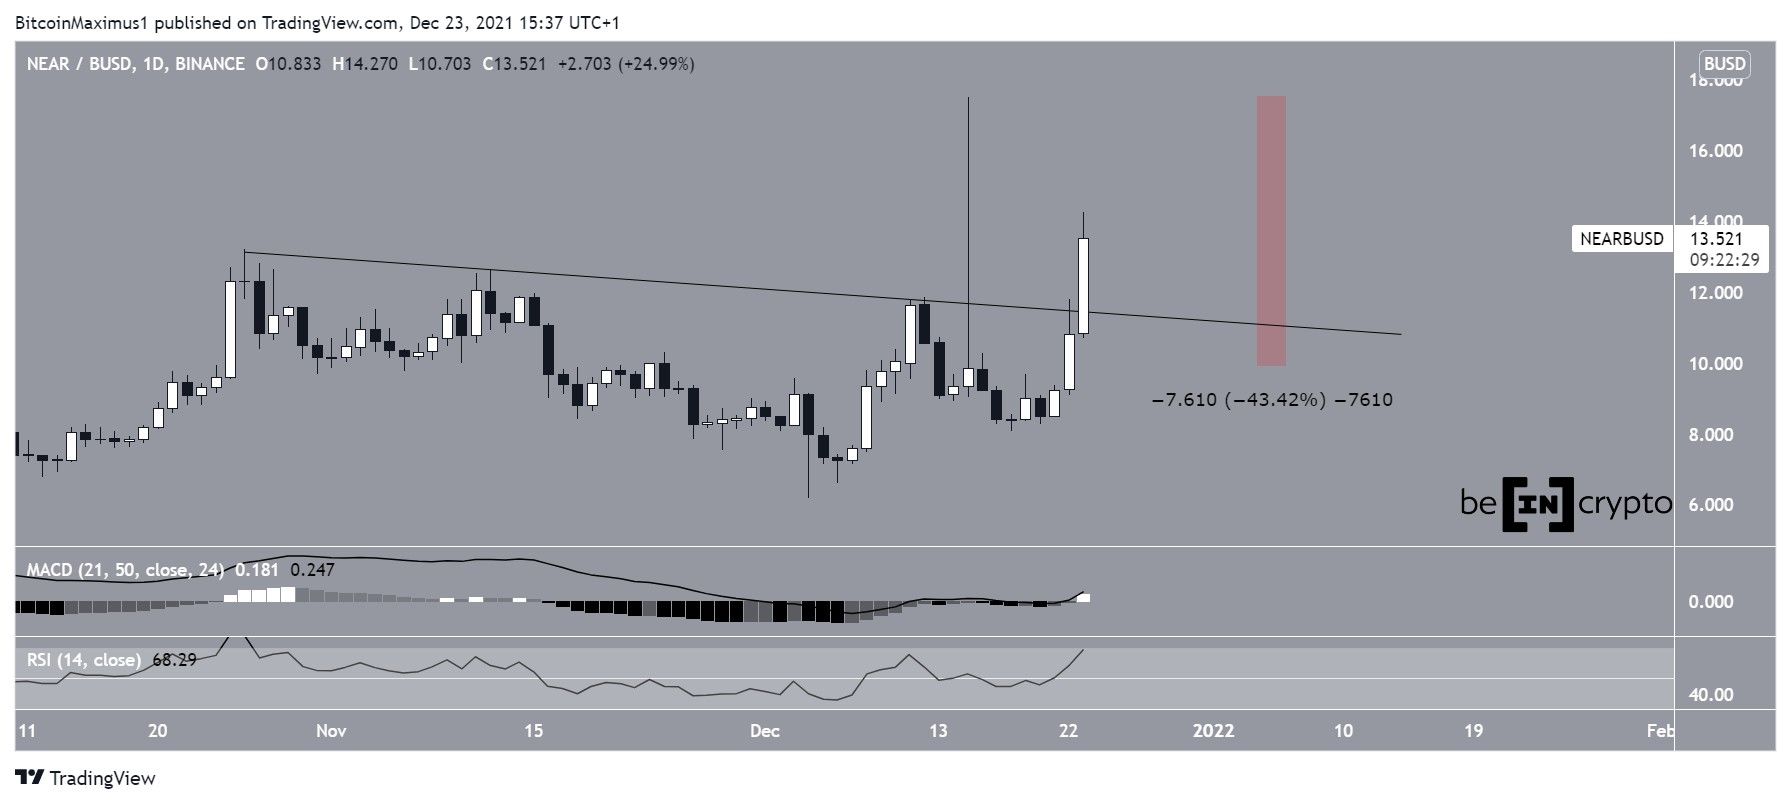
On Dec 15, NEAR reached a new all-time high price of $17.50. However, it dropped sharply the same day, creating a long upper wick of 43.5%.
Despite the drop, the token regained its footing shortly afterwards and initiated another upward movement on Dec 21. Two days later, it broke out from a descending resistance line, which had been in place since the previous all-time high. This confirmed that the correction had ended.
Technical indicators are also bullish.
The MACD, which is created by a short and a long-term moving average (MA), has moved into positive territory for the first time in Dec. This means that the short-term MA is faster than the long-term one, and further confirms that the trend is bullish.
In addition to this, the RSI has moved above 50, another sign of a bullish trend.
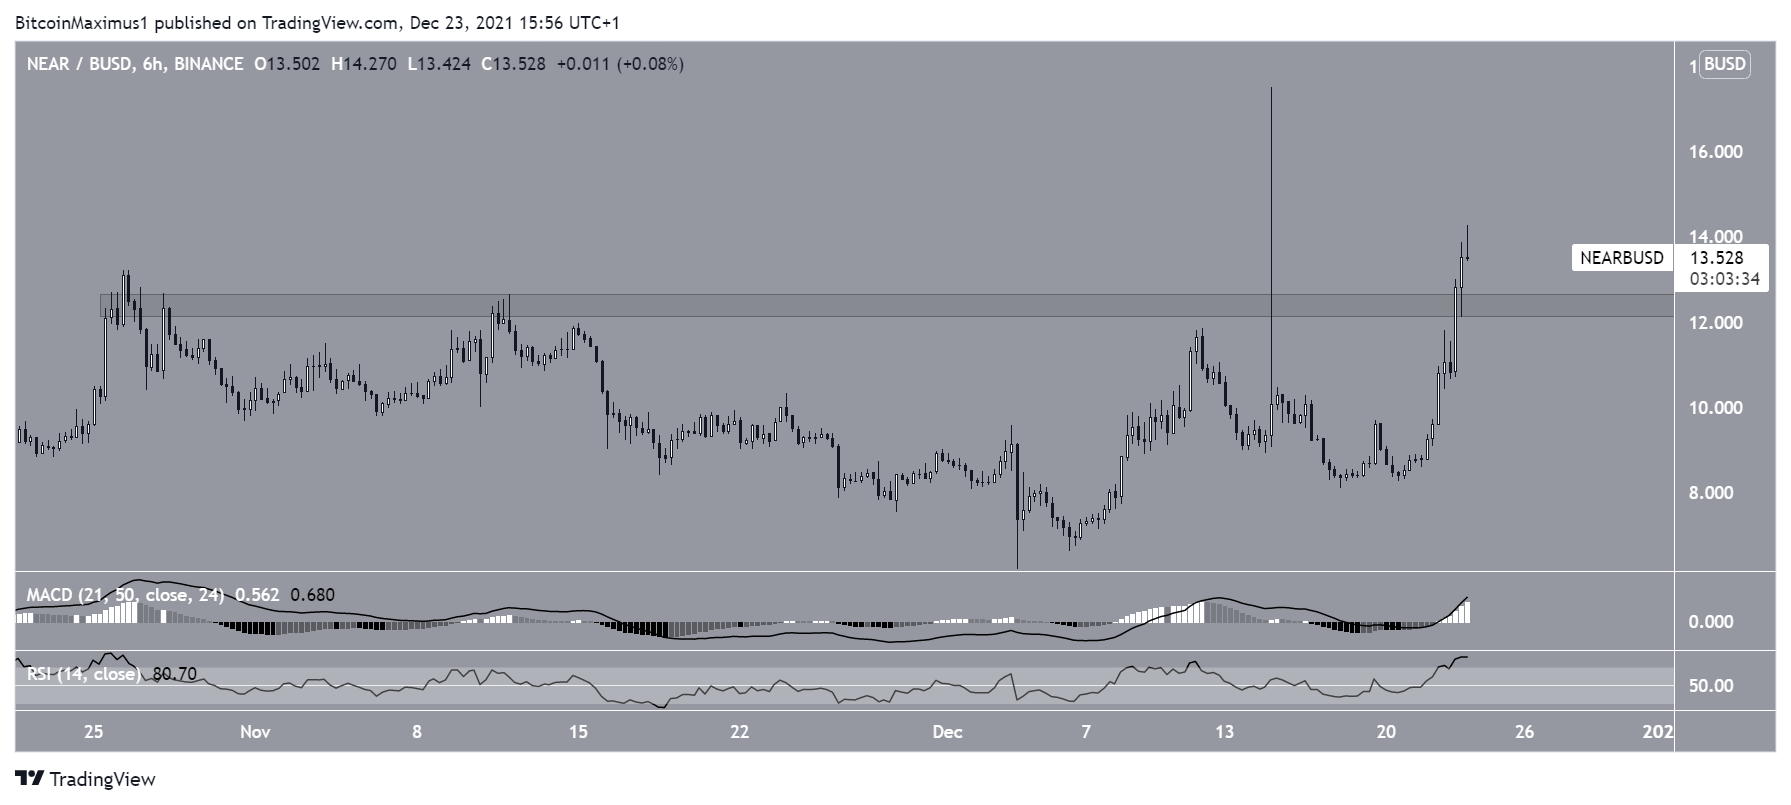
Short-term movement
The six-hour chart shows that NEAR has broken out from the $12.40 horizontal resistance area.
If a short-term drop were to occur, this area would now be expected to act as support.
Similarly to the daily time-frame, both the RSI and MACD are moving upwards, supporting the continuation of the upward movement.
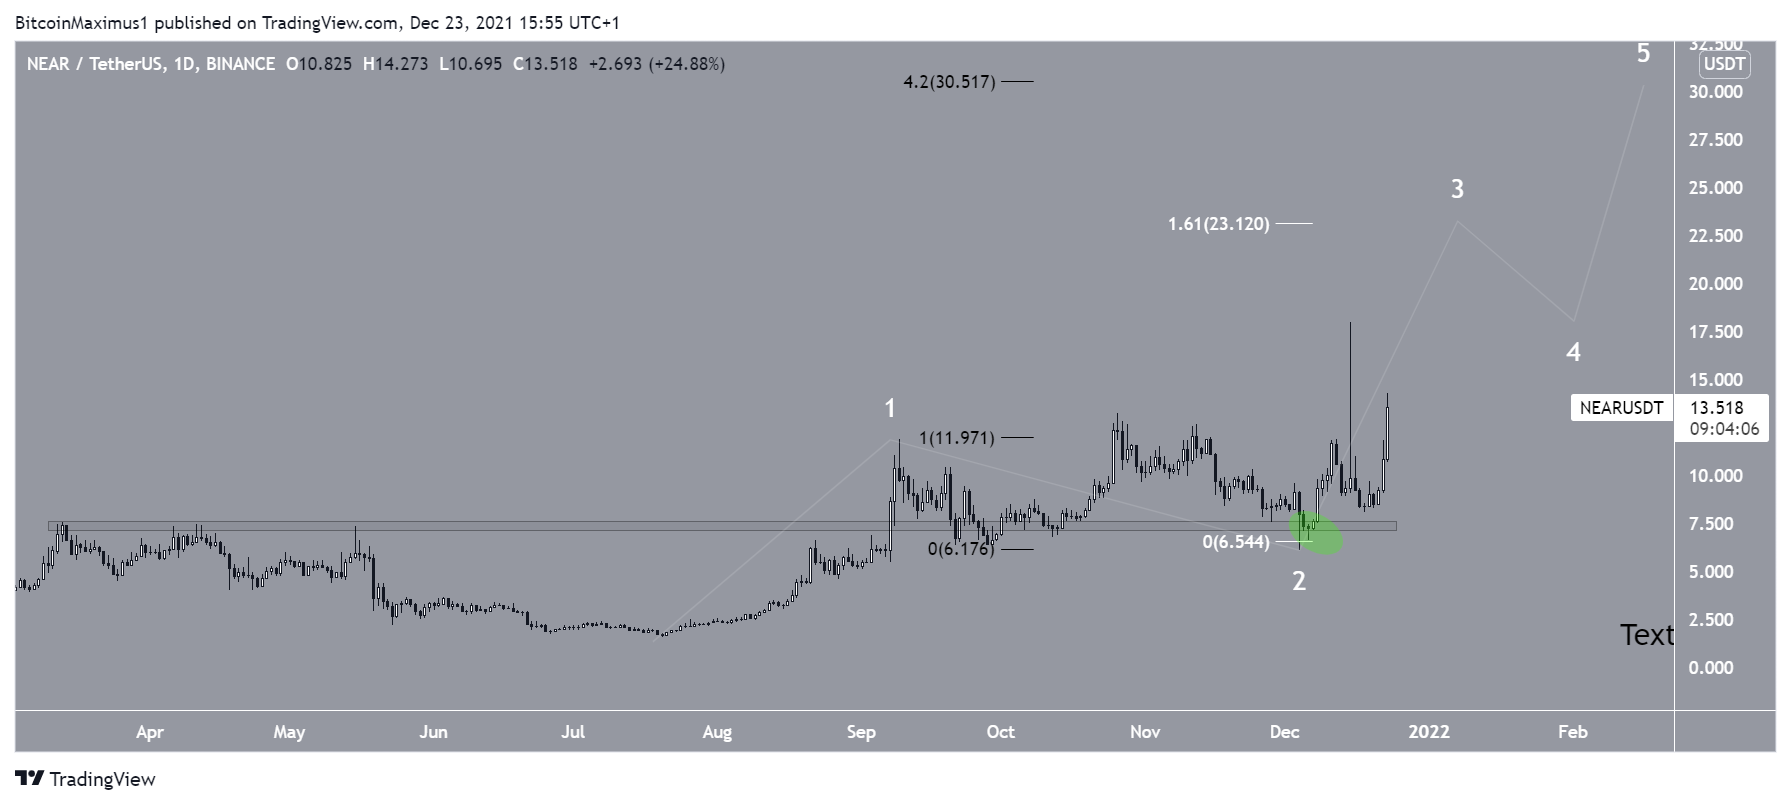
NEAR wave count
Cryptocurrency trader @KRMA_0 tweeted a NEAR chart, stating that the token could soon go ballistic.
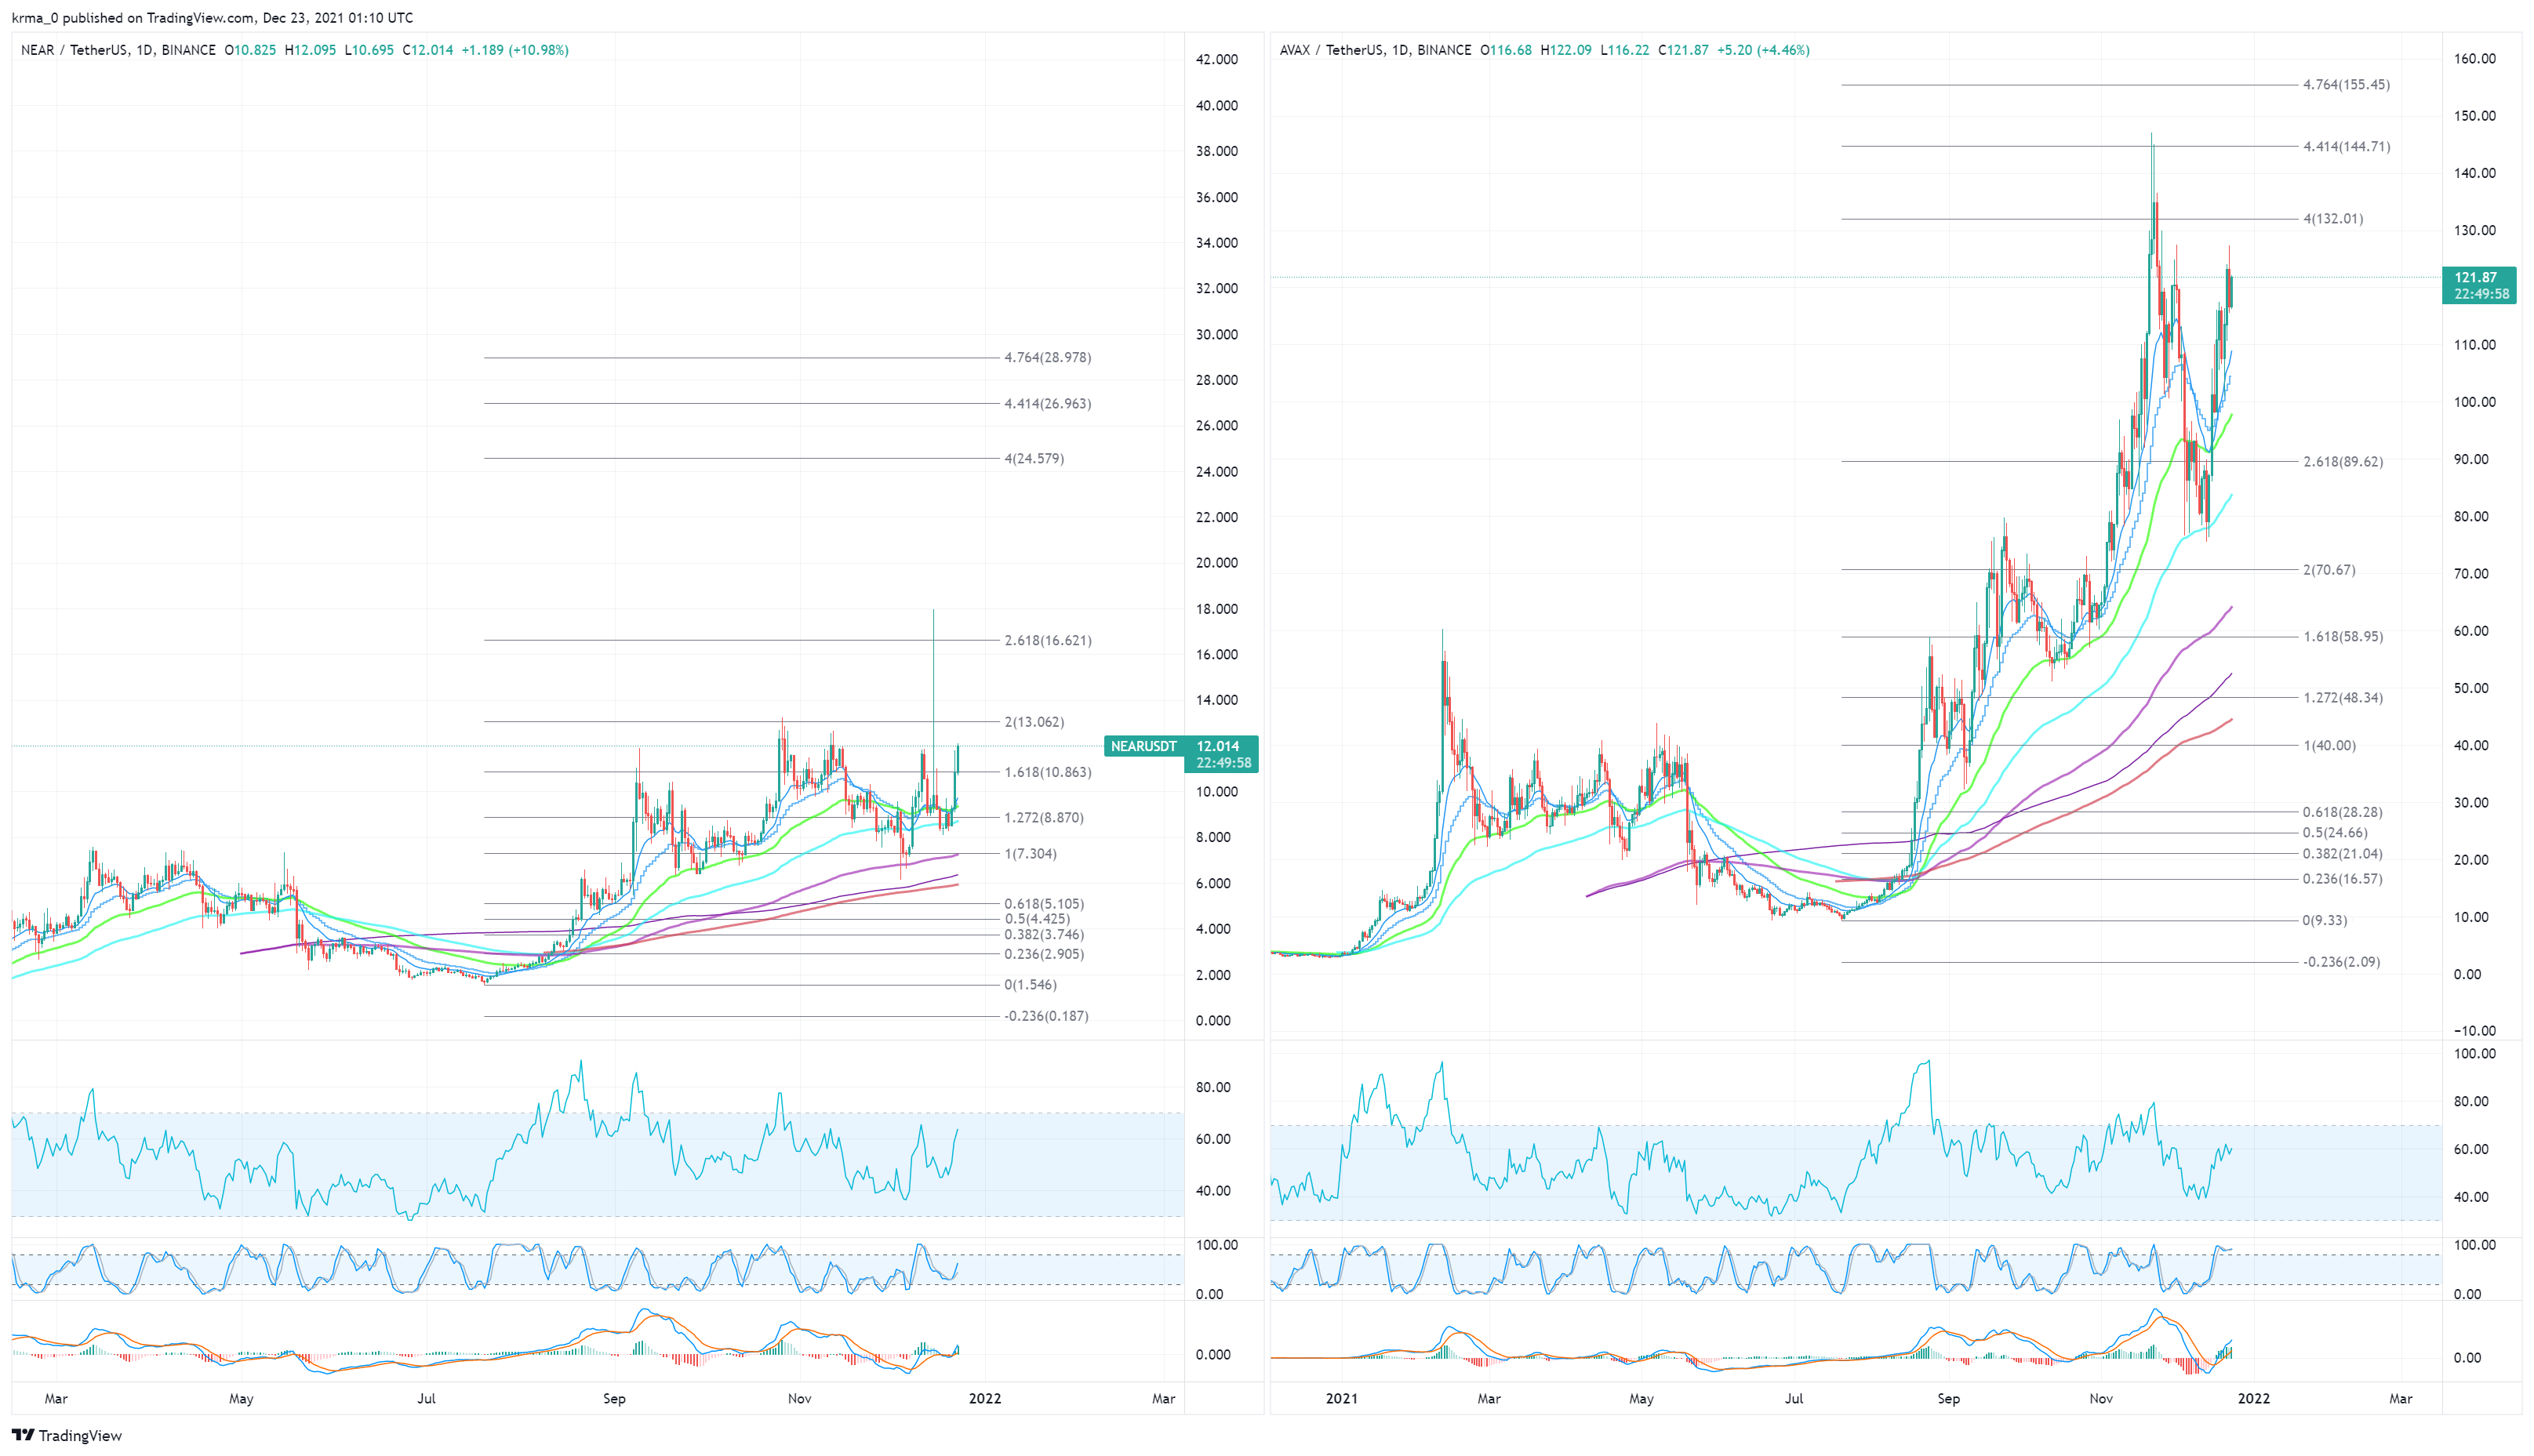
The wave count indicates that NEAR is in wave three of a bullish impulse.
The deviation and reclaim of the $7 horizontal area (green circle) suggests that the token completed wave two, which is corrective.
The first potential target for the top of wave three is at $23.1. The target is found by giving waves 1:3 a 1:1.61 ratio (white)
Afterwards, a potential target for the top of the entire movement would be at 30.5, created by the 4.2 external Fib retracement (black) of the most recent drop.