

Near Protocol (NEAR) began to move upwards on July 18 after a 35-day period in which the daily RSI generated bullish divergence.
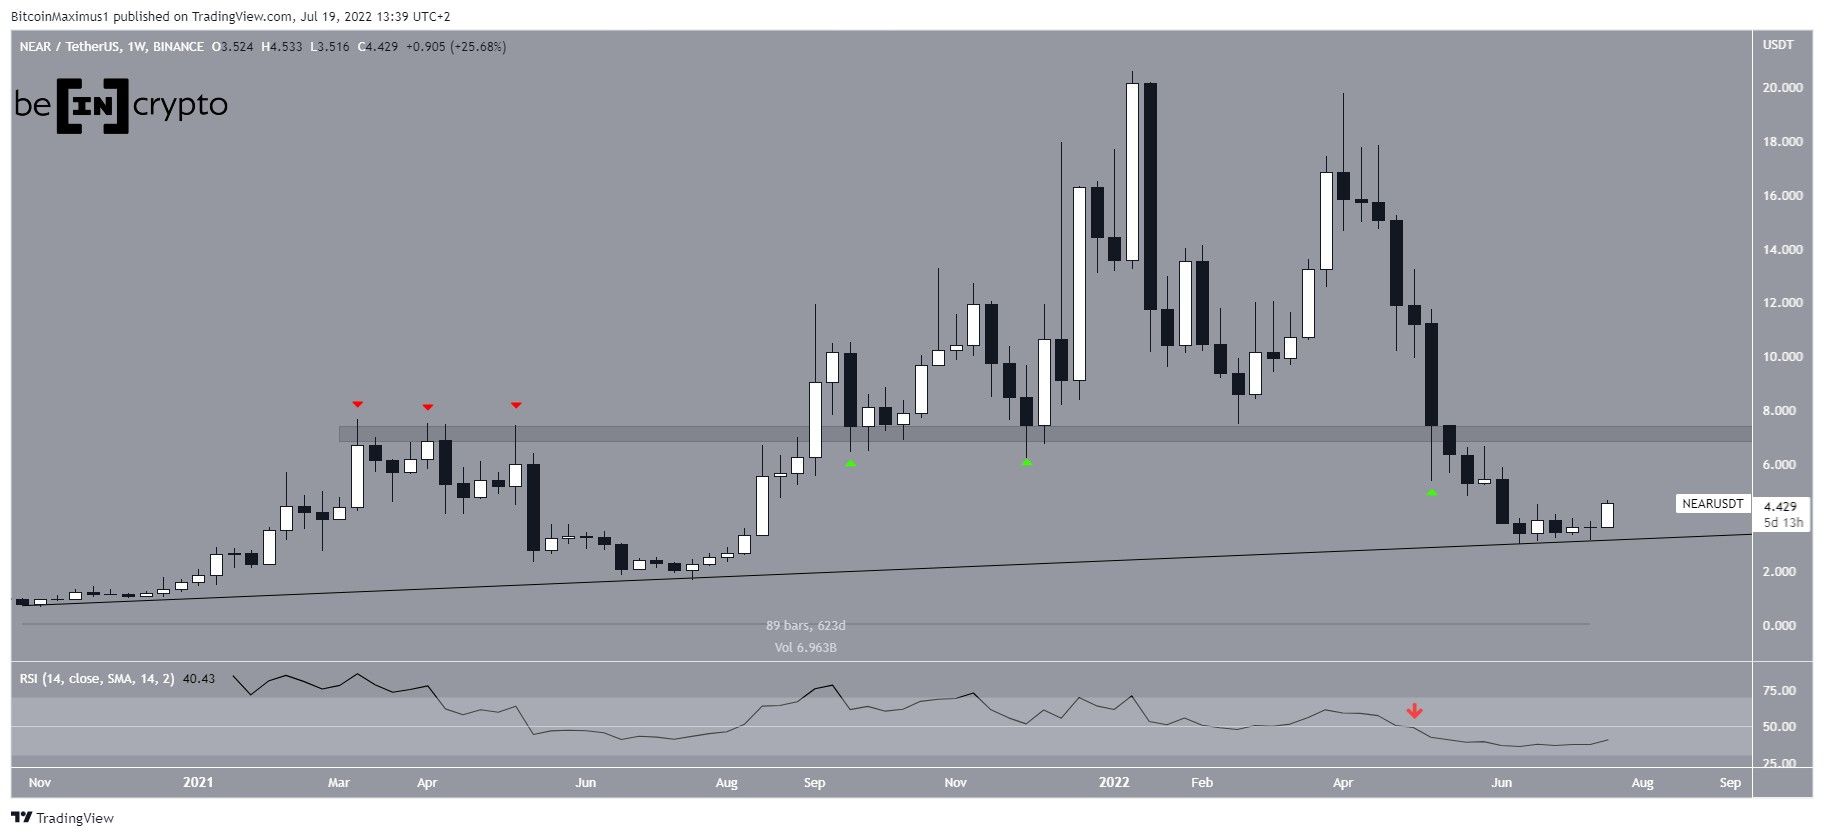
NEAR has been falling since reaching an all-time high price of $20.59 in Jan. 2022. It accelerated its rate of decrease after creating a lower high in April of the same year. So far, the downward movement has of $2.87.
The price bounced afterward, validating a long-term ascending support line that has been in place since Nov. 2020. This is a very long-term structure that has so far served to measure the rate of increase perfectly.
If the upward movement continues, the closest resistance area would be at $7. This is a horizontal area that has intermittently acted as both support and resistance (green and red icons) since March 2020. As a result, until this area is reclaimed, the long-term trend cannot be considered bullish.
Finally, the weekly RSI is below 50 (red icon), a sign that is associated with bearish trends.
NEAR breaks out
Unlike the weekly chart, the daily one provides a more bullish outlook. The price has already broken out from a descending resistance line and seems to be in the process of initiating an upward movement. If it does, the closest resistance area would be at $9.30, created by the 0.382 Fib retracement resistance level.
The entire upward movement was preceded by a very considerable bullish divergence in the daily RSI (green line), which had been developing since June 12. Such divergences often precede bullish trend reversals.
Additionally, the RSI has now moved above 50. The previous time the daily RSI moved above 50, an upward movement of 106% followed. A similar movement would take NEAR to the $9.30 resistance area.

Short-term pattern
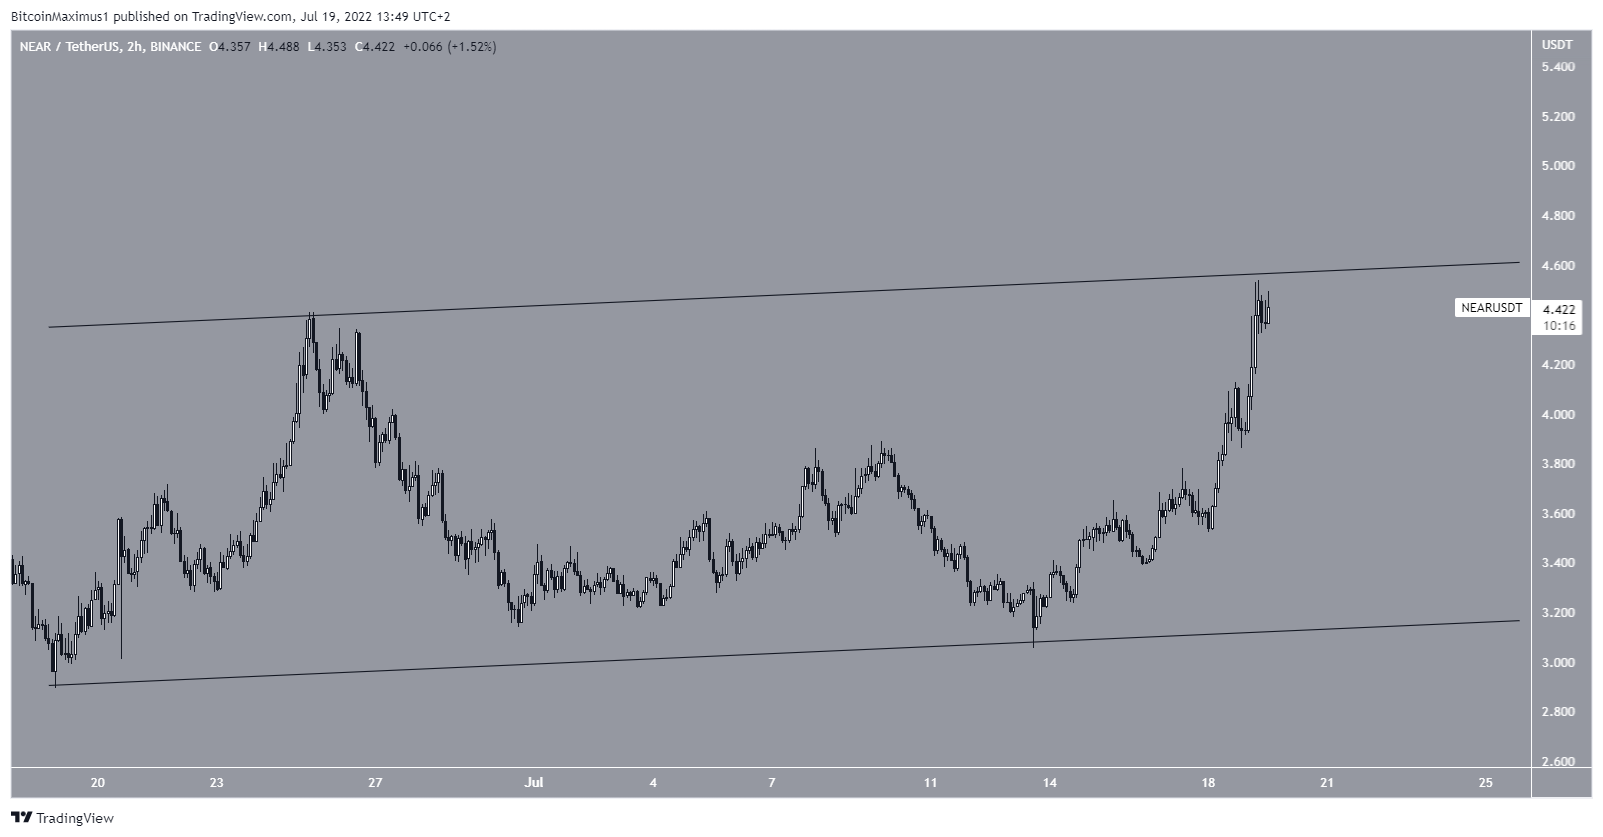
The two-hour chart shows that since the June bottom, the price has been trading inside an ascending parallel channel. Currently, it is very close to the resistance line of the channel.
Parallel channels usually contain corrective movements. So, a breakout from this short-term channel would be required to confirm that NEAR has initiated a bullish trend reversal and will continue increasing towards the previously outlined resistance area.
For Be[in]Crypto’s latest bitcoin (BTC) analysis, click here
Disclaimer
In line with the Trust Project guidelines, this price analysis article is for informational purposes only and should not be considered financial or investment advice. BeInCrypto is committed to accurate, unbiased reporting, but market conditions are subject to change without notice. Always conduct your own research and consult with a professional before making any financial decisions. Please note that our Terms and Conditions, Privacy Policy, and Disclaimers have been updated.
