
The Nano (NANO) price broke out from a long-term resistance line on Nov. 24. The price was rejected shortly afterwards and has been decreasing since.
Despite the sharp drop, the price already found support and is expected to soon create a higher low and begin moving towards the resistance levels outlined in the article.
Long-Term Breakout
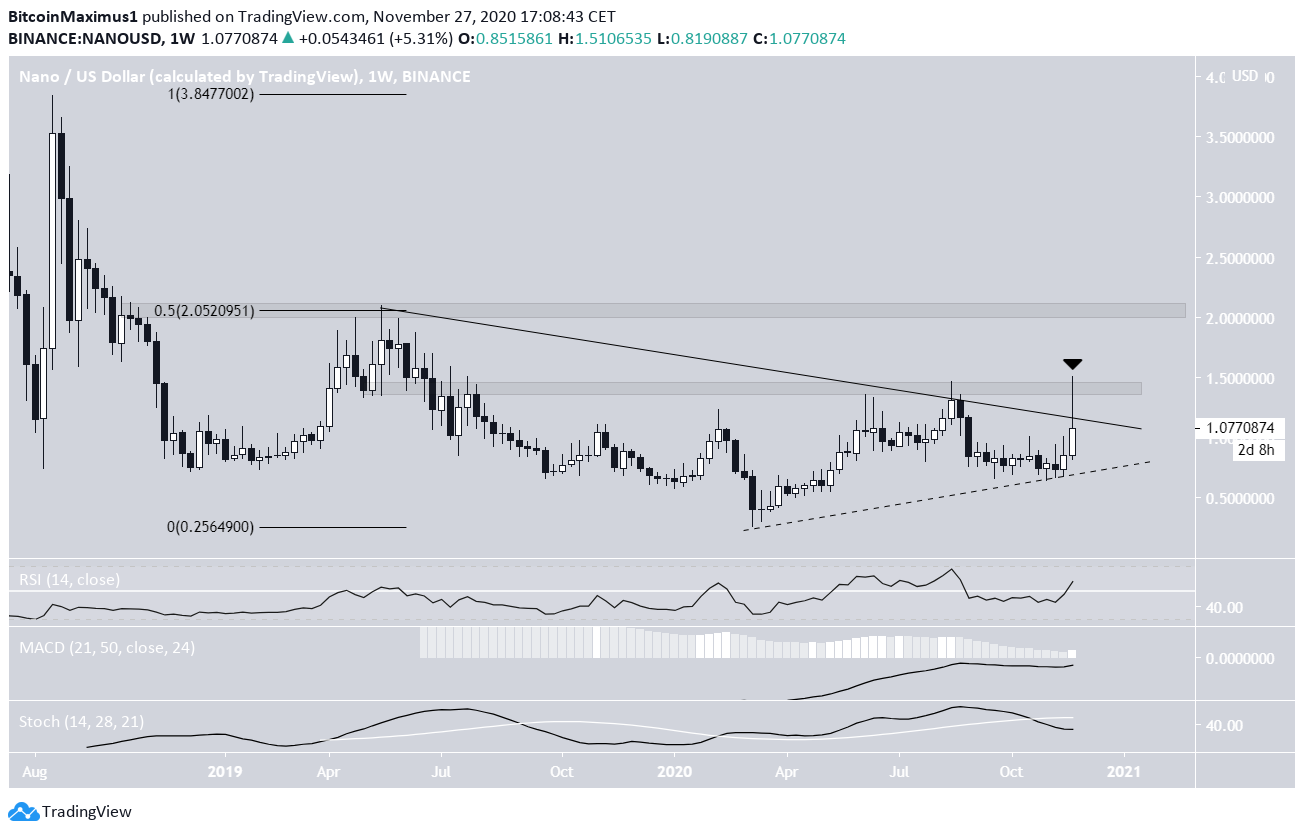
The NANO price followed a descending resistance line from May 2019 until recently. On Nov 21 the price began an upward move and broke out above this line three days later, reaching a high of $1.51.
However, the price was rejected at the $1.45 resistance area. A long upper wick appeared and the price fell back below the descending resistance line. It is possible that NANO now follows an ascending support line (dashed), which in turn would create a symmetrical triangle pattern. However, the line has not been validated a sufficient number of times.
Technical indicators are ambiguous, and fail to give a clear indication of the trend. While the MACD & RSI are increasing, the Stochastic Oscillator has made a bearish cross.
If the price breaks out, the next resistance area would be found at $2.05, the top of the descending resistance line and 0.5 Fib retracement level of the most recent decrease.
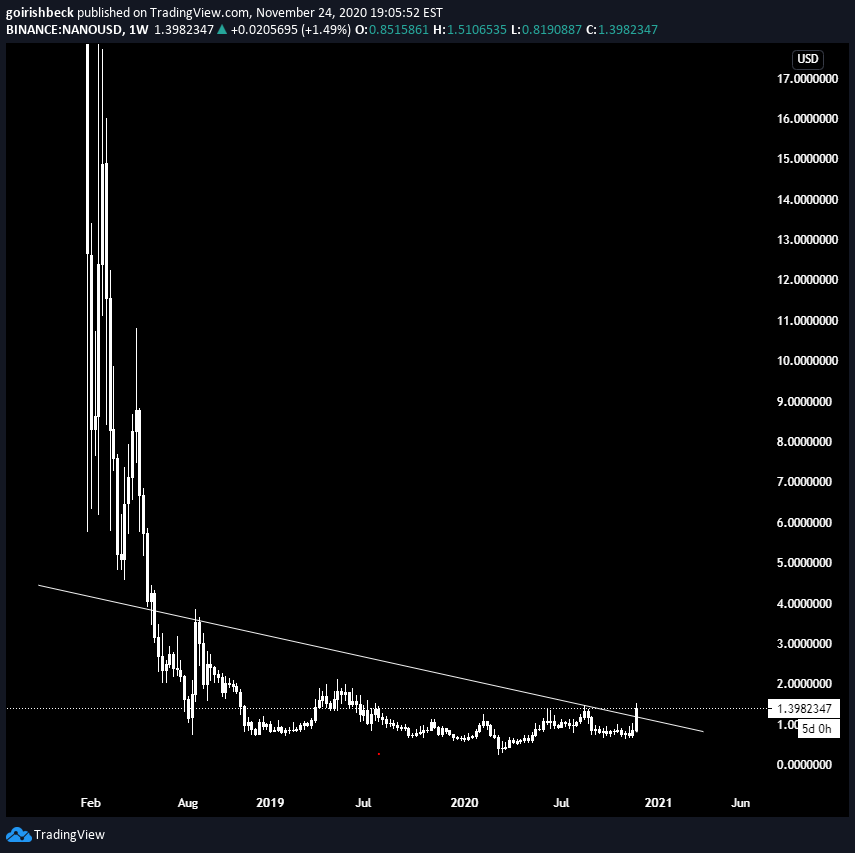
Cryptocurrency trader @GolrishBeck tweeted a NANO chart, which shows that the price has broken out from a long-term descending resistance line. While that was true in the beginning of the week, the decrease that transpired on Nov 26 put the breakout in doubt by creating the aforementioned long upper wick.
Re-Test Of The Breakout Level
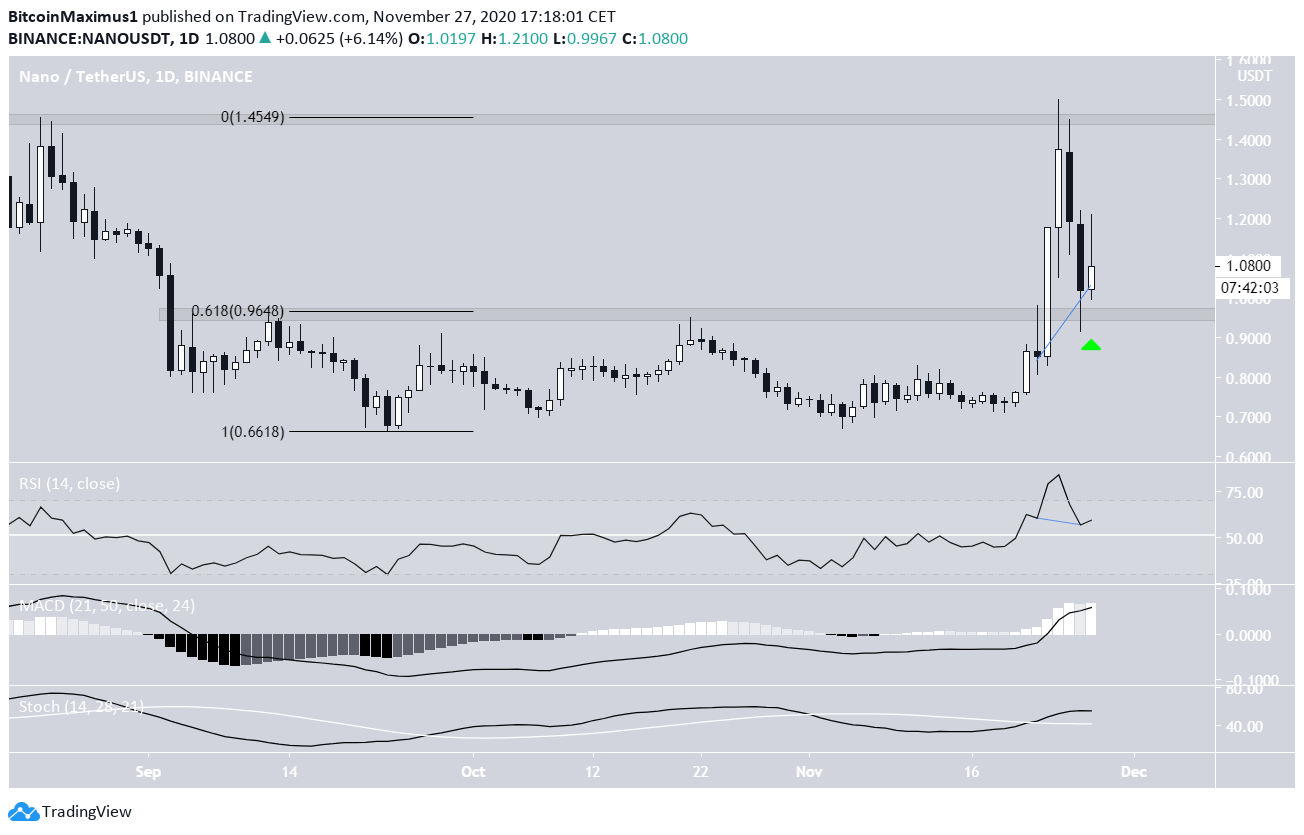
The daily time-frame shows that despite the drop, the price has returned and validated the breakout level at $0.96 as support by creating a long lower wick. The level is also the 0.618 Fib retracement of the entire upward move, increasing its significance.
Furthermore, technical indicators are bullish, and the daily RSI has generated hidden bullish divergence. This suggests that the price will move upwards and possibly make another attempt at breaking out.
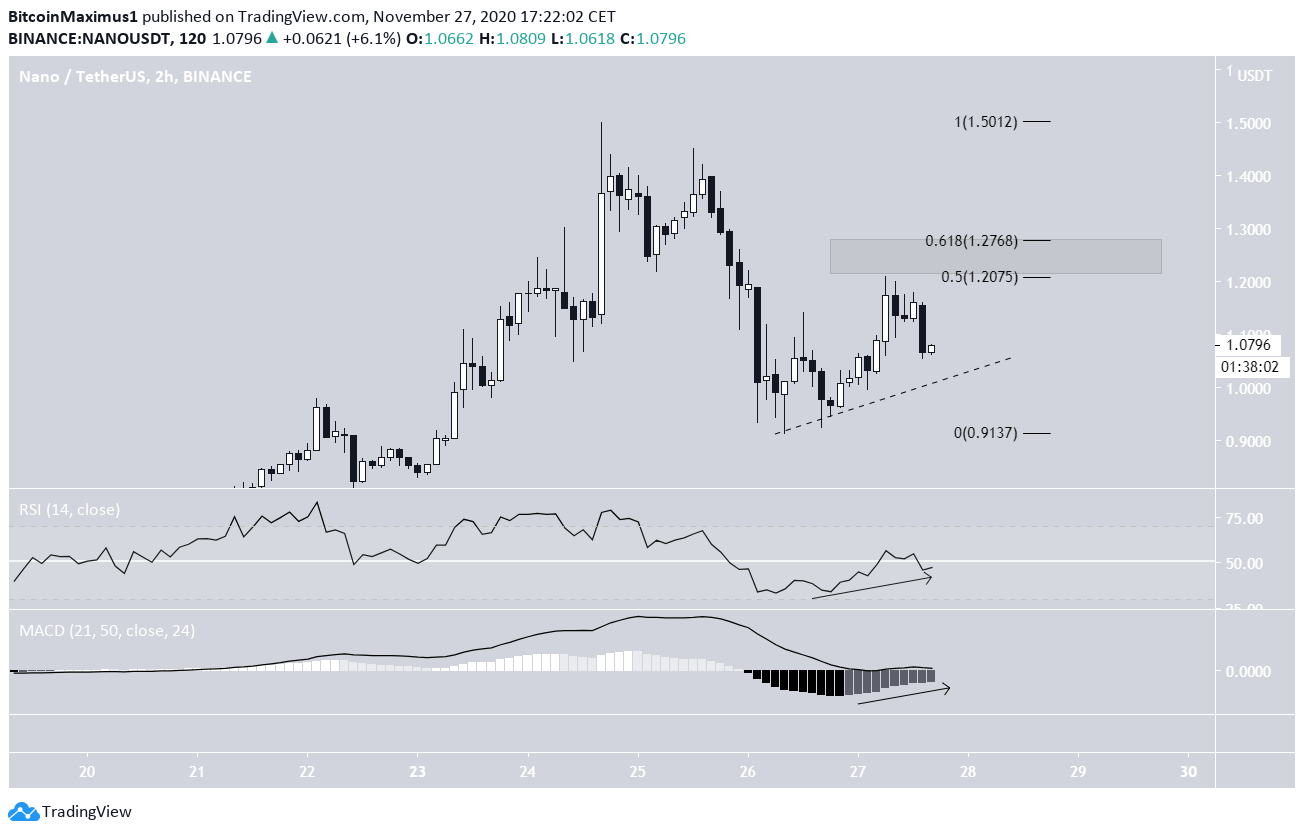
The shorter-term chart shows that the price already made an attempt at moving upwards but was rejected by the 0.5 Fib retracement level and has decreased.
In order for the trend to be considered bullish, NANO has to clear the 0.5-0.618 Fib resistance between $1.20-$1.26, or create a higher low and some type of bullish structure.
Short-term indicators support this possibility since both the RSI & MACD are increasing.
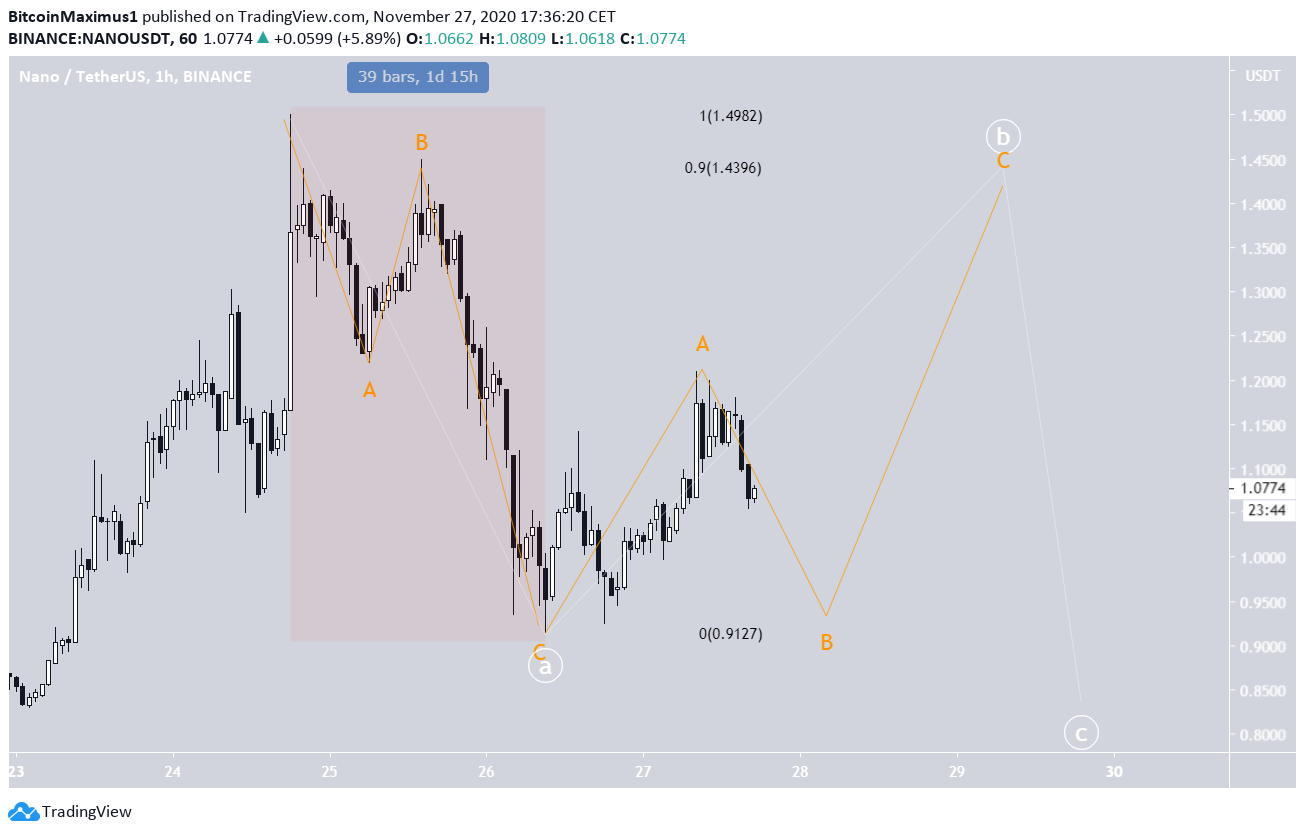
Wave Count
Since the aforementioned Nov 24 high, the price seems to have completed an A-B-C downward structure (orange). The move transpired in three waves instead of five, so the NANO price has not begun a new bearish impulse (period highlighted in red).
Therefore, what will follow now is either a new bullish impulse or a corrective B wave (white). At the time of writing, there is not enough information to determine which will occur.
However, since the decrease transpired in three waves, the ensuing move would be expected to reach the 0.9 Fib level of the decrease even if it is not the beginning of a new impulse. This would take the NANO price back towards $1.45.
Until the structure starts to develop, we cannot determine if it is a new bullish impulse.
Conclusion
To conclude, if it has not already done so, the NANO price is expected to soon reach a bottom. Then, it will begin to move upwards towards the $1.45 resistance area and possibly higher.
For BeInCrypto’s latest Bitcoin analysis, click here!
Disclaimer: Cryptocurrency trading carries a high level of risk and may not be suitable for all investors. The views expressed in this article do not reflect those of BeInCrypto
