


The NANO (NANO) price has broken out from a short-term descending resistance line, indicating the beginning of a new upward trend.
Both the NANO/USD and NANO/BTC pairs are expected to continue moving upwards toward their next closest resistance areas.
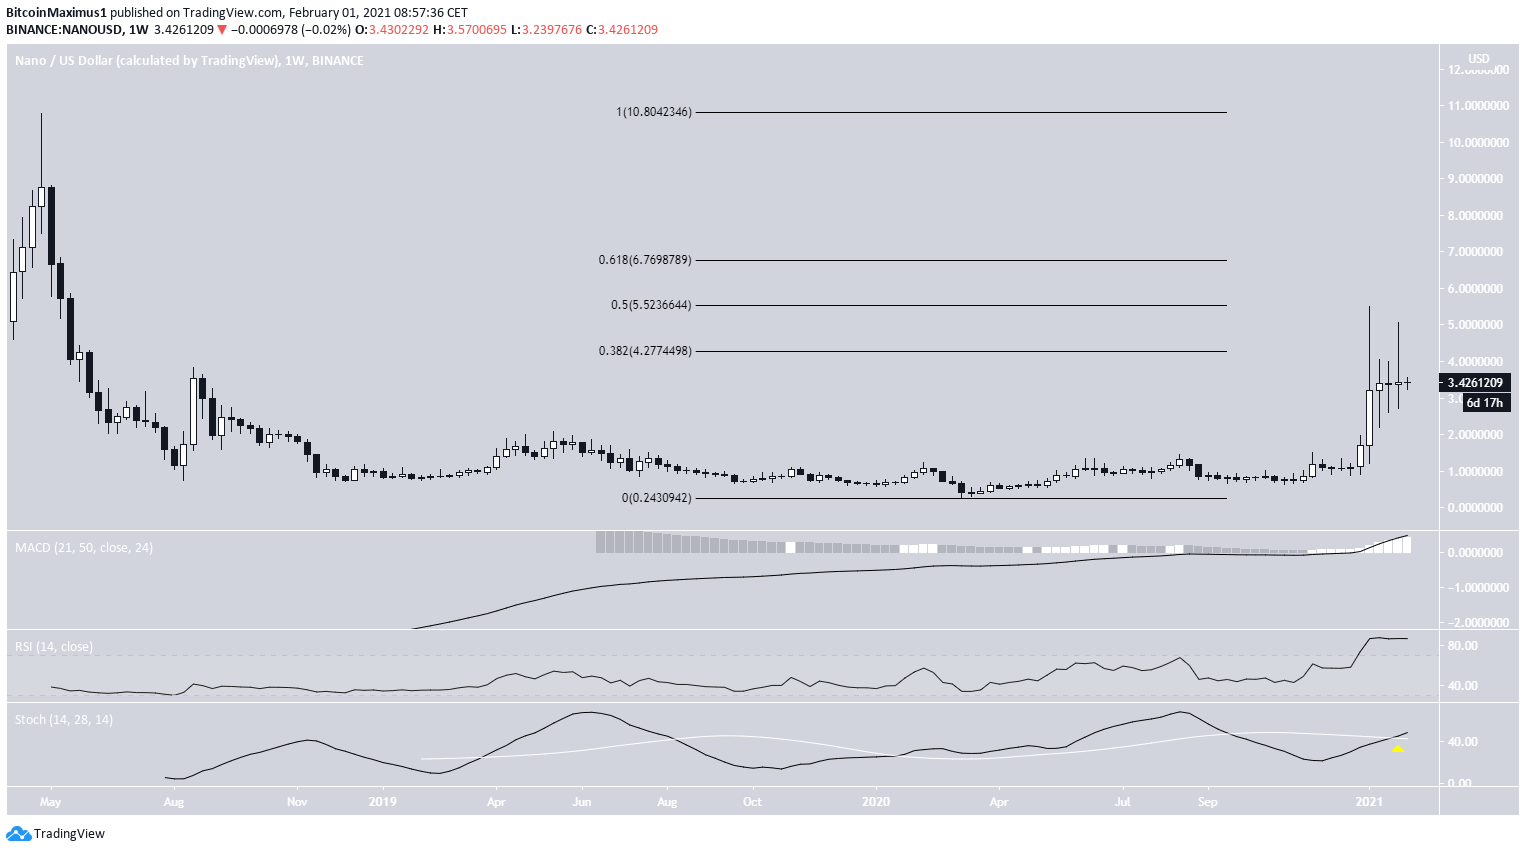
NANO Long-Term Levels
Despite a significant upward movement that lead to a high of $5.49 on Jan. 7, 2021, NANO has since fallen back below the 0.382 Fib retracement level resistance at $4.27. Since the aforementioned high, NANO has created several long upper wicks.
Technical indicators are still bullish, however, as shown by the bullish cross in the Stochastic oscillator. These signals suggest that NANO will continue increasing.
If so, the next resistance areas would be found at $5.52 and $6.76, (0.5 and 0.618 Fib retracement levels respectively)
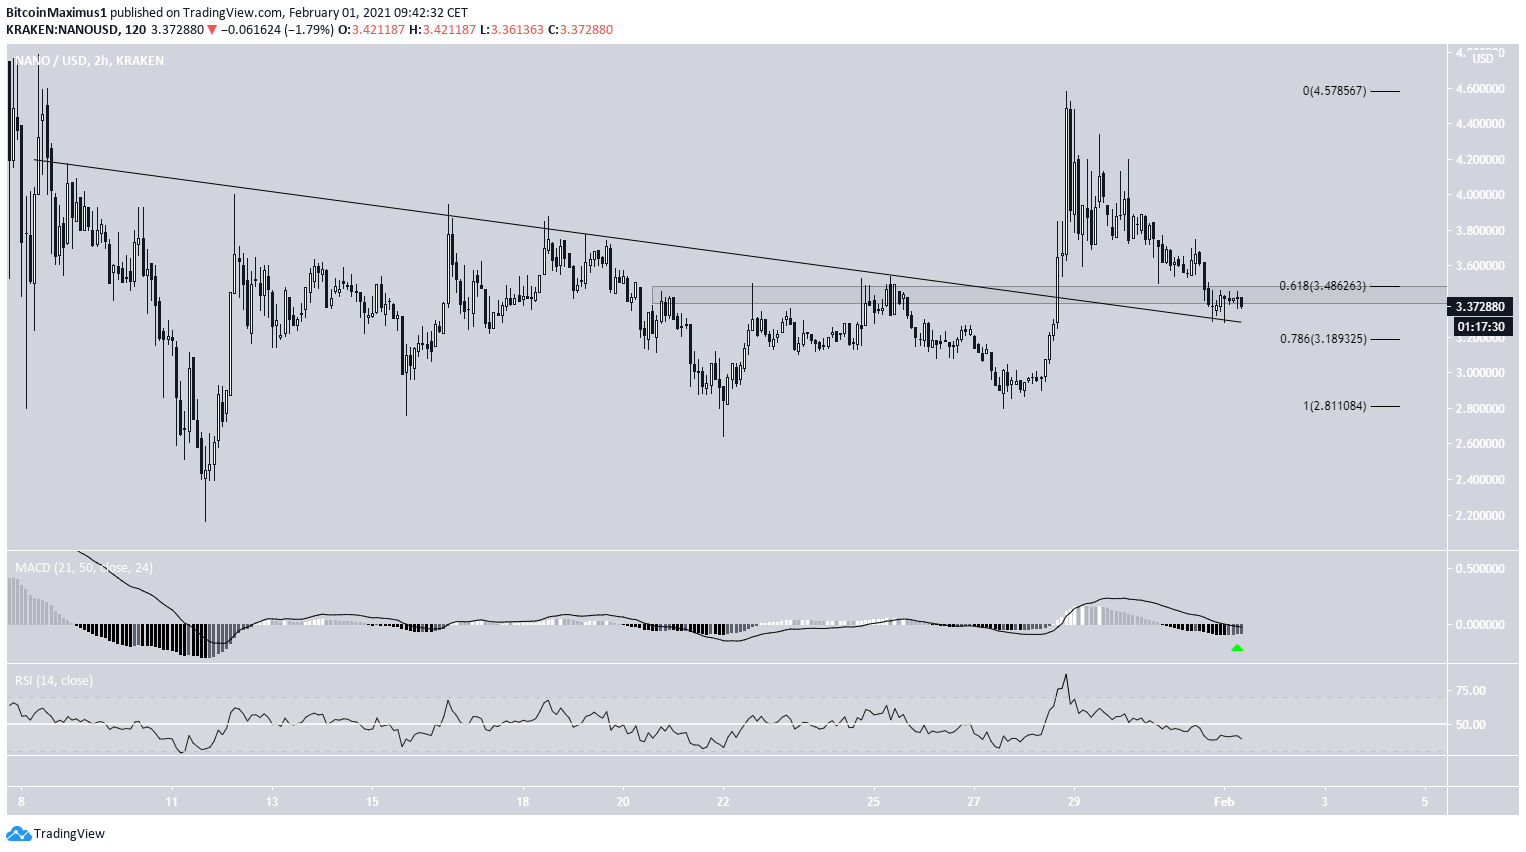
Future Movement
The two-hour chart shows that NANO has broken out from a descending resistance line and is currently in the process of validating it as support.
The resistance line now turned to support also coincides with the 0.618 Fib retracement level, making it likely to initiate a reversal.
Technical indicators are gradually turning bullish. If NANO were to reclaim this area, it would likely confirm that the trend is bullish and NANO is moving higher.
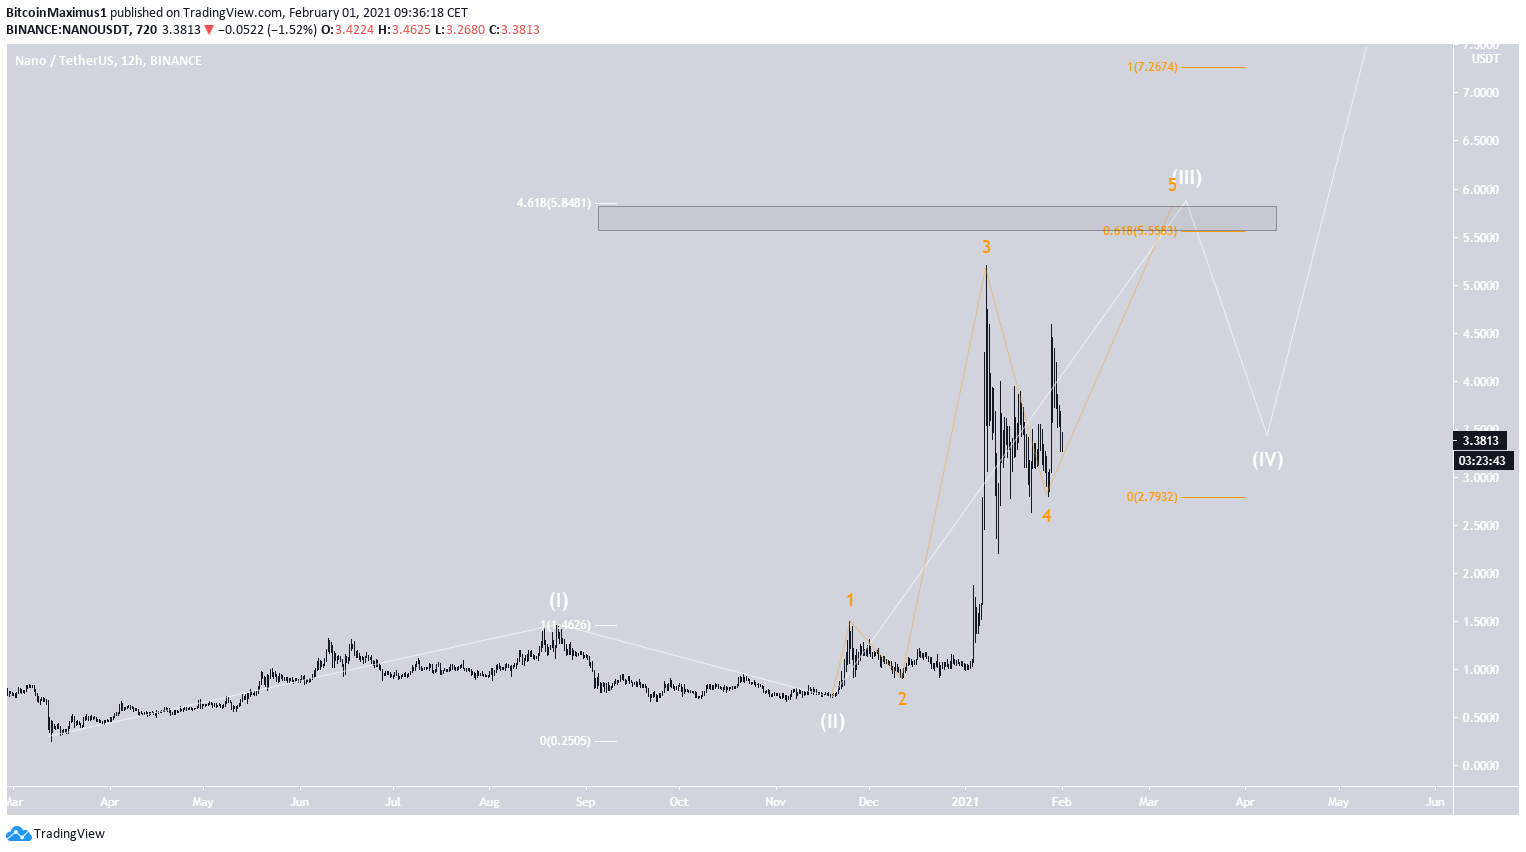
Wave Count
The wave count suggests that NANO is in an extended bullish wave three (shown in white below) which began with the March 2020 lows.
Currently, it seems that NANO has completed sub-wave four (orange) in what was a fourth wave triangle.
The most likely target for the top of sub-wave five, which would complete wave three, is found between $5.58-$5.84. These targets were found using Fib extensions and projections. The target also coincides with the 0.5 Fib retracement level outlined in the first section
A decrease below the sub-wave four low at $2.79 would invalidate this particular wave count.
NANO/BTC
Cryptocurrency trader @Apollo_river noted that an upward move to the most recent highs would amount to nearly a 50% return.
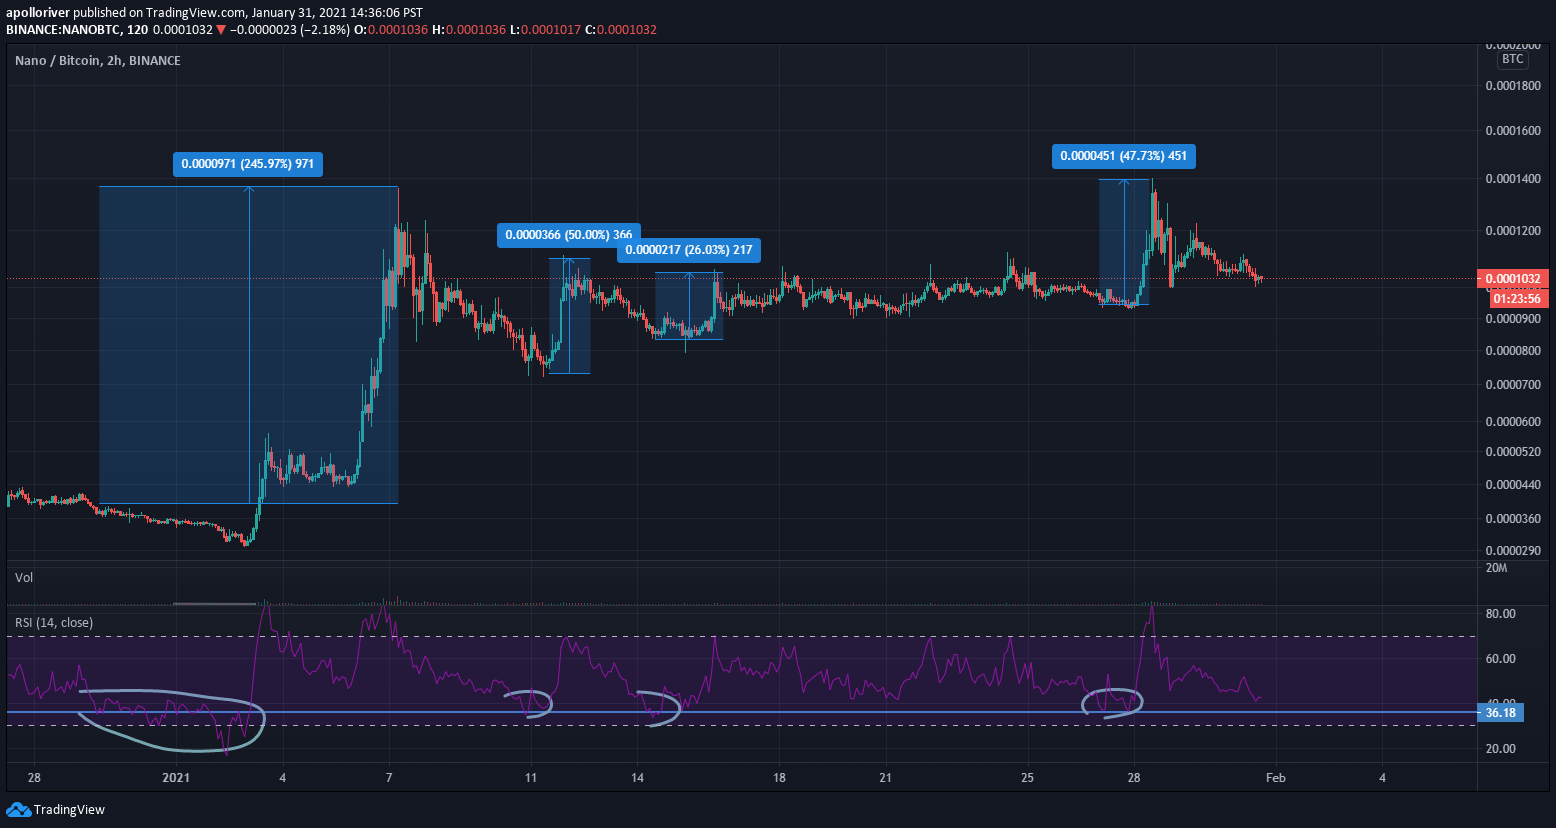
The weekly chart for NANO/BTC shows that despite the significant increase, NANO has been rejected by the 12,000 satoshi resistance area for the fourth time.
NANO has been trading below this resistance area since November of 2019.
Despite technical indicators being bullish, the long-term trend cannot be considered so until NANO manages to reclaim this level.
If successful, which seems likely due to the bullishness from indicators, the next resistance area would be found at 23,300 satoshis (0.618 Fib retracement level).
Conclusion
Both the NANO/USD and NANO/BTC pairs are expected to resume their upward movement and reach their next closest resistance areas. These levels are found at $5.55 and 23,300 satoshis respectively.
For BeInCrypto’s latest Bitcoin (BTC) analysis, click here


