


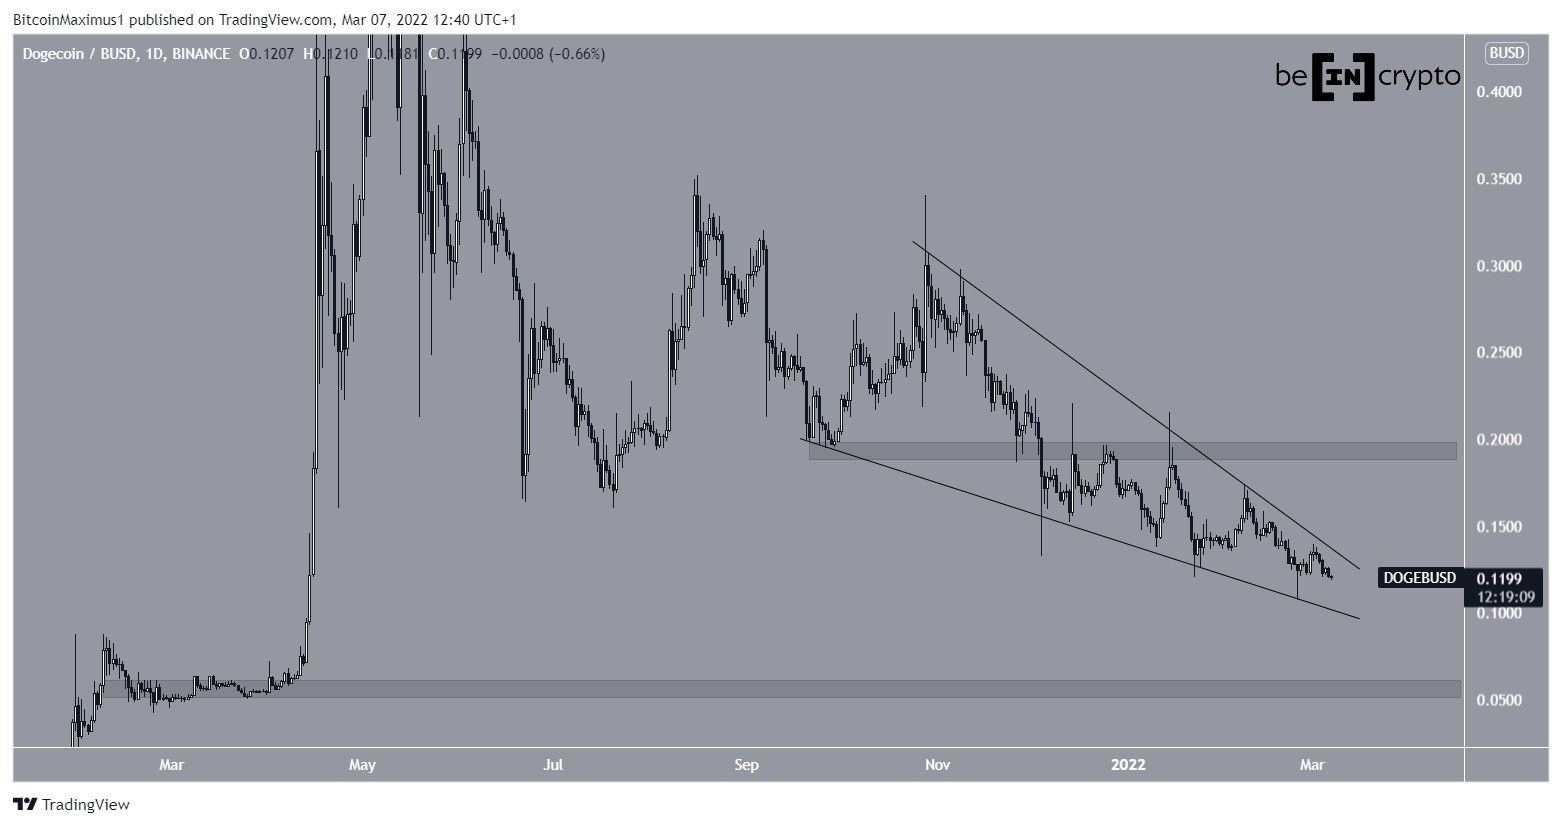
Dogecoin (DOGE) is trading inside a bullish pattern and is showing strong signs of a potential bullish reversal. However, the upward movement has not yet begun.
DOGE has been decreasing since Aug 16. More specifically, it has been falling inside a descending wedge since Oct 29. The wedge is considered a bullish pattern, meaning that a breakout from it would be the most likely scenario.
Currently, the price is approaching the point of convergence between support and resistance, at which point a decisive movement is expected.
If a breakout from the wedge occurs, the closest resistance area would be at $0.195. The level had previously acted as support but turned to resistance on Jan 2022.
Conversely, the closest support area is all the way down at $0.055.
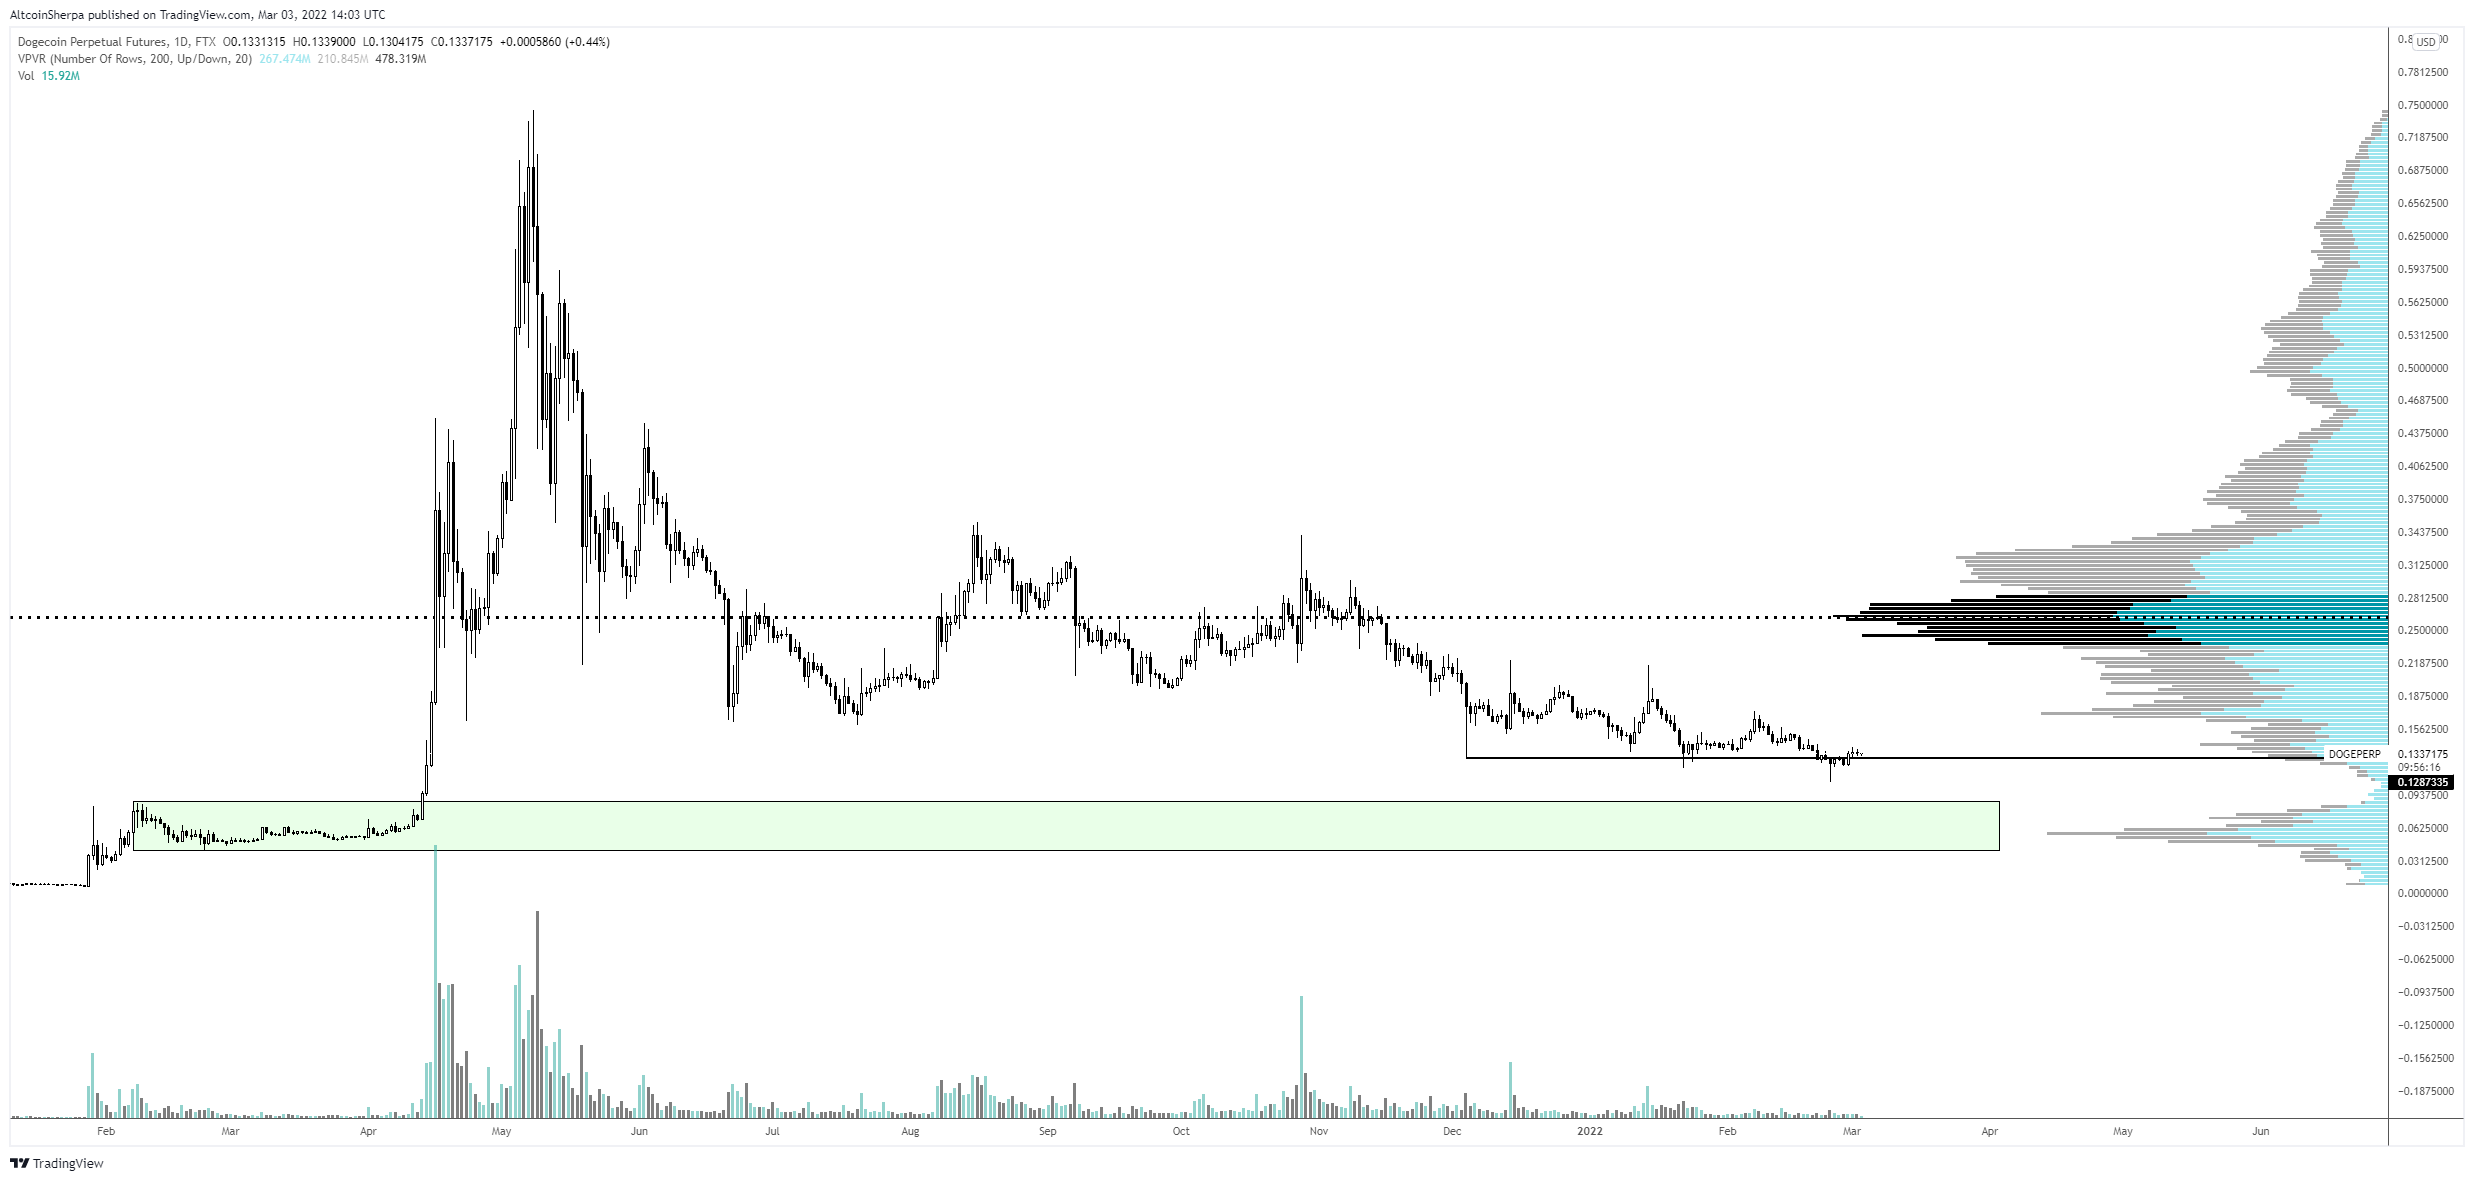
Cryptocurrency trader @AltcoinSherpa tweeted a DOGE chart, stating that the price is approaching a strong support level at $0.055. The area coincides with that which we have outlined.
Potential breakout
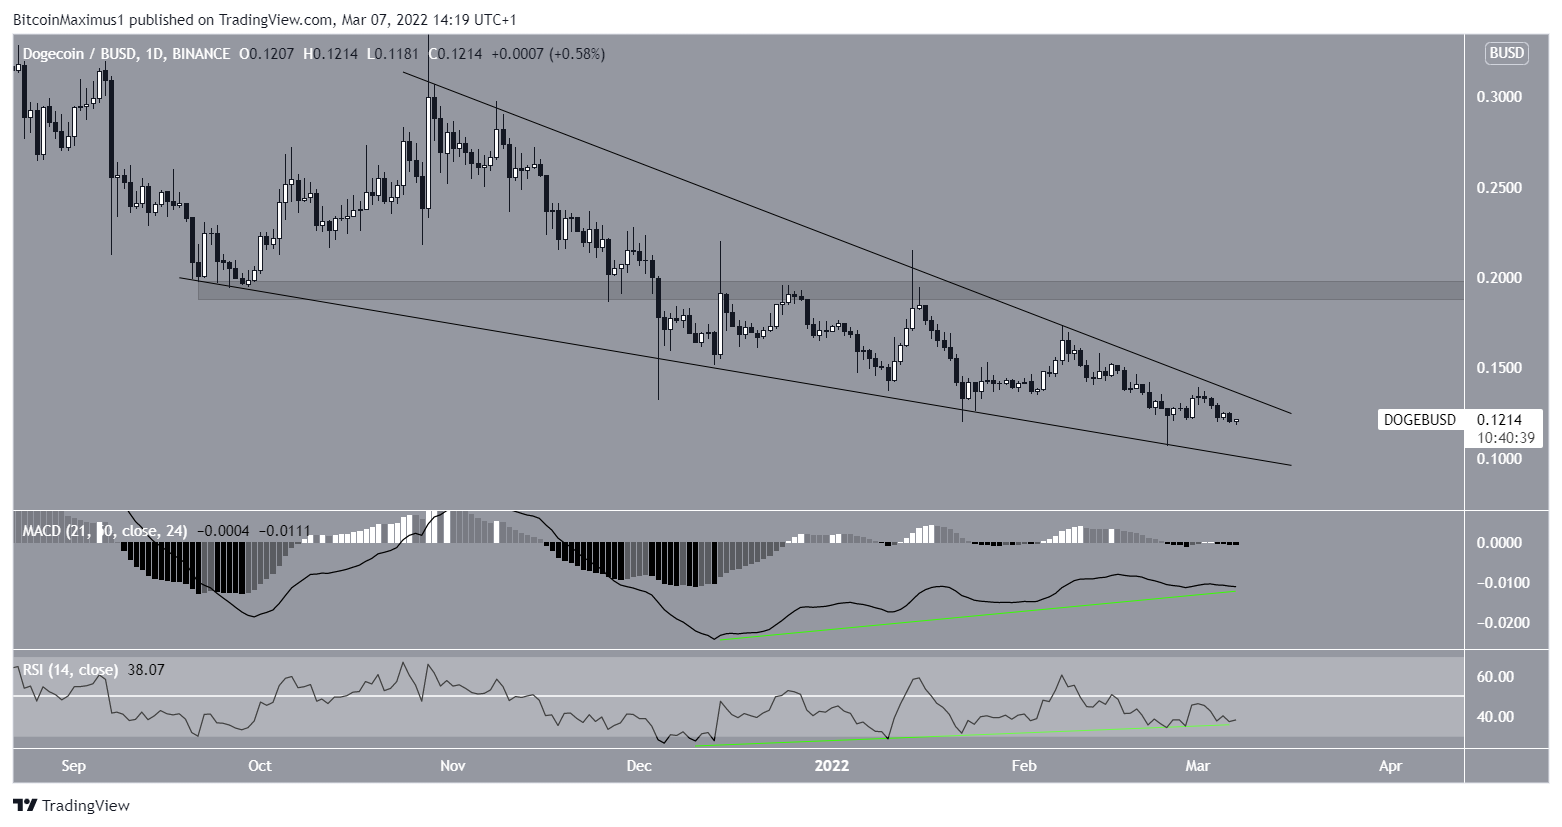
Technical indicators in the daily time-frame are showing some mixed signs.
On one hand, both the RSI and MACD have generated very significant bullish divergences. This is a sign that often precedes bullish trend reversals. It gains more legitimacy by the fact that DOGE is trading inside a bullish pattern.
However, both indicators are decreasing, which is a sign of weakening momentum. Therefore, technical indicators in the daily time-frame provide a mixed reading.
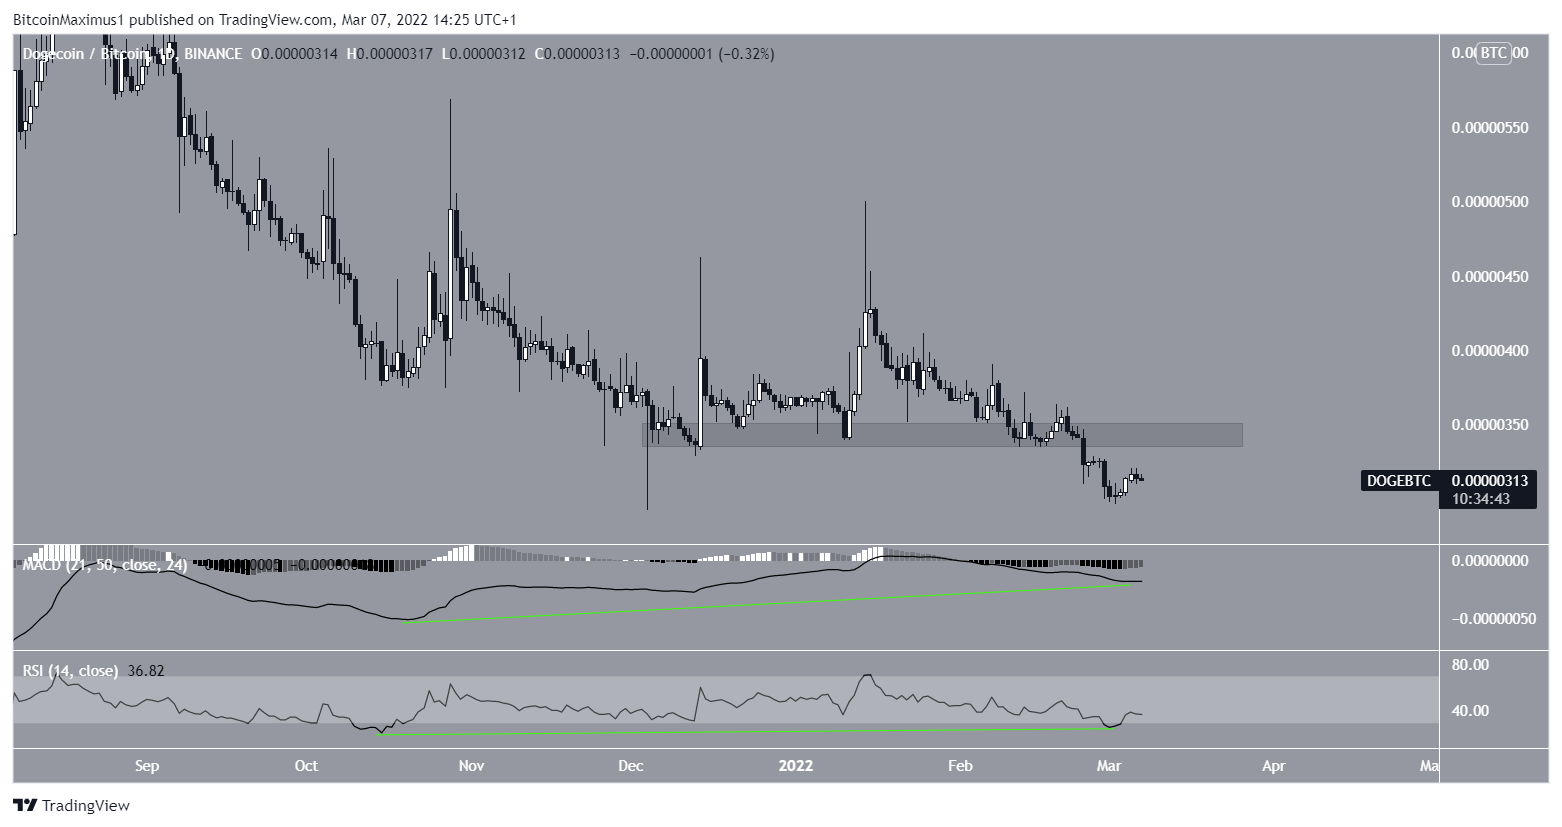
DOGE/BTC
The DOGE/BTC chart is slightly different, since the price is not trading inside a descending wedge.
However, there is a similar bullish divergence that has developed in both the RSI and MACD.
Nevertheless, DOGE is still trading below the 340 satoshi resistance area, a level that previously provided support.
Until DOGE reclaims it, the trend cannot be considered bullish.
For BeInCrypto’s previous Bitcoin (BTC) analysis, click here


