
BeInCrypto takes a look at the price movement for seven altcoins, including Ethereum (ETH) and Loopring (LRC), which have reached new all-time highs on Nov 2.
BTC
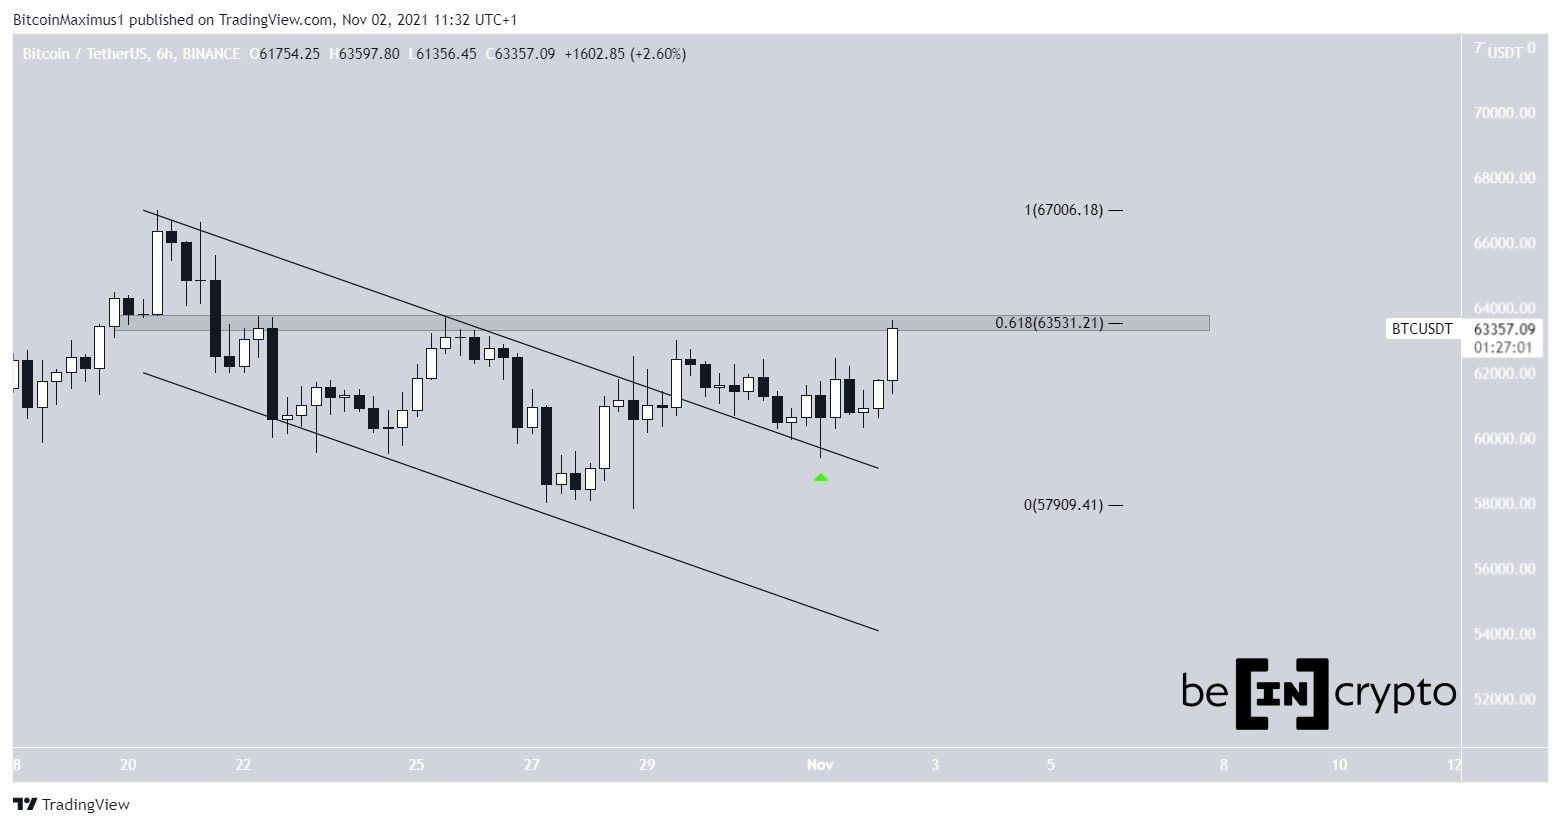
Bitcoin (BTC) has been decreasing inside a descending parallel channel since it reached an all-time high on Oct 20.
However, it broke out on Oct 29, in a sign that the correction might have come to an end. Afterwards, the subsequent validation of the line as support on Nov 1 (green icon) further solidified this possibility.
Currently, BTC is attempting to move above the $63,500 resistance area. This is the 0.618 Fib retracement resistance level, which most commonly acts as resistance during bounces.
A breakout from this level would confirm that the correction has ended.
ETH
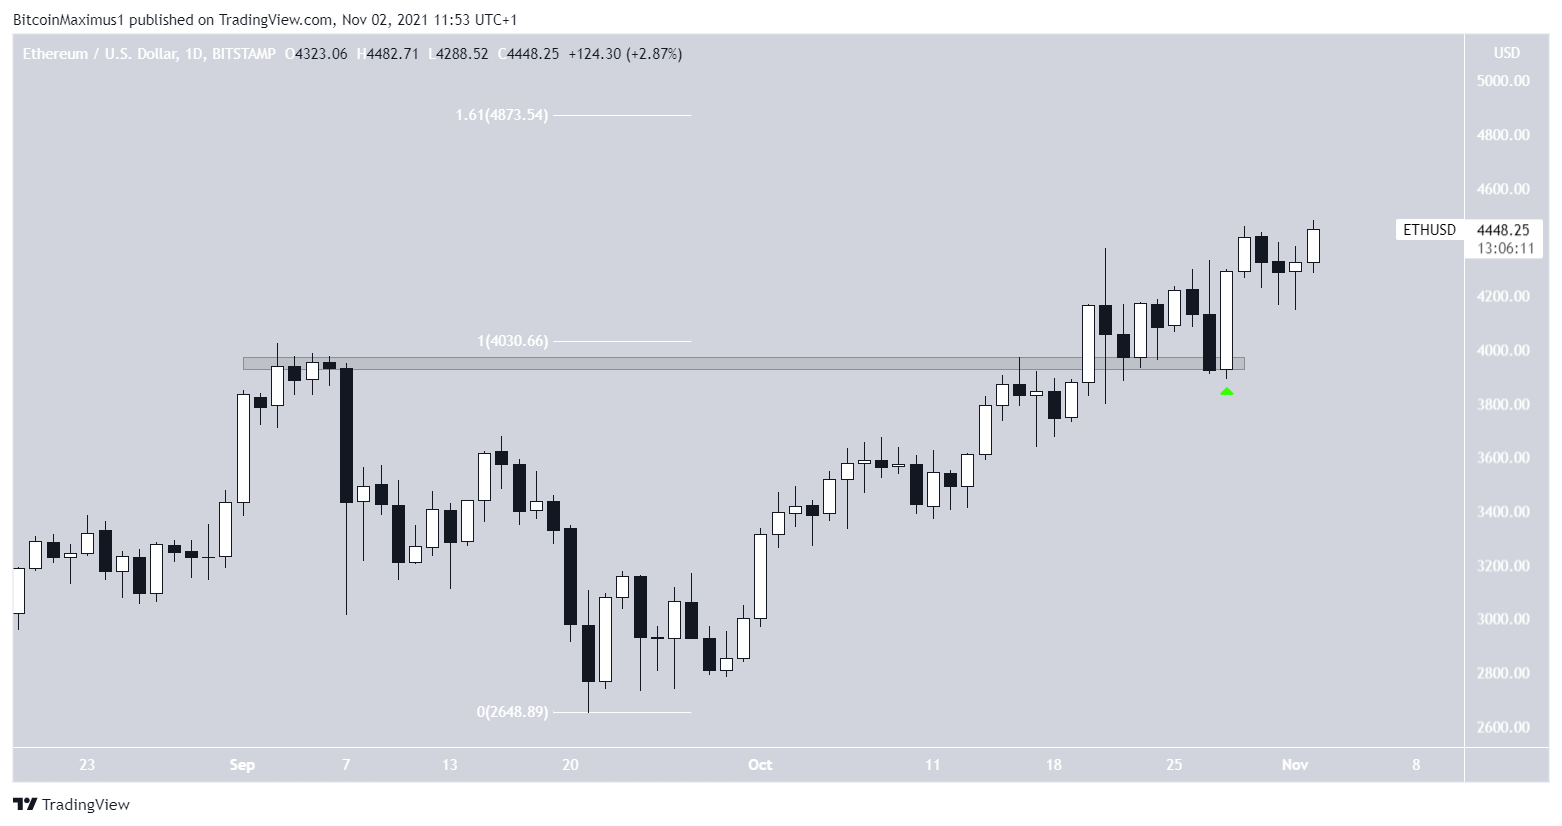
Ethereum (ETH) has been increasing since Sept 21. On Oct 20, it broke out above the $3,900 resistance area, which is the final one prior to a new all-time high price.
After validating the area as support on Oct 28, the token initiated yet another upward movement. On Nov 2, ETH reached a new all-time high price of $4,482.
The next closest resistance area is at $4,873. This is the 1.61 external Fib retracement level when measuring the most recent drop.
XRP
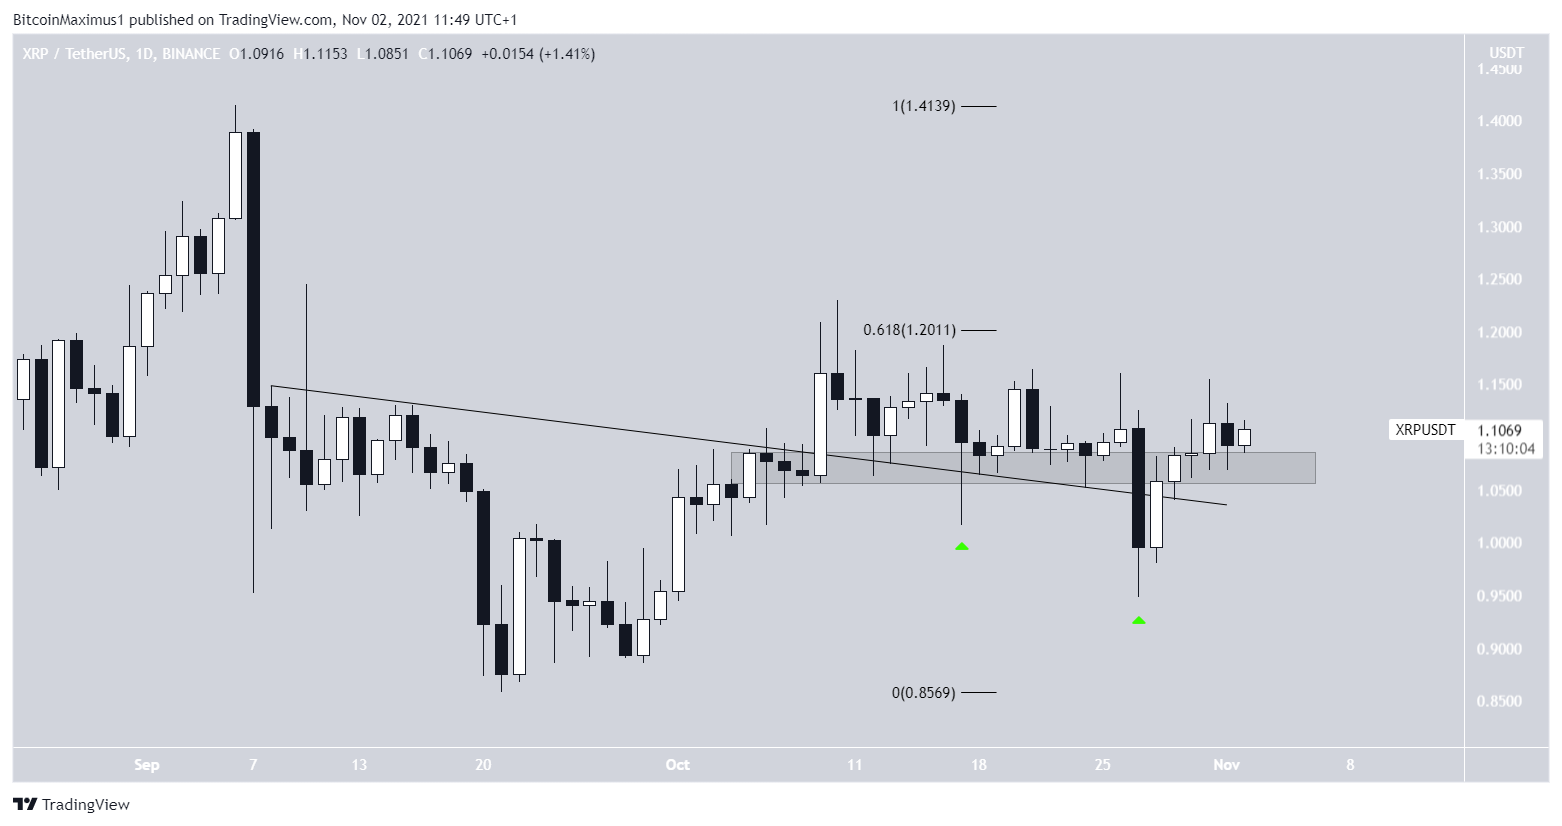
On Oct 9, XRP (XRP) broke out from a descending resistance line. However, it failed to move above the 0.618 Fib retracement resistance level and decreased considerably. Similarly to the case of BTC, the 0.618 Fib level is acting as resistance during the bounce.
However, XRP has bounced twice (green icons) and reclaimed the line each time. This is a bullish sign, since the lower prices could not be sustained. Usually, it leads to significant movements in the other direction.
A breakout above the 0.618 Fib retracement level at $1.20 would likely accelerate the rate of increase.
ATOM
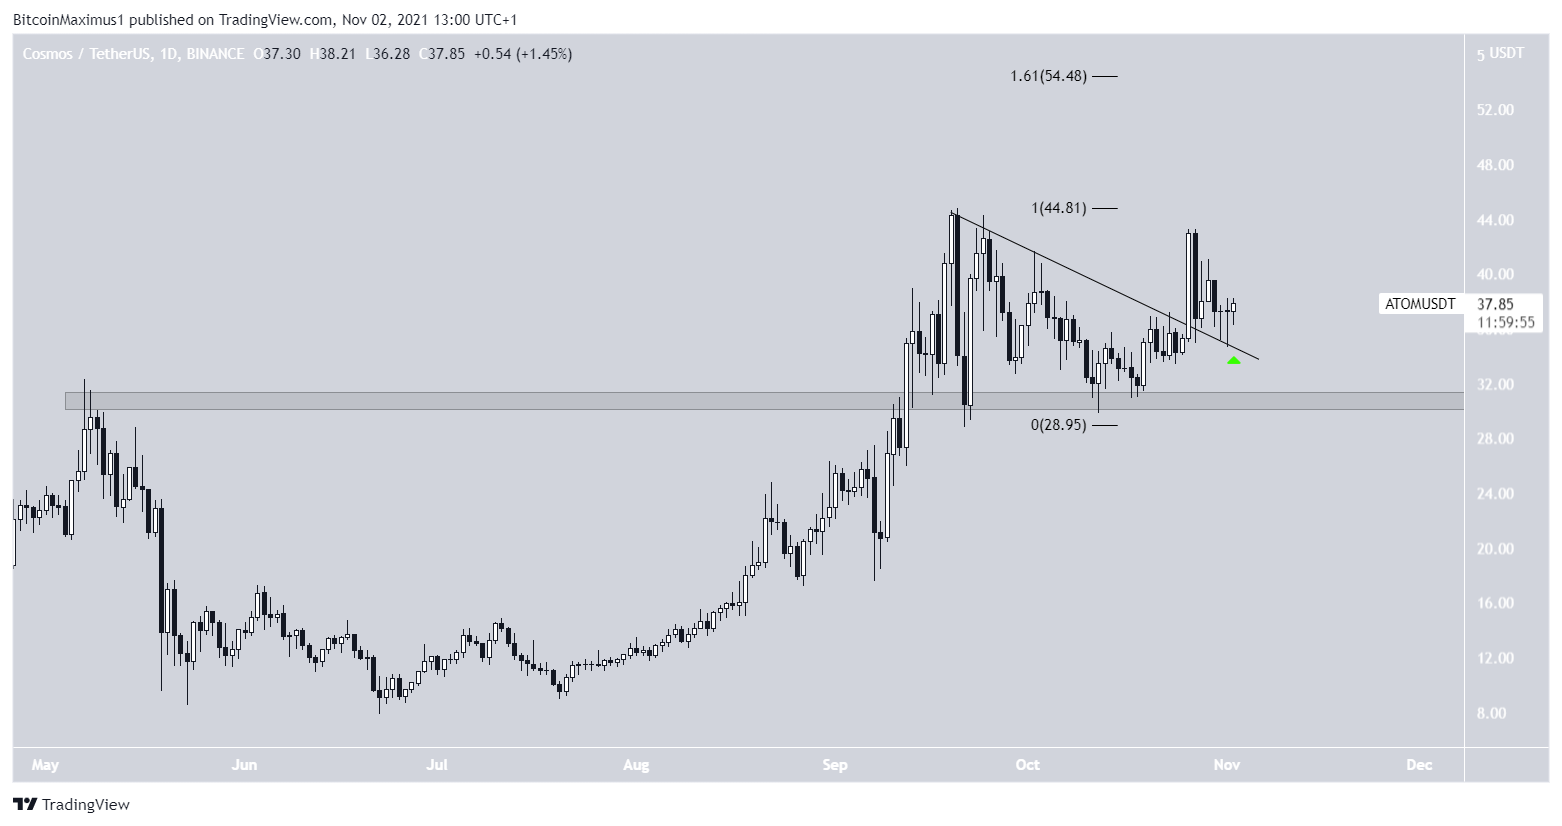
Cosmos (ATOM) has been decreasing alongside a descending resistance line since Sept 20, when it reached a high of $44.80.
While following the line, the token bounced at the $31 horizontal support area and initiated an upward movement.
On Oct 26, it broke out from the descending resistance line. It returned to validate it as support on Nov 1. This is a bullish development that confirms the validity of the breakout.
The next closest resistance area is at $54.50. This is the 1.61 external Fib retracement resistance level.
LRC
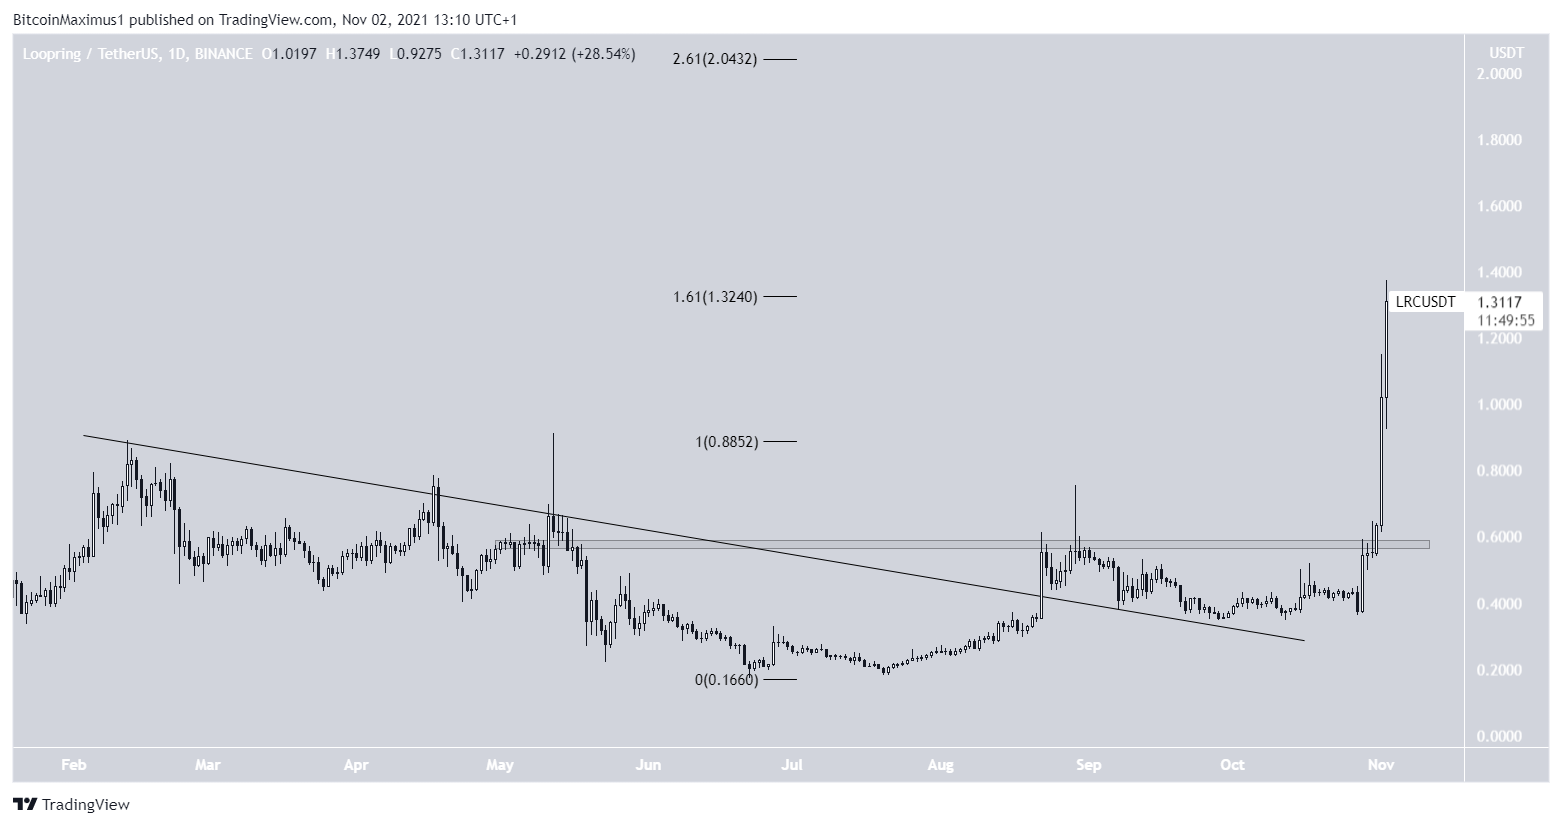
On Aug 22, LRC broke out from a long-term descending resistance line that had been in place since Feb 12. However, it failed to move above the $0.59 horizontal resistance area.
After the initial rejection, LRC eventually gained its footing and managed to break out on Oct 31. This greatly accelerated the rate of increase and led to a new all-time high price of $1.37 on Nov 2.
The high was made right at the 1.61 external Fib retracement level, which often acts as resistance. Therefore, it is possible that it will cause a short-term rejection.
The next resistance is at $2.04.
ENJ
ENJ had been increasing inside an ascending parallel channel since May 23. More recently, it was rejected in the beginning of September.
However, the token regained its footing and has been moving upwards since the beginning of Oct.
On Oct 31, it broke out from the channel and validated it as support the next day (green icon).
ENJ is currently approaching the all-time high region at $4.02. If successful in breaking out, the next resistance would be at $6.

KSM
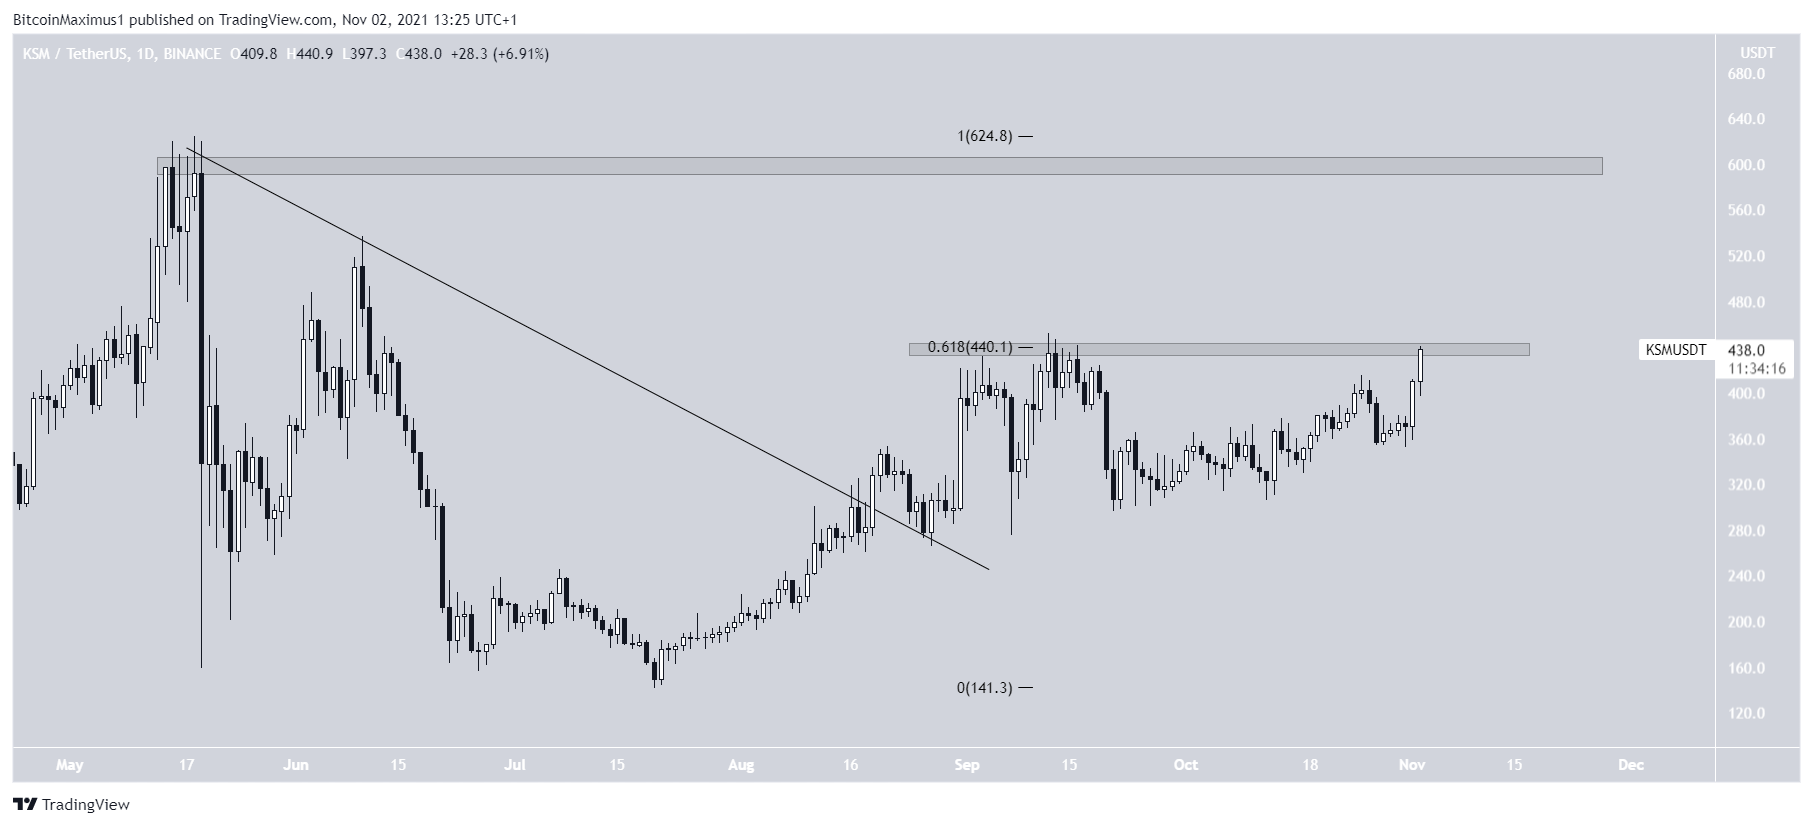
KSM has been increasing since breaking out from a descending resistance line on Aug 27.
However, it was rejected by the $440 resistance area on Sept 12 and began a downward movement.
Despite this, the token regained its footing and is currently in the process of breaking out once more.
If successful in doing so, the next resistance would be at $600.
For BeInCrypto’s latest Bitcoin (BTC) analysis, click here.
What do you think about this subject? Write to us and tell us!
