Until now, there have been three major Bitcoin corrections. They began in June 2011, November 2013, and December 2017. Numerous cryptocurrency traders use these as references for future price movements.
There have been several similarities between the 2014 correction and the current one — leading many people to believe that the absolute low has been reached at $3200 in December 2018.
Cryptocurrency analyst @davthewave claims that the current correction has been weaker than 2014 one. He did so by noting the difference in the movement in the yearly MAs — most notably, the one, two and three-year moving averages.
Reducing Volatility – 1, 2 and 3 year MAs.
— dave the wave (@davthewave) October 9, 2019
Notice the 1 year has only crossed the 2 year [not the 3 year like last time]. All three are converging on the buy zone. pic.twitter.com/eqBBdkYgX3
Moving Average Similarities
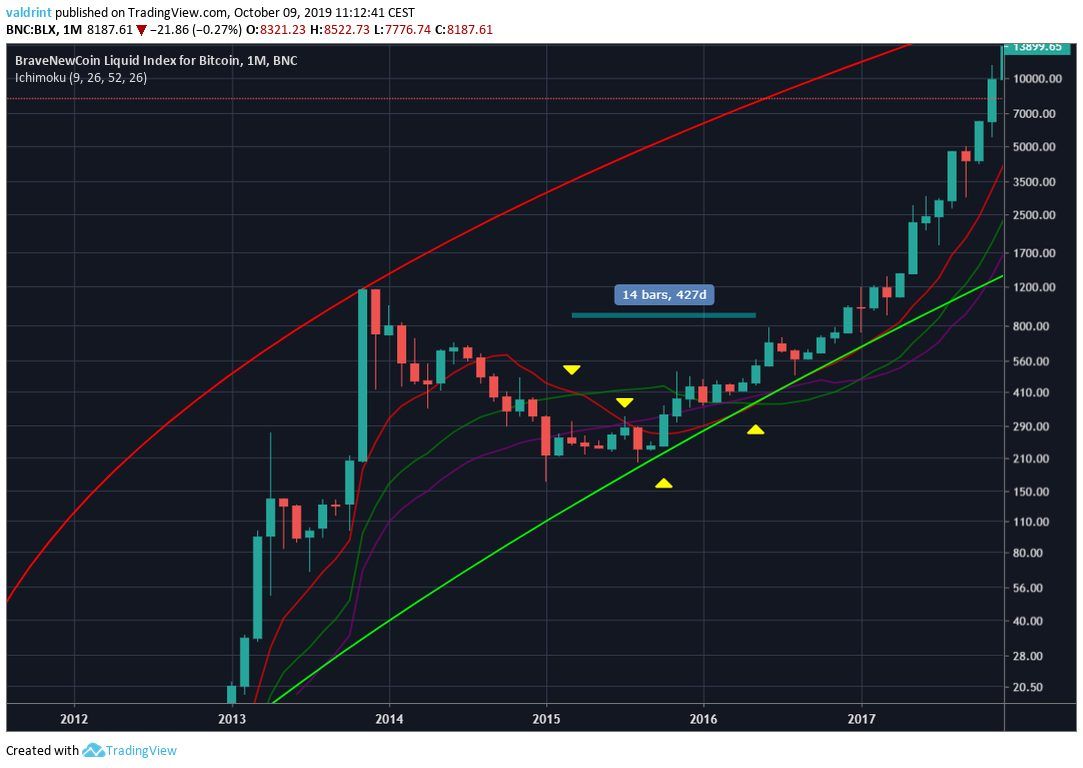
A number of indicators and methods can be used to compare movements — one of the most common being moving averages (MA). The relationship between them and price can be crucial in determining the direction and the strength of the underlying trend. Looking at the 2014 correction, the price and MA movements went as follows:- A bearish cross between the 1- and 2-year MAs transpired in March 2015. The price was trading below all three MAs at the current time.
- Afterward, a bearish cross between the 1- and 3-year MAs followed in July 2015 — right before the price touched the support line.
- Afterward, the Bitcoin price swiftly moved above the MAs and used them as support. Until the current correction, the price did not trade below the MAs or the support line. A bullish cross between the aforementioned MAs transpired in May 2016.
 It took 427 days for the Bitcoin price to recover from the bearish cross and make a bullish one.
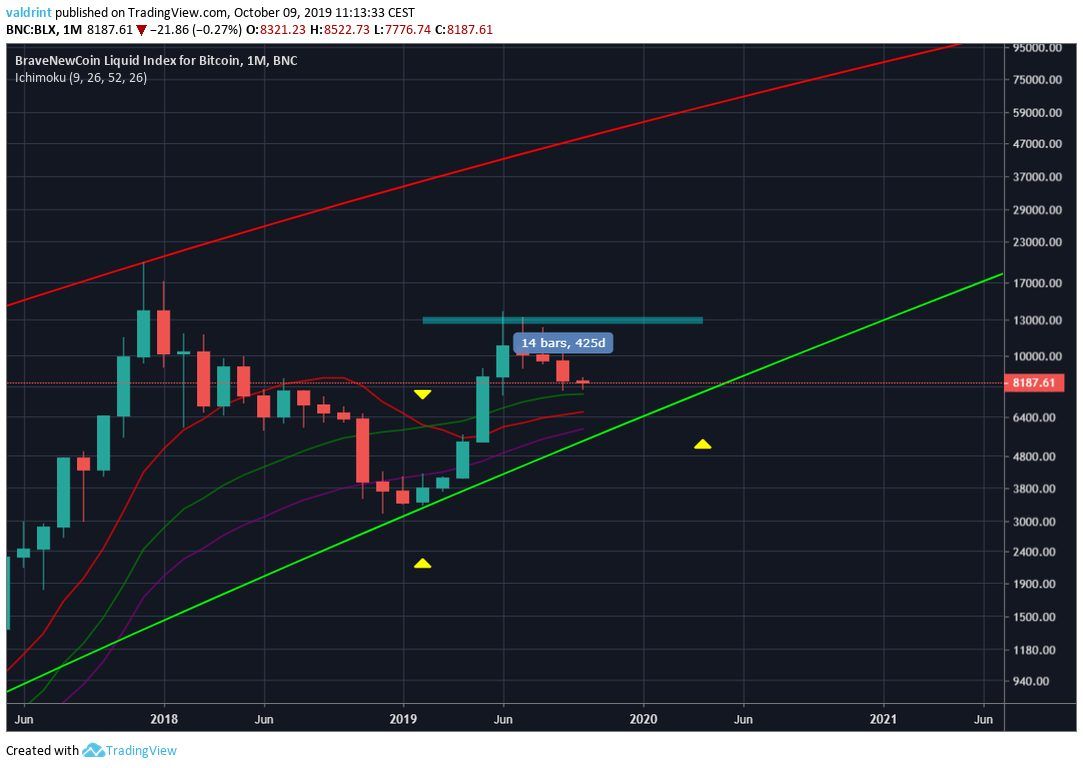
On the other hand, the movement in the 2018 correction has been different. A bearish cross between the 1- and 2-year MAs occurred in February 2019. At this time, the price had already reached the support line. It immediately began to move upward and crossed above both MAs.
Unlike the previous correction, a bearish cross between the 1- and 3-year MAs has yet to occur and, based on the current price movement, looks unlikely. This is since the Bitcoin price is already trading above all three MAs — which have begun to turn upwards.
 Giving a similar amount of time for a bullish cross to occur as the previous correction, it should happen in April 2020. However, the correction has been weaker and we may expect a bullish cross and full price recovery sooner.
RSI Similarities
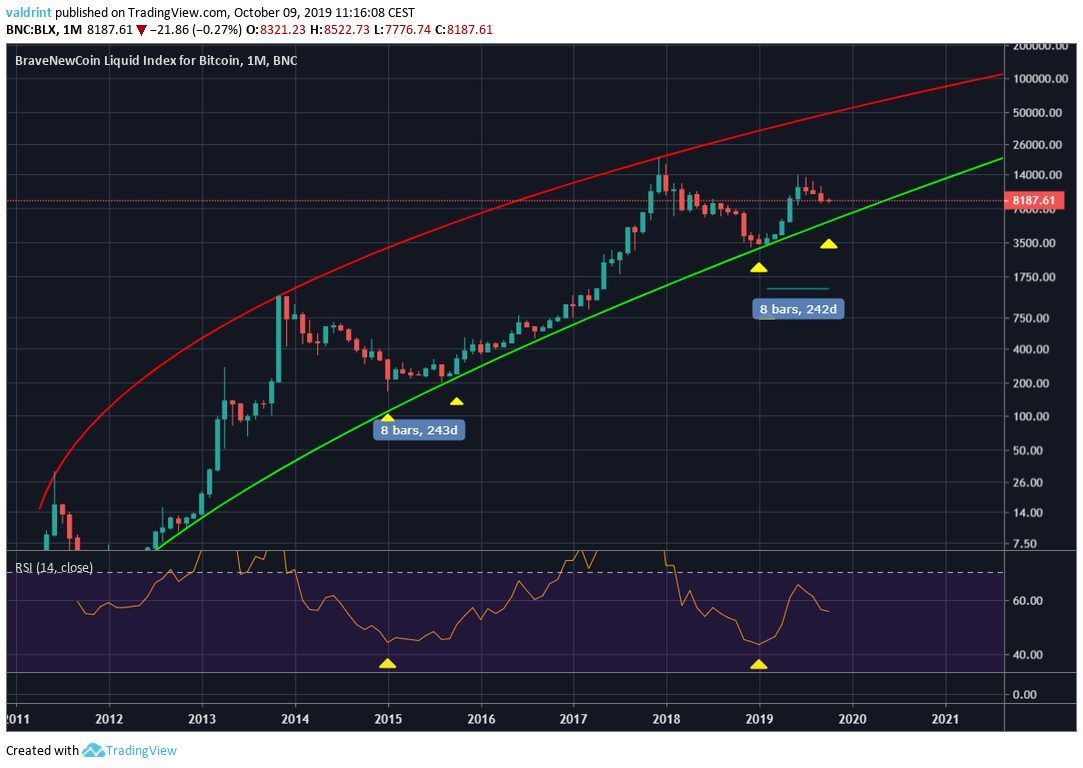
Another similarity that can help us predict when that bullish cross will occur is given by the RSI. It reached identical values of 43 in January 2015 and 2019. After January 2015, it reached a higher low in October 2015 before moving upward and creating a bullish cross.
If the movement after January 2019 takes the same amount of time, the price should make a higher low this month — reaching the support line and moving upward and creating a bullish cross. This fits with the hypothesis laid out in the previous section and our long-term analysis.
Do you think we have finished the current Bitcoin price correction? If not, where will the price make a low? Let us know your thoughts in the comments below.
Disclaimer: This article is not trading advice and should not be construed as such. Always consult a trained financial professional before investing in cryptocurrencies, as the market is particularly volatile. Images are courtesy of Shutterstock, TradingView.
Disclaimer
In line with the Trust Project guidelines, this price analysis article is for informational purposes only and should not be considered financial or investment advice. BeInCrypto is committed to accurate, unbiased reporting, but market conditions are subject to change without notice. Always conduct your own research and consult with a professional before making any financial decisions. Please note that our Terms and Conditions, Privacy Policy, and Disclaimers have been updated.

Valdrin Tahiri
Valdrin discovered cryptocurrencies while he was getting his MSc in Financial Markets from the Barcelona School of Economics. Shortly after graduating, he began writing for several different cryptocurrency related websites as a freelancer before eventually taking on the role of BeInCrypto's Senior Analyst.
(I do not have a discord and will not contact you first there. Beware of scammers)
READ FULL BIO
Sponsored
Sponsored
