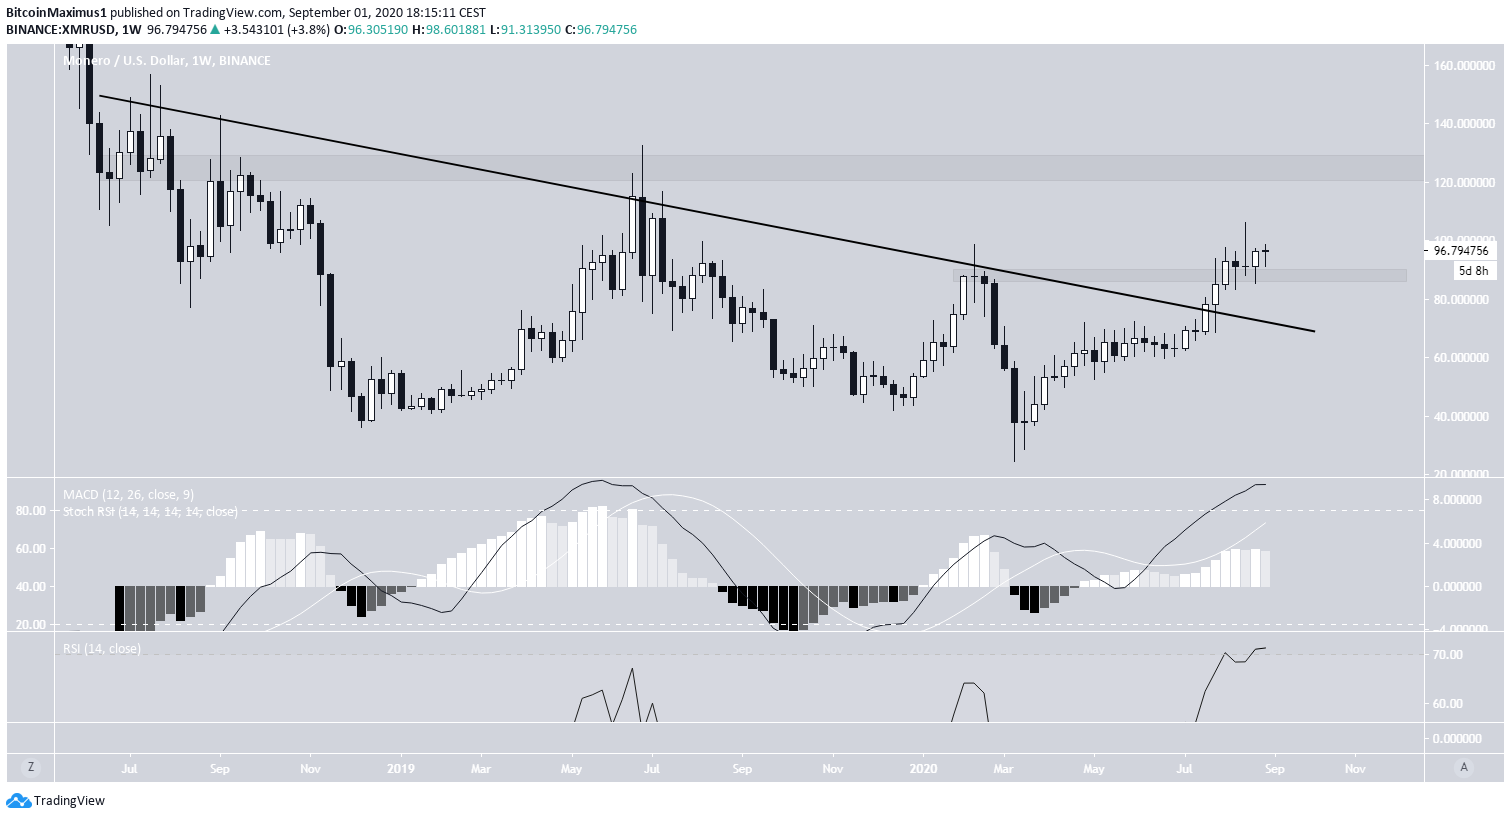
The Monero (XMR) price has broken out from a long-term resistance area and validated it as support and is expected to continue moving upwards towards $125.
At the beginning of August, XMR broke out from a descending resistance line that had been in place for over a year.
Afterward, the price broke out above the March highs at $88 and validated the area as support after. The next resistance area is found at $126.
Technical indicators show that the rally is overextended but still appears bullish. Both the RSI and Stochastic RSI are increasing, even though they are both overbought. There is no bearish divergence for the time being.
Ripe For Continuation
Cryptocurrency trader @nagatodharma outlined an XMR chart which shows oversold conditions in the RSI, indicating that the price is expected to move upwards.
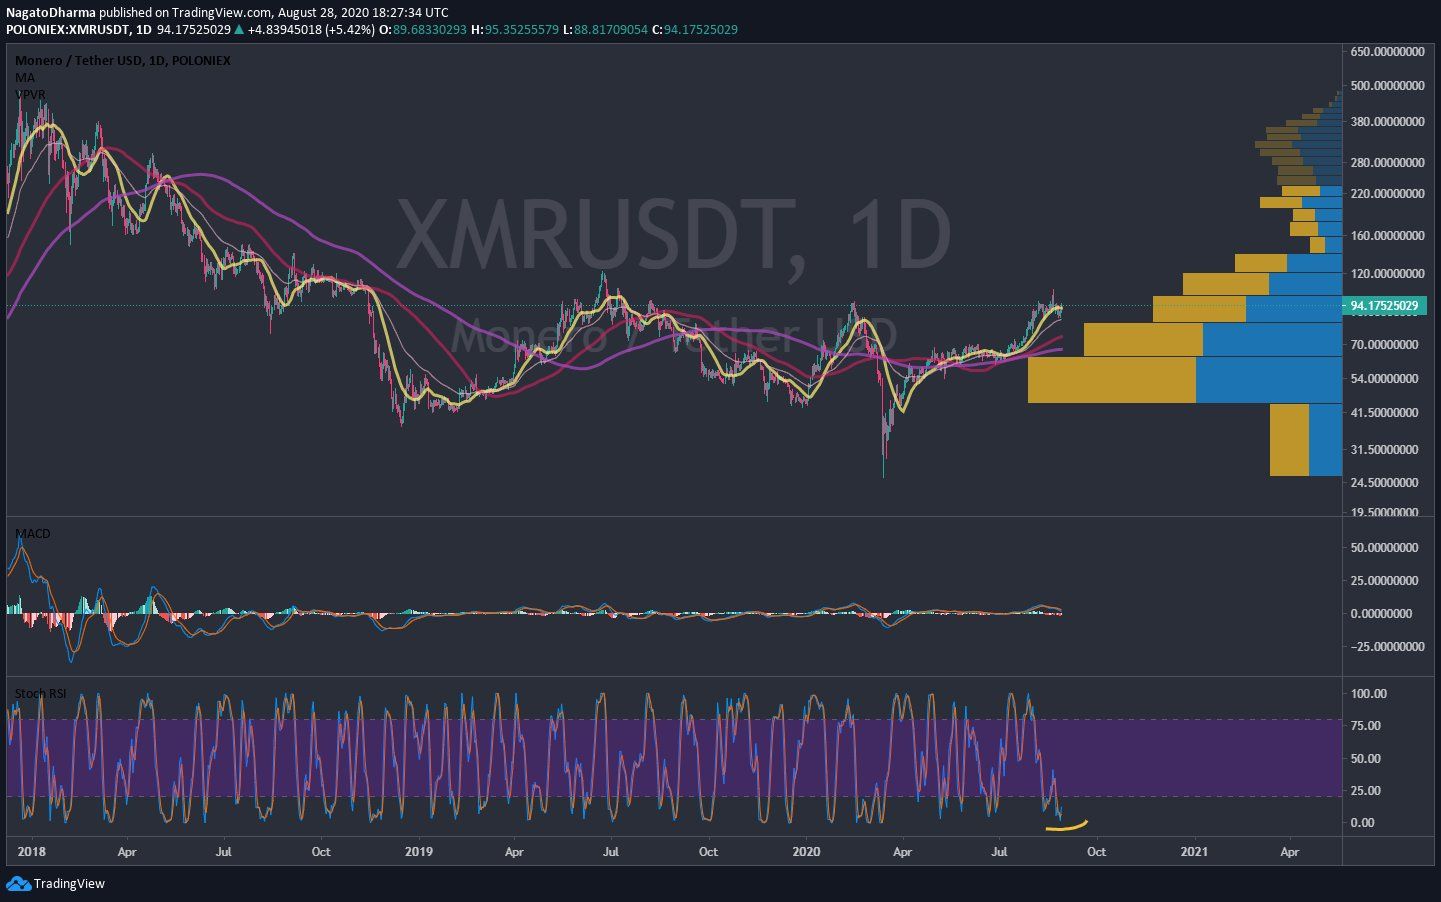
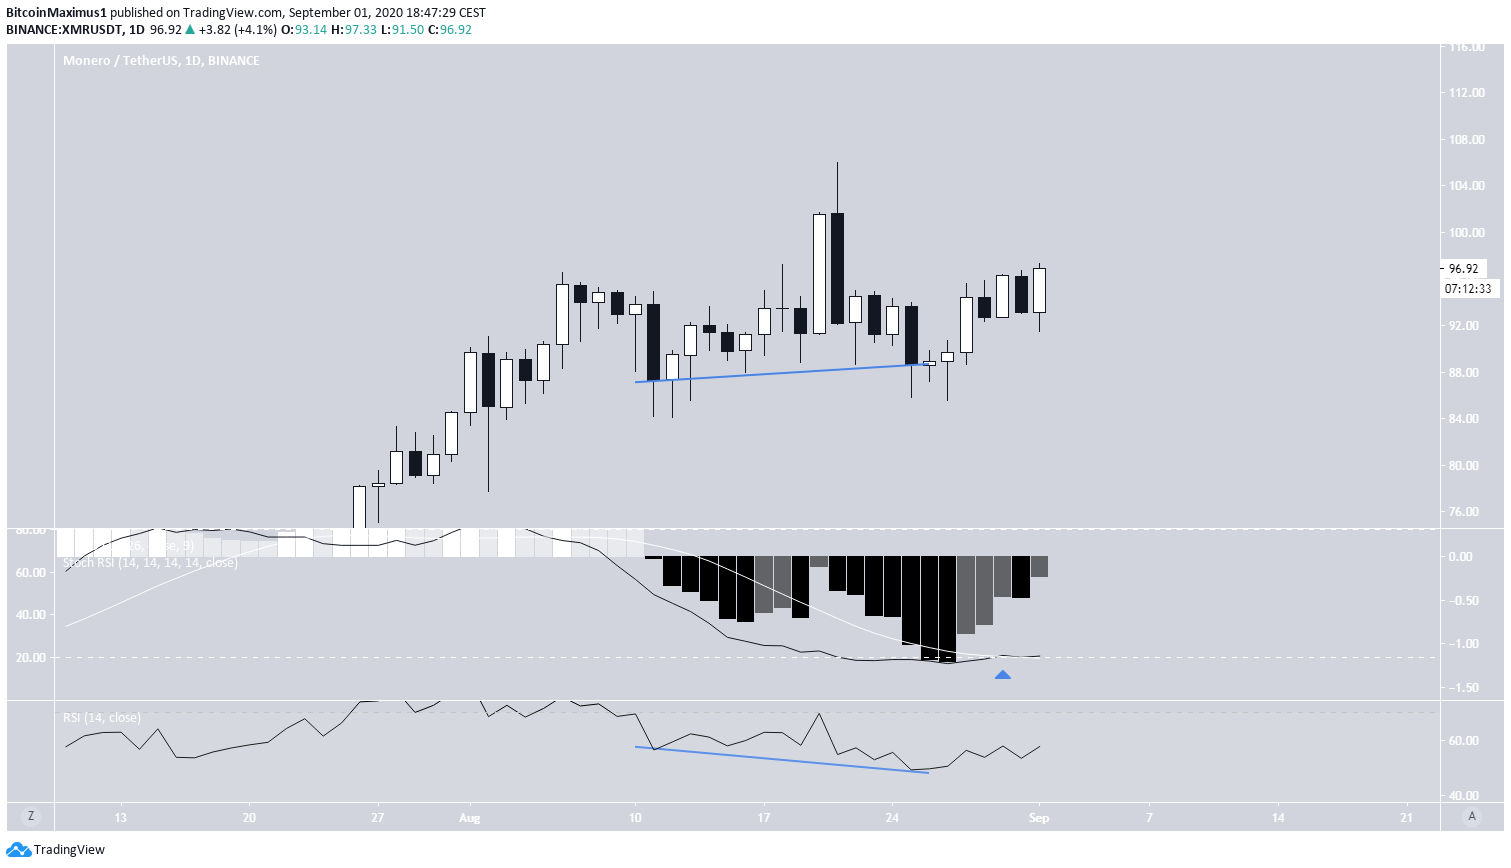
Since the tweet, a bullish cross has transpired in the stochastic RSI, which has moved out of the oversold region.
Prior to doing so, there was a considerable hidden bullish divergence in the RSI, and the MACD gave a bullish reversal signal. This indicates that the price is likely to continue moving upwards towards the resistance areas outlined in the previous section.
Wave Count
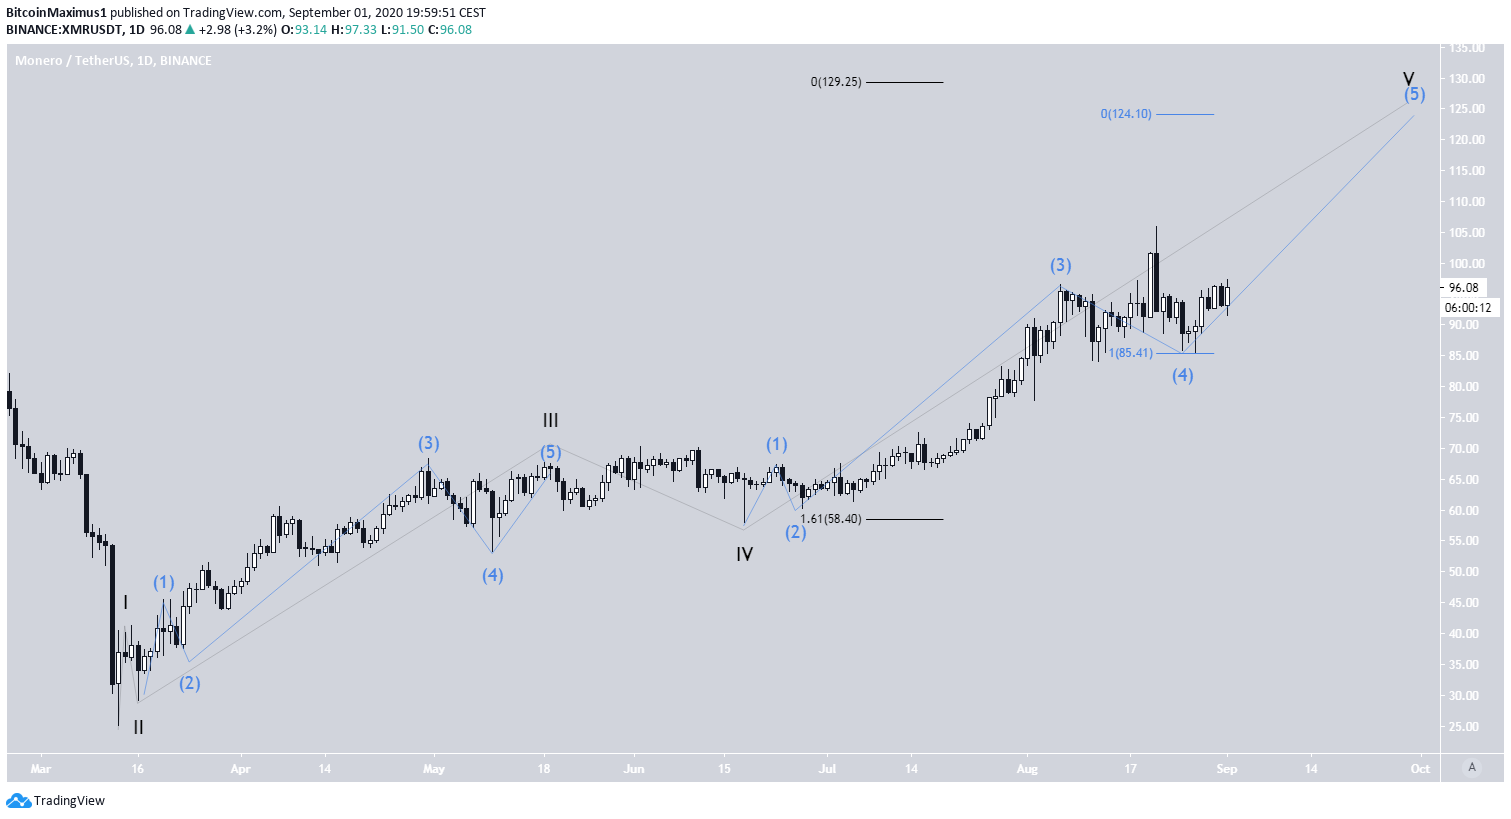
Since the beginning of March, the XMR price has likely begun a five-wave formation (shown in black below), which is expected to end between $124-$129, inside the resistance area outlined in the previous section.
At the time of press, XMR was trading inside the fifth sub-wave (blue) of this formation.
The target shown below is the 1.61 Fib level of waves 1-3 (black) and the 1 Fib level of sub-waves 1-3 (blue).
A decrease below the sub-wave 4 low at $85.41 would invalidate this particular wave count.
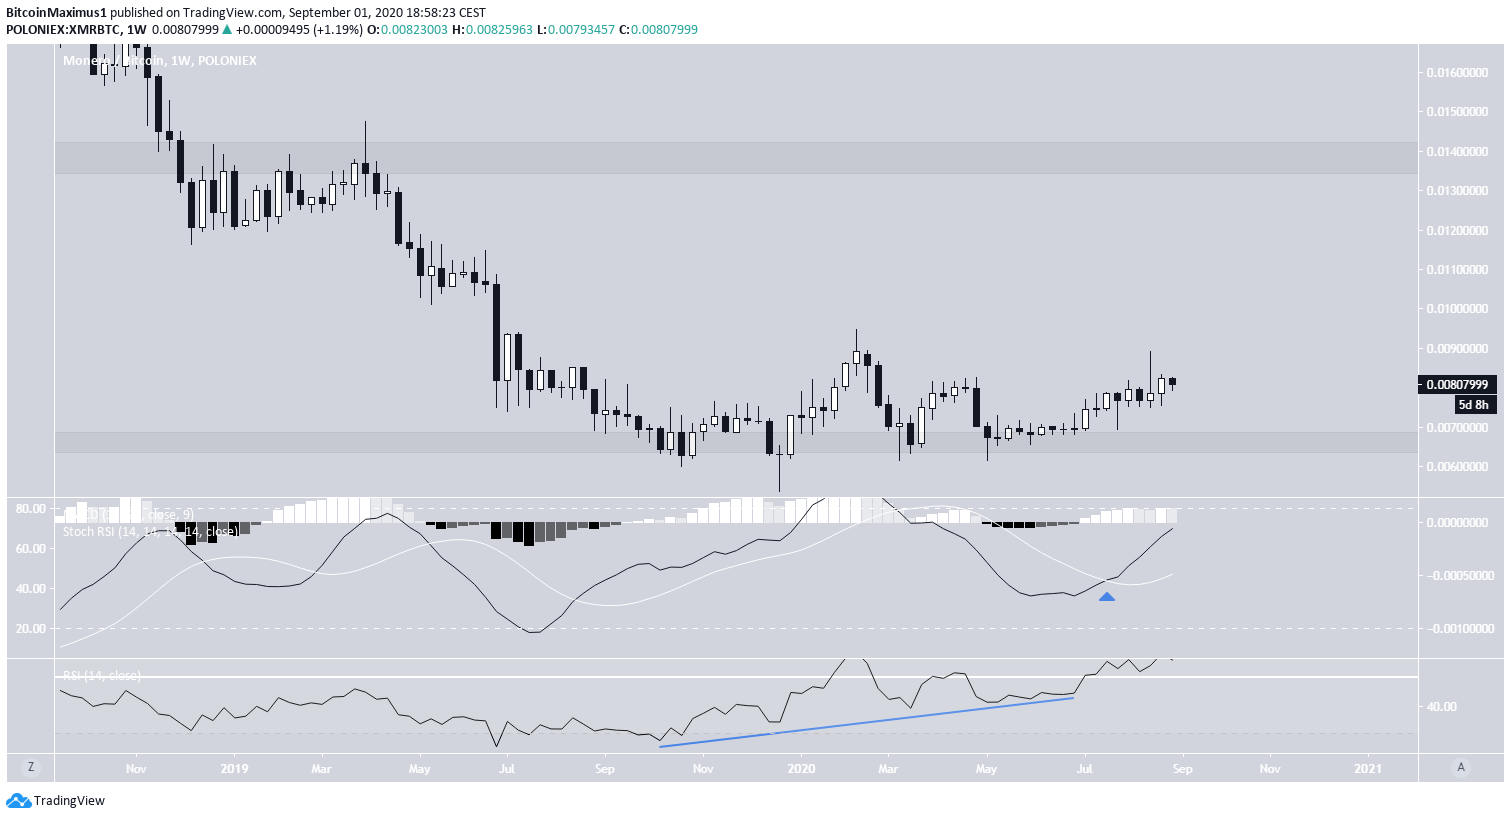
XMR/BTC
The XMR/BTC pair looks similarly bullish.
It has been consolidating near the 0.0065 satoshi support area since October 2019. Throughout this time, the RSI has generated considerable bullish divergence. Furthermore, the stochastic RSI has made a bullish cross and is moving upwards.
If the price continues increasing as expected, it is likely to reach the closest long-term resistance area at ₿0.014.