
On May 28, the Monero price reached a high of $99.0. After a gradual decrease, similar highs were reached on May 30. The XMR price has been decreasing since, creating several lower high and lows.
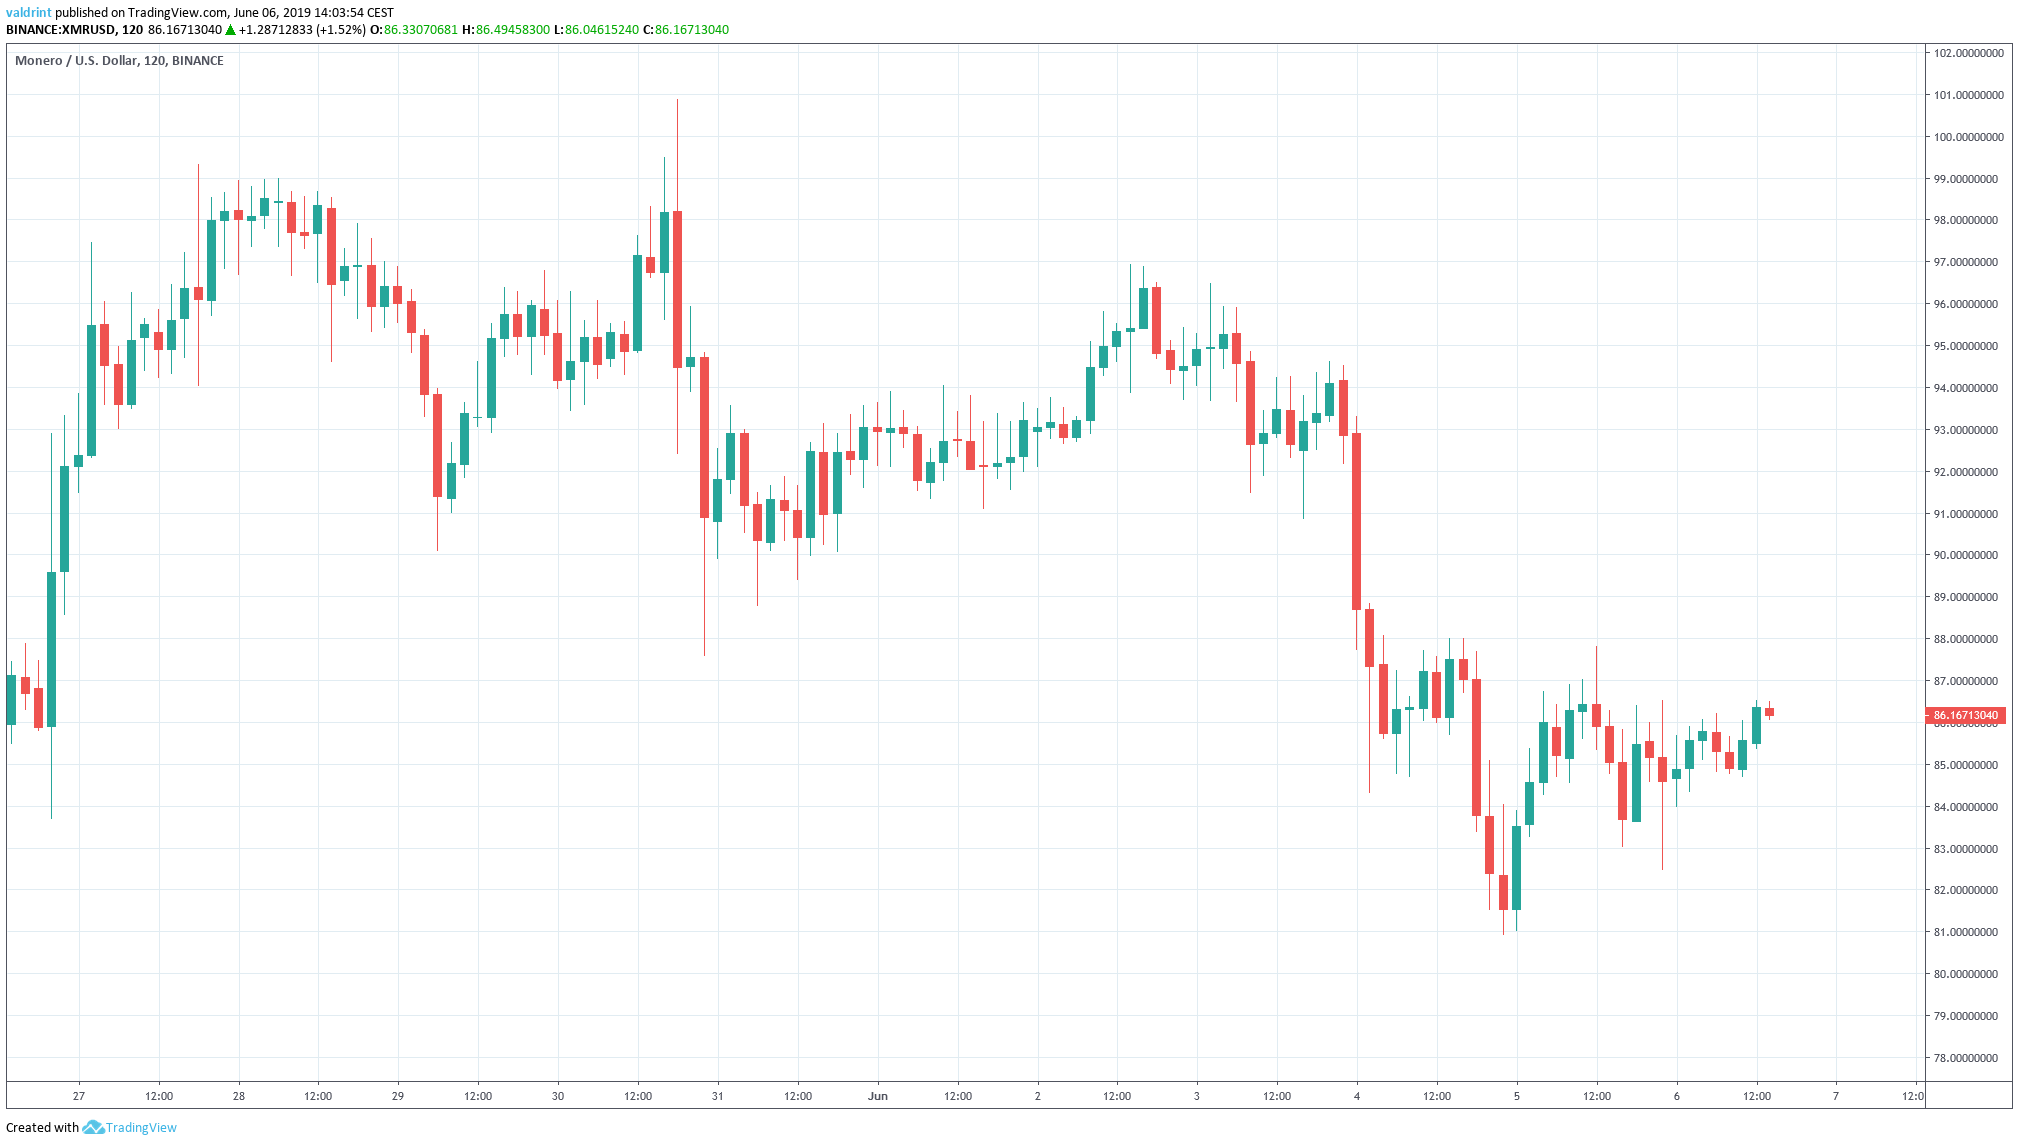
Lows close to $81 were reached on Jun 4. Where will the Monero price go next? Keep reading below in order to find out.
Monero (XMR): Trends And Highlights for Jun 6
- The Monero price has been on a downtrend since May 30.
- It is trading inside a descending channel.
- It is following a long-term ascending support line.
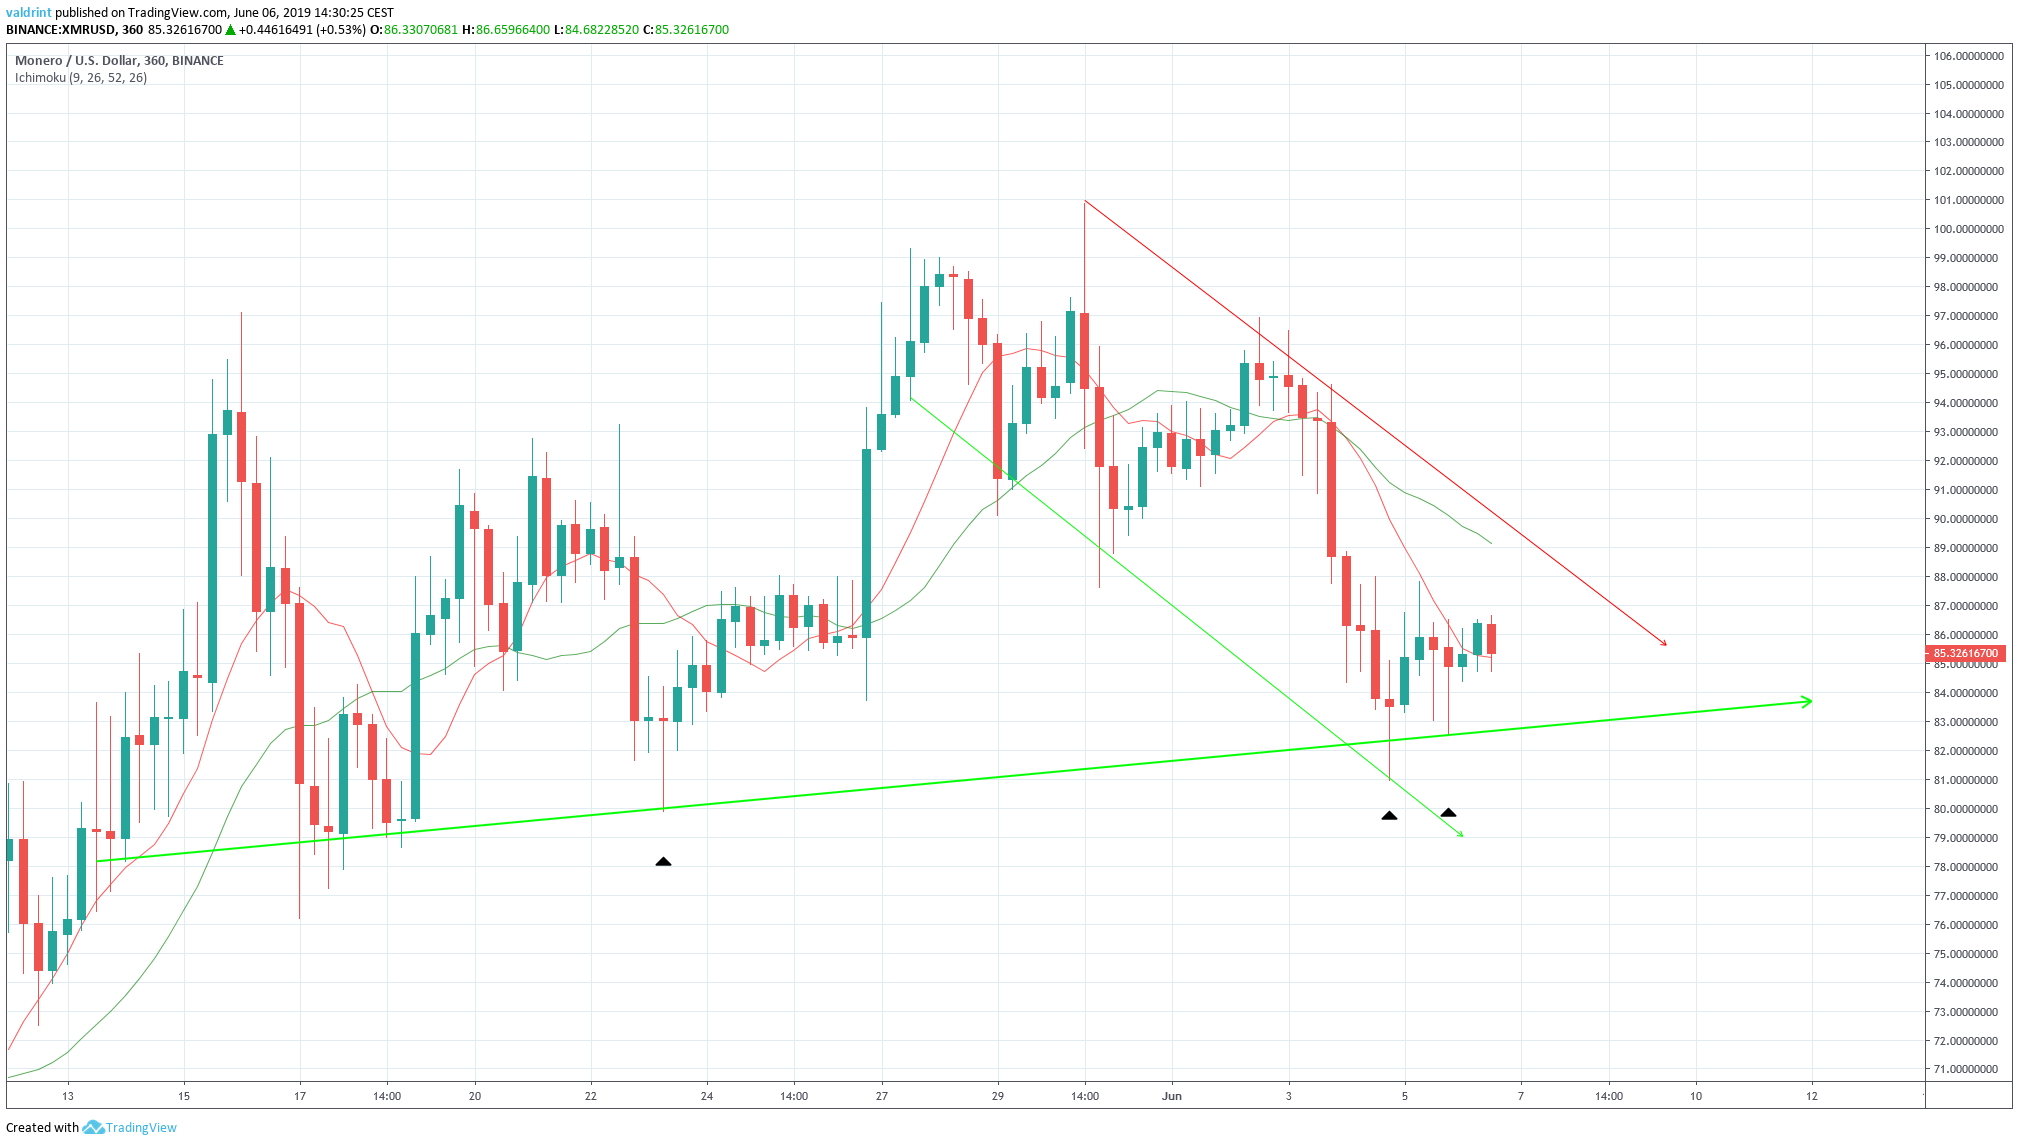
- It is trading between short-term moving averages.
- There is support near $79.
Symmetrical Triangle
On Mar 27, the Monero price made a low of $94.29. A gradual decrease was followed by an increase. On May 30, the price made a high of $100.87.
Since then, it has made successive lower highs and lows. Tracing them gives us the descending channel outlined below:
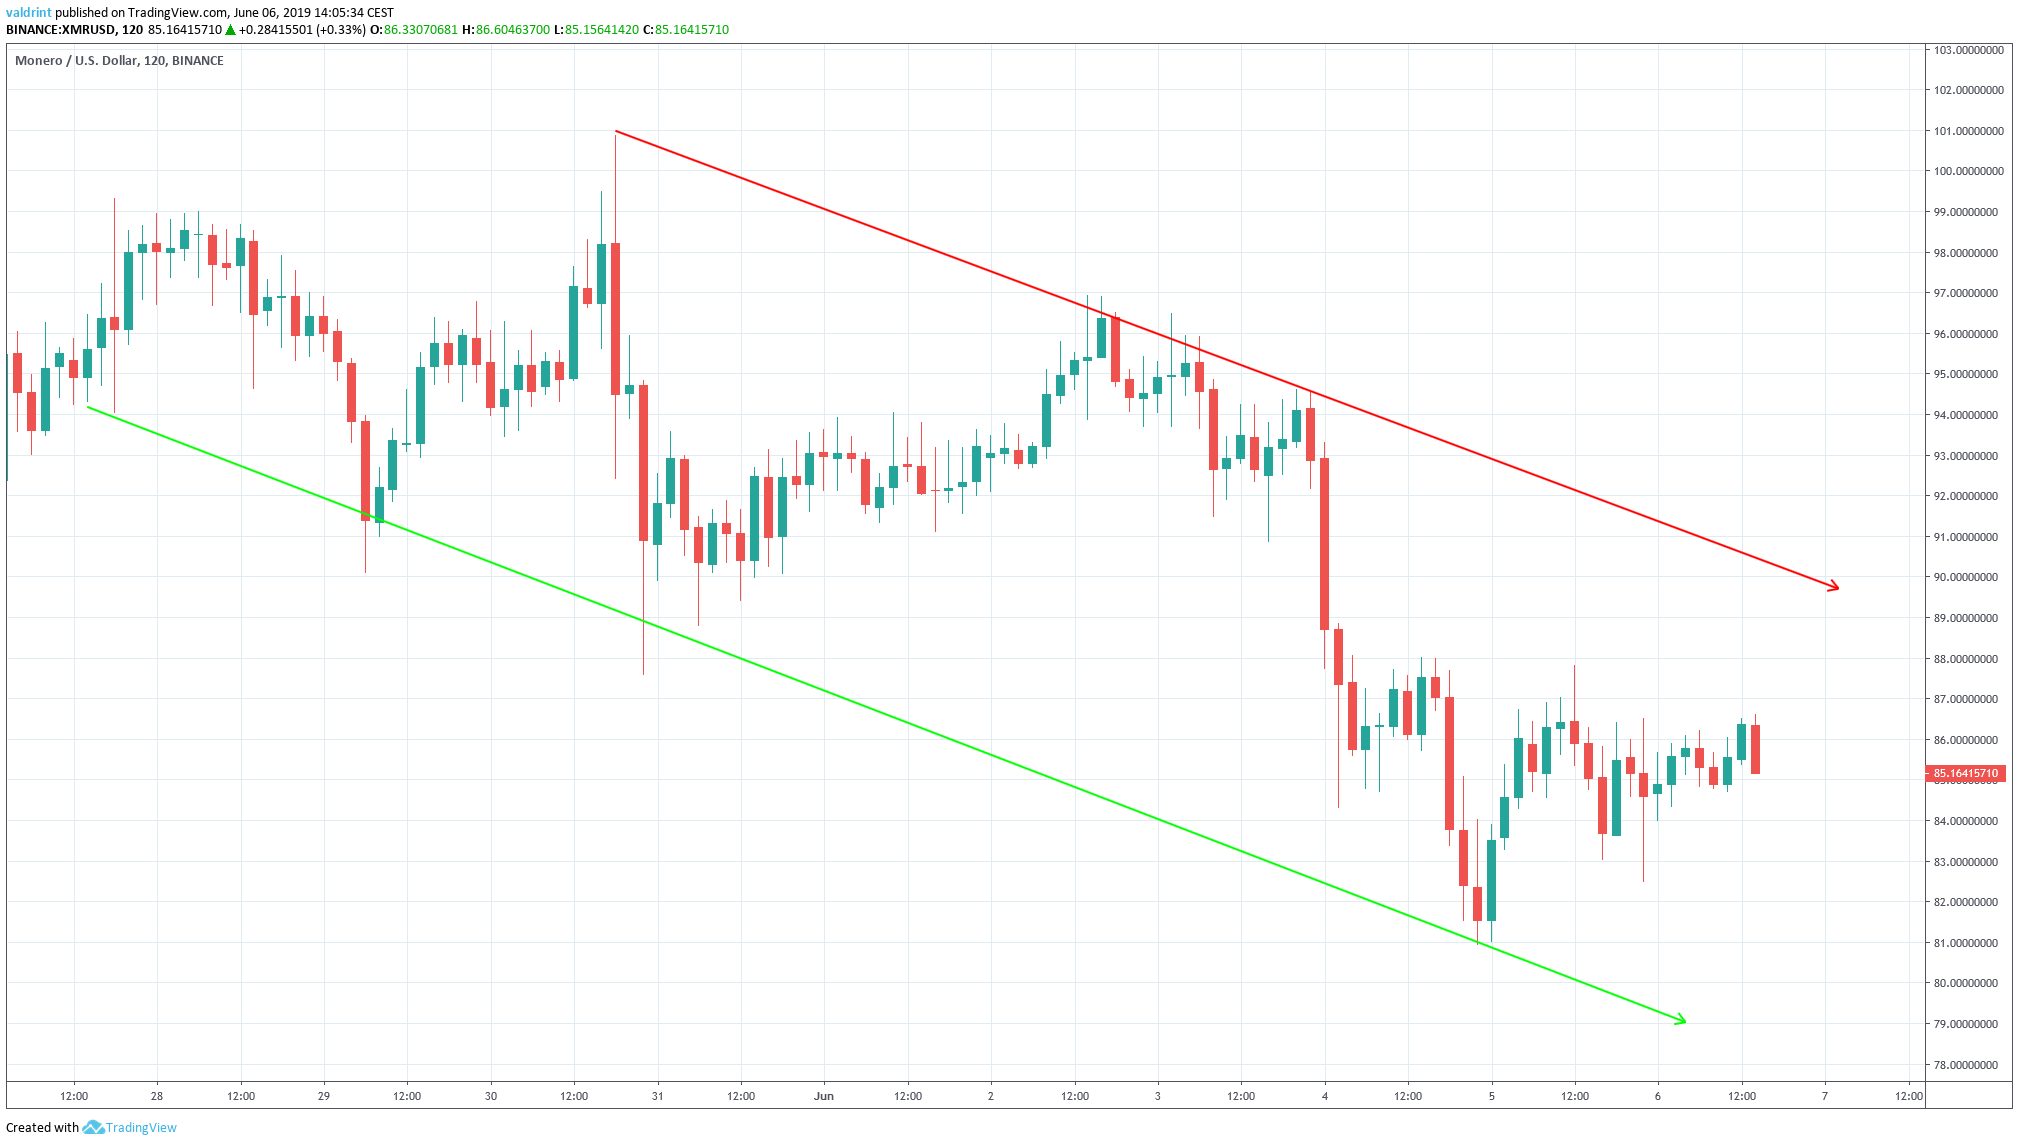
At the time of writing, the XMR price is trading in the middle of the channel, struggling to break through $87.
Next, we will look at technical indicators in order to predict its future movements.
Monero Price: Moving Averages
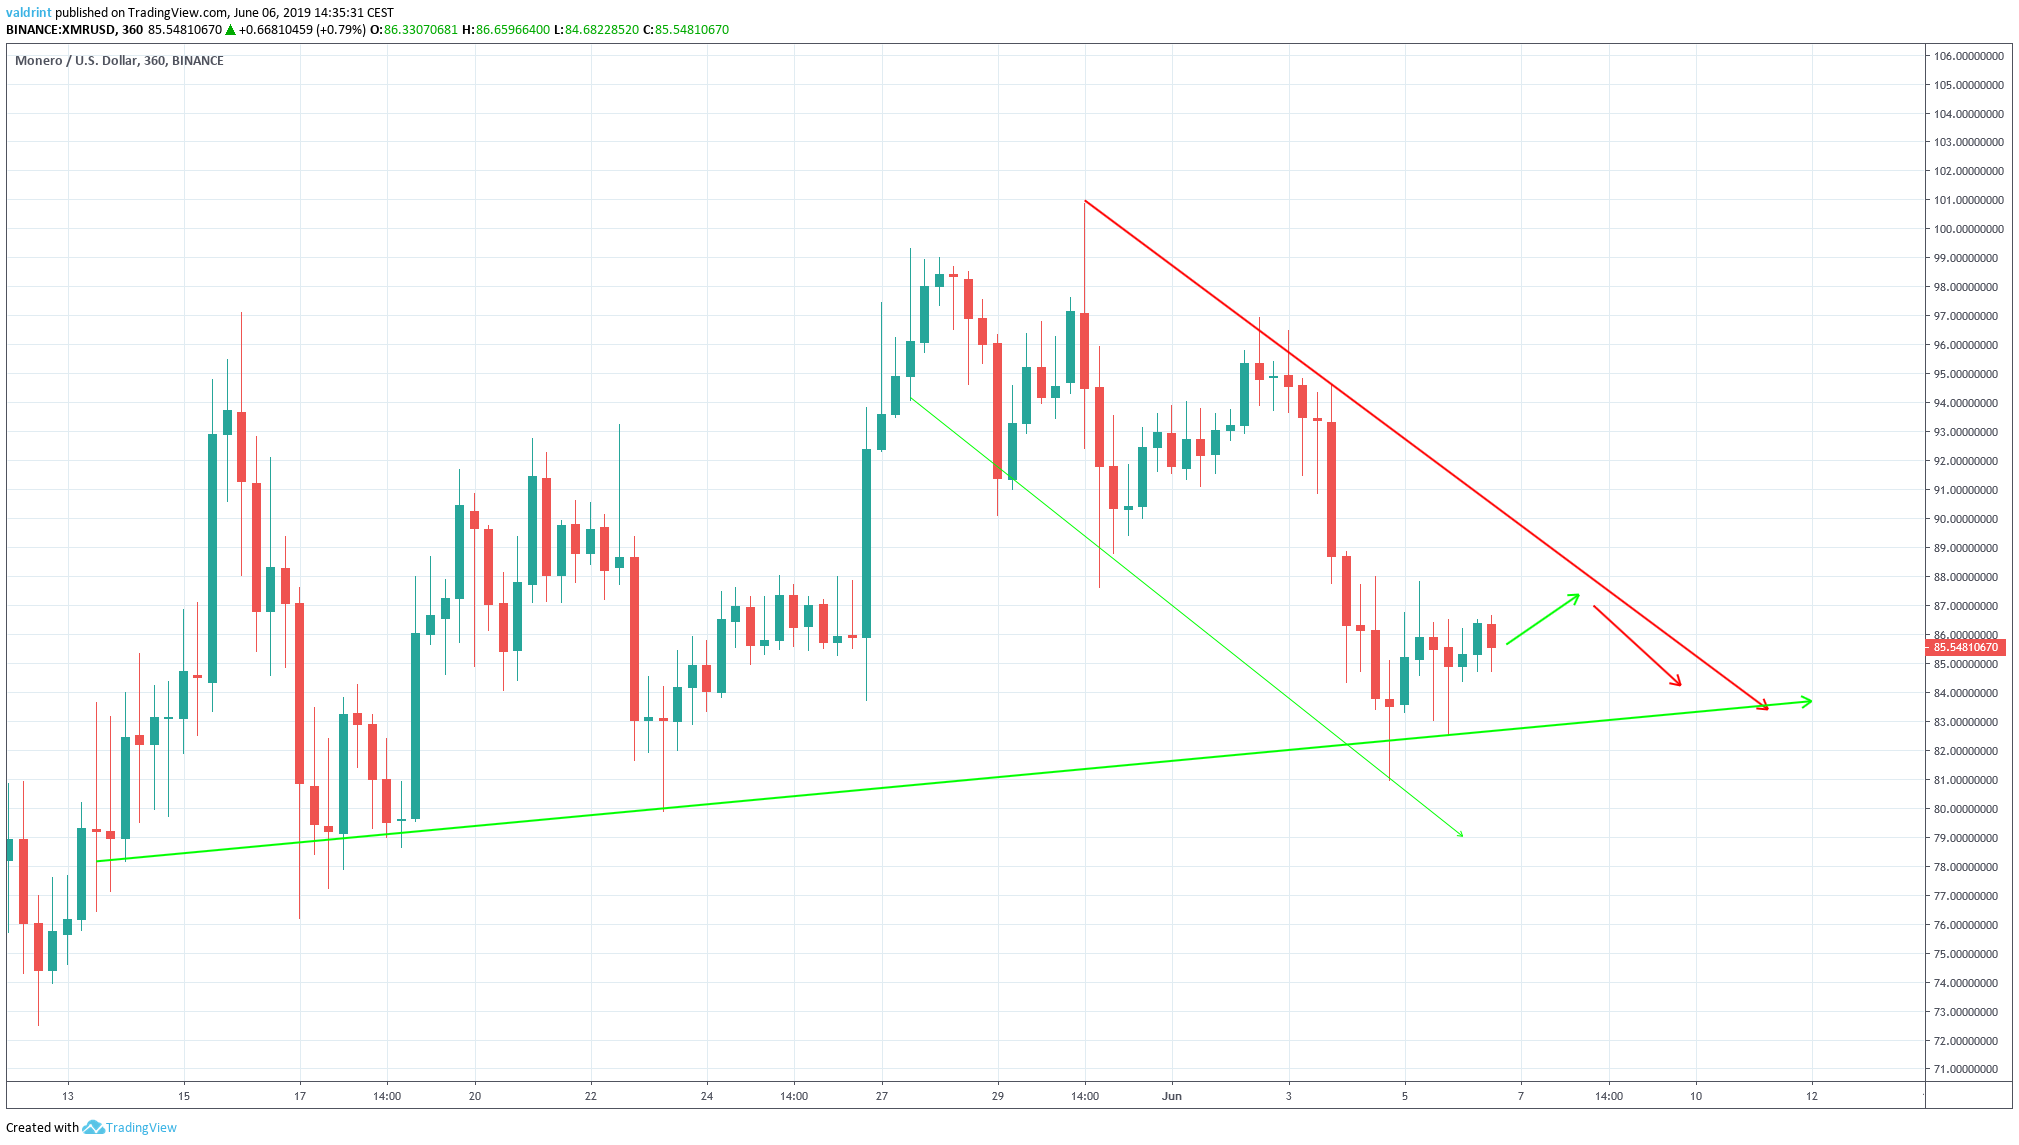
XMR Price: Support Areas
One support area is shown below for XMR/USD:
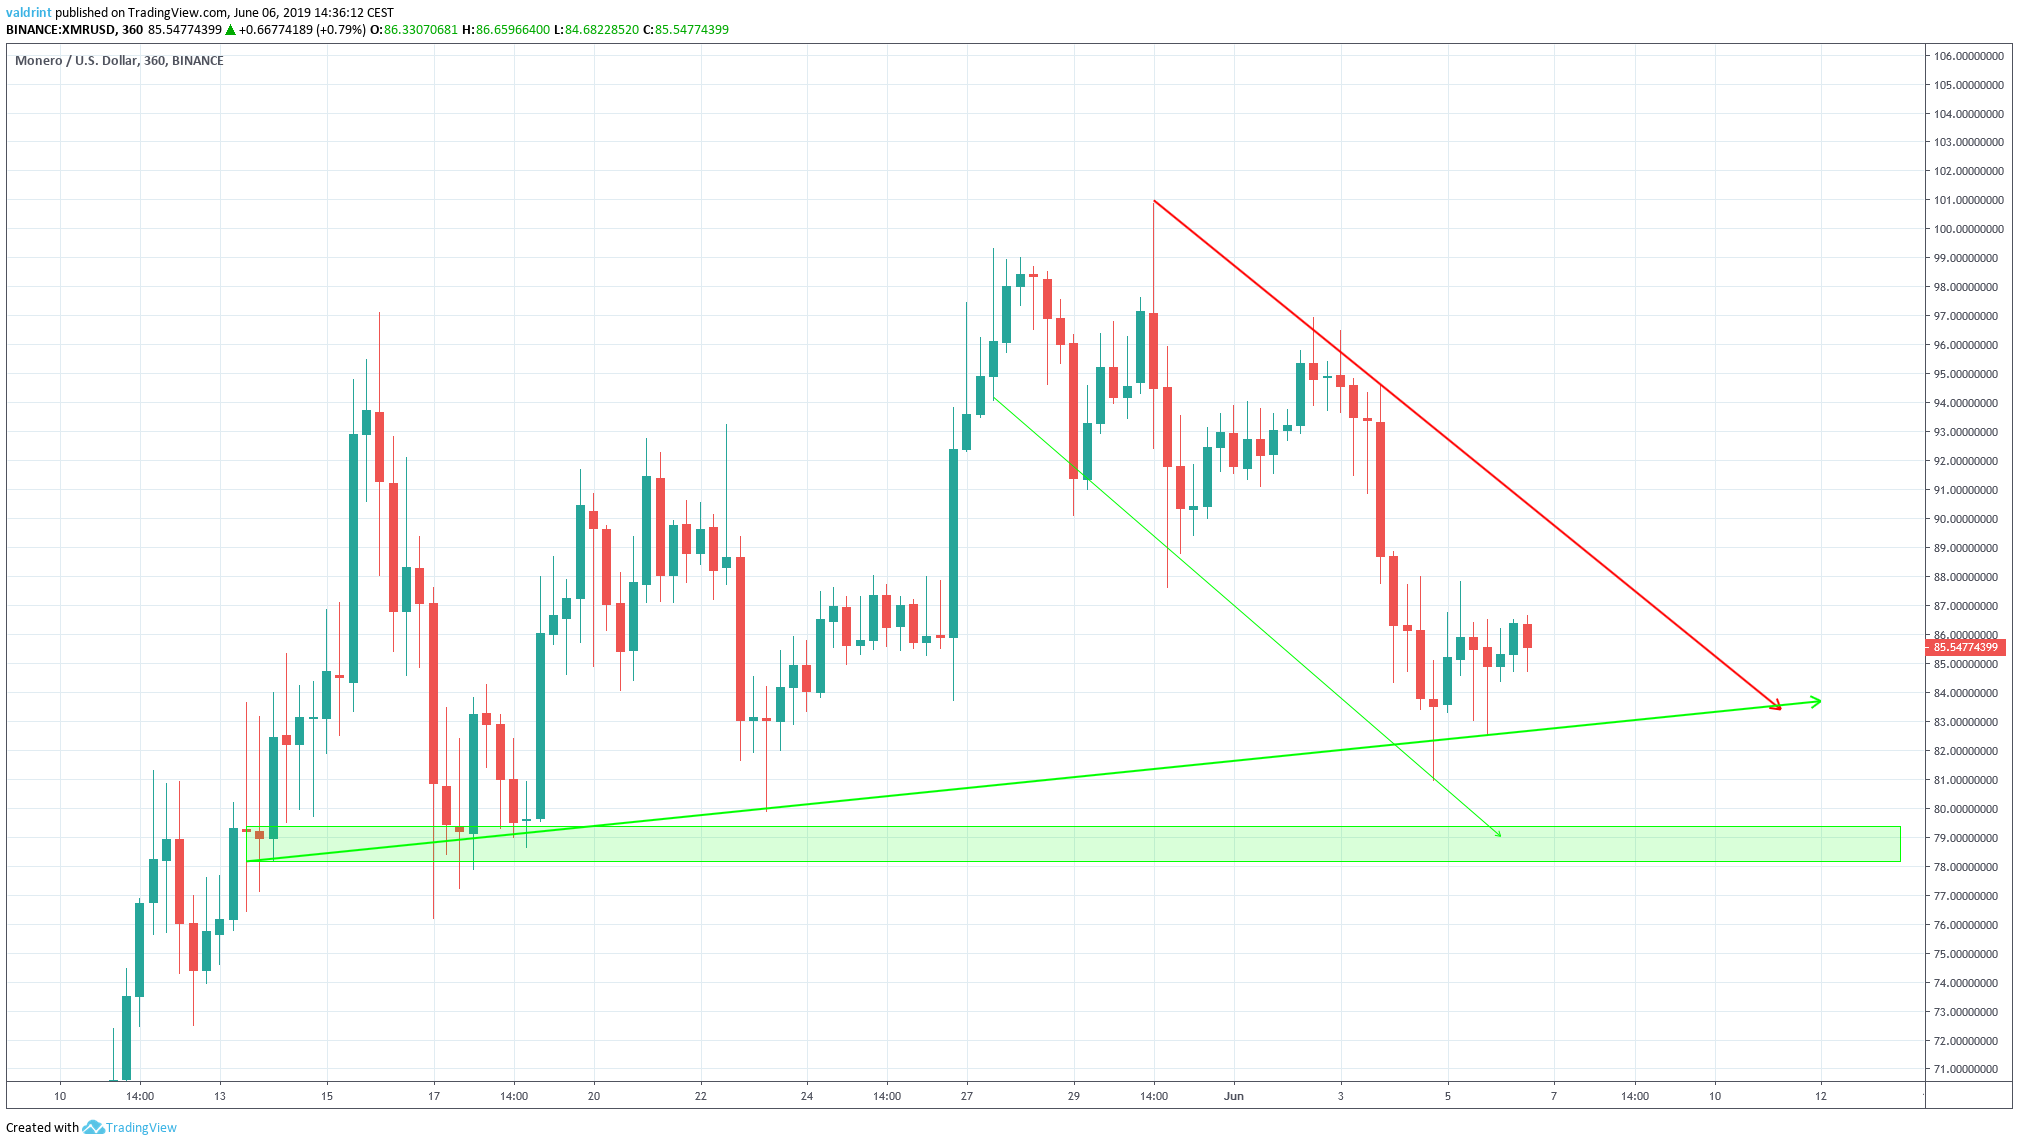
The closest support area is found near $79. If the Monero price breaks down from the support line, it is likely to provide a reversal.
Summary
The XMR price reached a high on May 30 and has been trading inside a descending channel since. The formation of candlesticks with long lower wicks indicates that there is significant buying power near $82. The analysis of technical indicators supports price movements inside the channel without significant fluctuations.
Do you think the Monero price will continue to trade inside the channel? Let us know your thoughts in the comments below.
Disclaimer: This article is not trading advice and should not be construed as such. Always consult a trained financial professional before investing in cryptocurrencies, as the market is particularly volatile.
