


Key Highlights For March 7, 2019.
- Price reached a swing high of $50.79 on Mar 5.
- A gradual drop ensued.
- The swing low was made at $49.41.
- It is trading inside an ascending parallel channel.
- There is resistance near $52 and $54.
- There is support near $50 and $48.
Tracing The Support
The price of Monero (XMR) on Binance was analyzed at 30-minute intervals from Mar 5 to Mar 7.
The price of XMR started an upward move on Mar 5. It reached a high at $50.79. A gradual drop preceded successive higher lows.
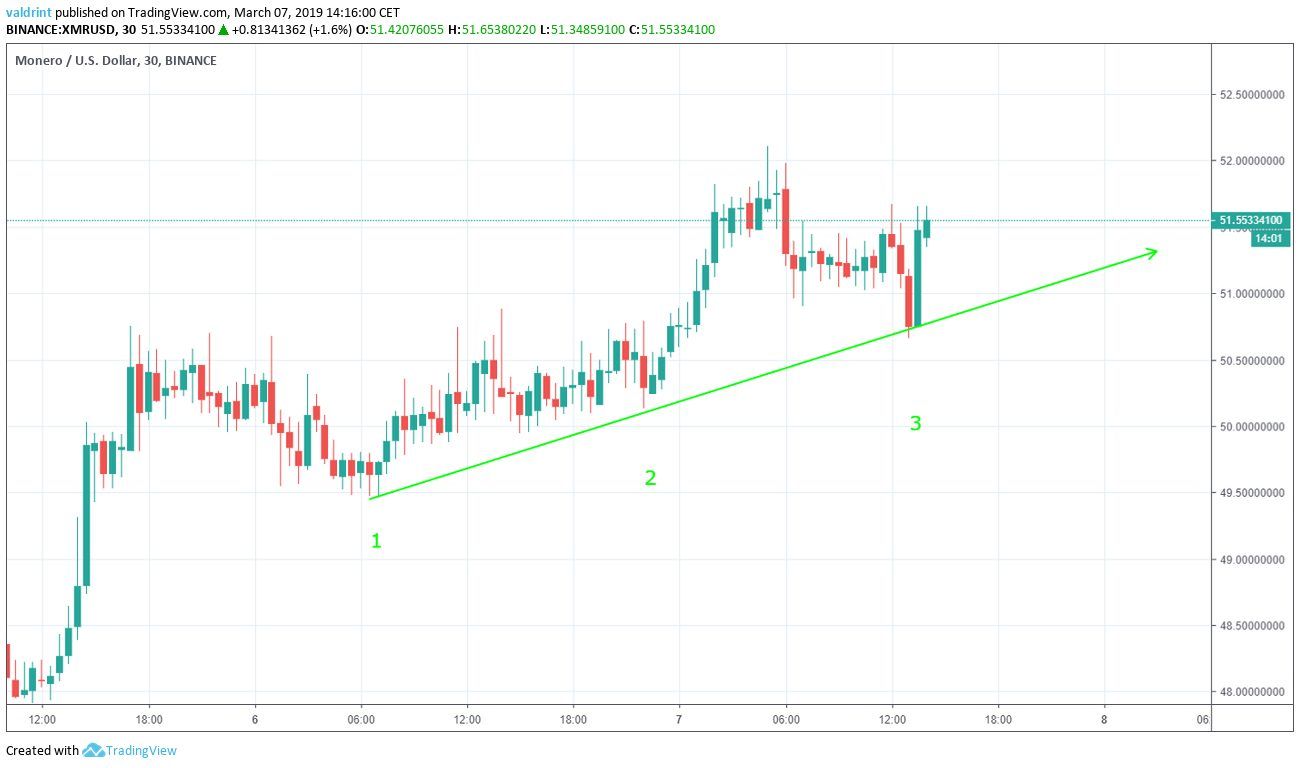
The resistance line is created by tracing these lows. The line was touched on these dates:
- Mar 6 (twice)
- Mar 7
The support line can act as a floor for price, effectively preventing it from dropping below a certain level and supporting further growth. However, a break below could trigger a rapid price decrease.
Movement In A Range
The price reached a high of $50.79 on Mar 5. It reached a higher high of $52.14 on Mar 7
Tracing these highs creates an ascending resistance line.
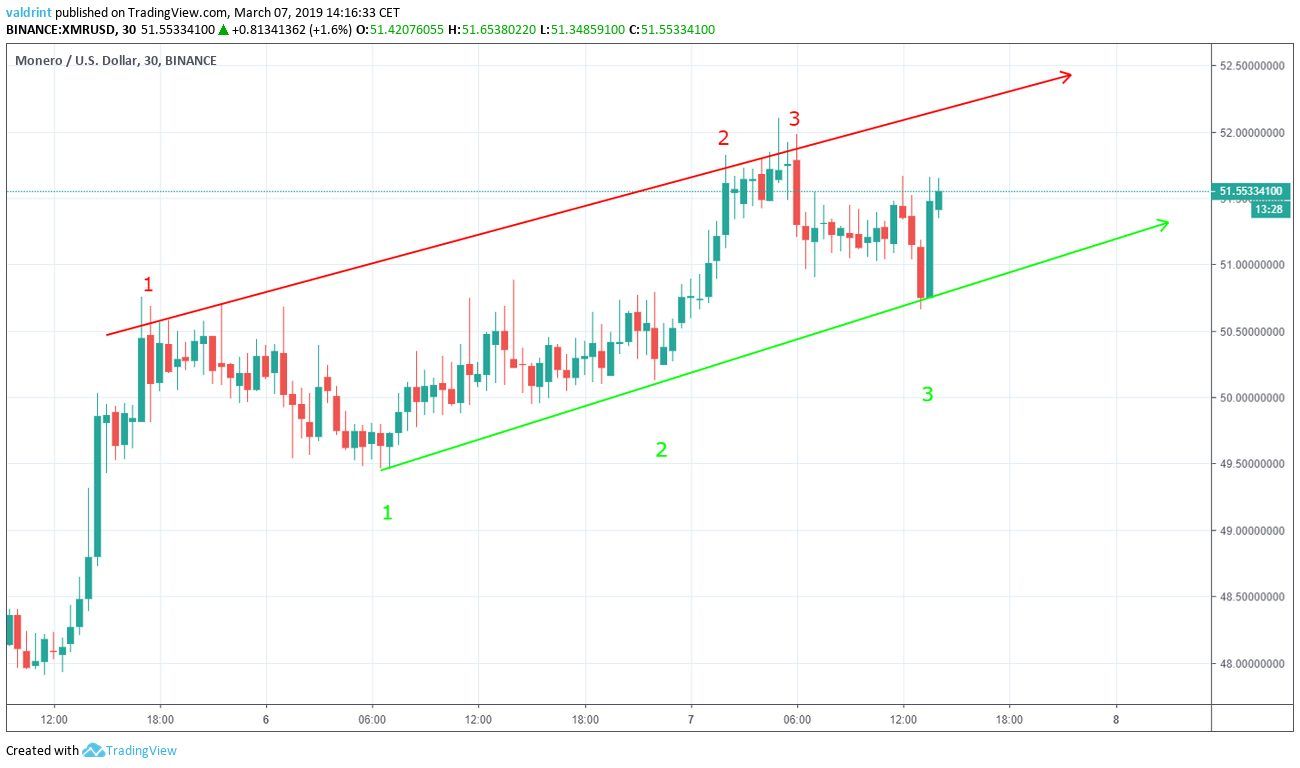
The dates in which the line was touched are:
- Mar 5
- Mar 7 (twice)
The resistance and support lines combine to create an ascending parallel channel.
The channel aims to reduce the scope of price movements and keep it inside a range. However, if price moves outside of the channel for an extended period of time, new support and resistance levels may develop.
The ascending parallel channel is a neutral pattern, making a breakdown and breakout equally likely.
Possible Reversal?
The moving average convergence divergence (MACD) is a trend indicator that shows the relationship between two moving averages (long and short-term) and the price. It is used to measure the strength of a move. The relative strength index (RSI) is an indicator which calculates the size of the changes in price in order to determine oversold or overbought conditions in the market.
Combining MACD and RSI bullish/bearish divergence with support/resistance essentially predicts price fluctuations. If both indicators are in agreement, they can be used to further add validity to the divergence analysis
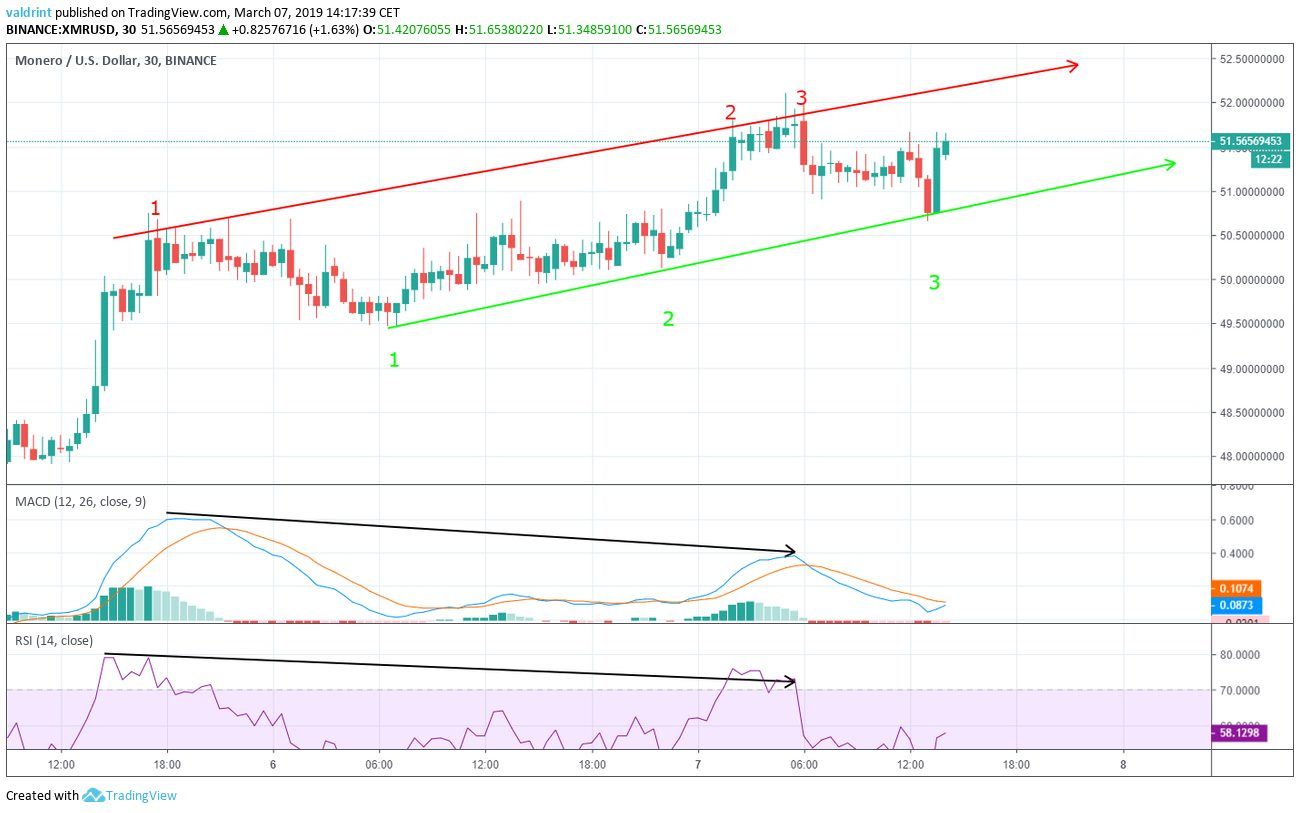
The price made a high on Mar 5. It made two higher highs on Mar 7. Similarly, the MACD and RSI both made a high on Mar 5. However, lower highs were reached on Mar 7.
This is called bearish divergence. It often precedes drops in price.
The prediction can be especially accurate if bearish divergence occurs in a bearish pattern and vice versa. This is not the case here, since Monero is trading in a neutral pattern.
Likely Areas Of Reversal
The price of XMR on Binance is analyzed on one-hour intervals from Feb 20 to Mar 7.
Resistance and support areas are formed when the price reaches a certain level several times. They can act as a ceiling/floor that prevents the price from moving further in that direction.
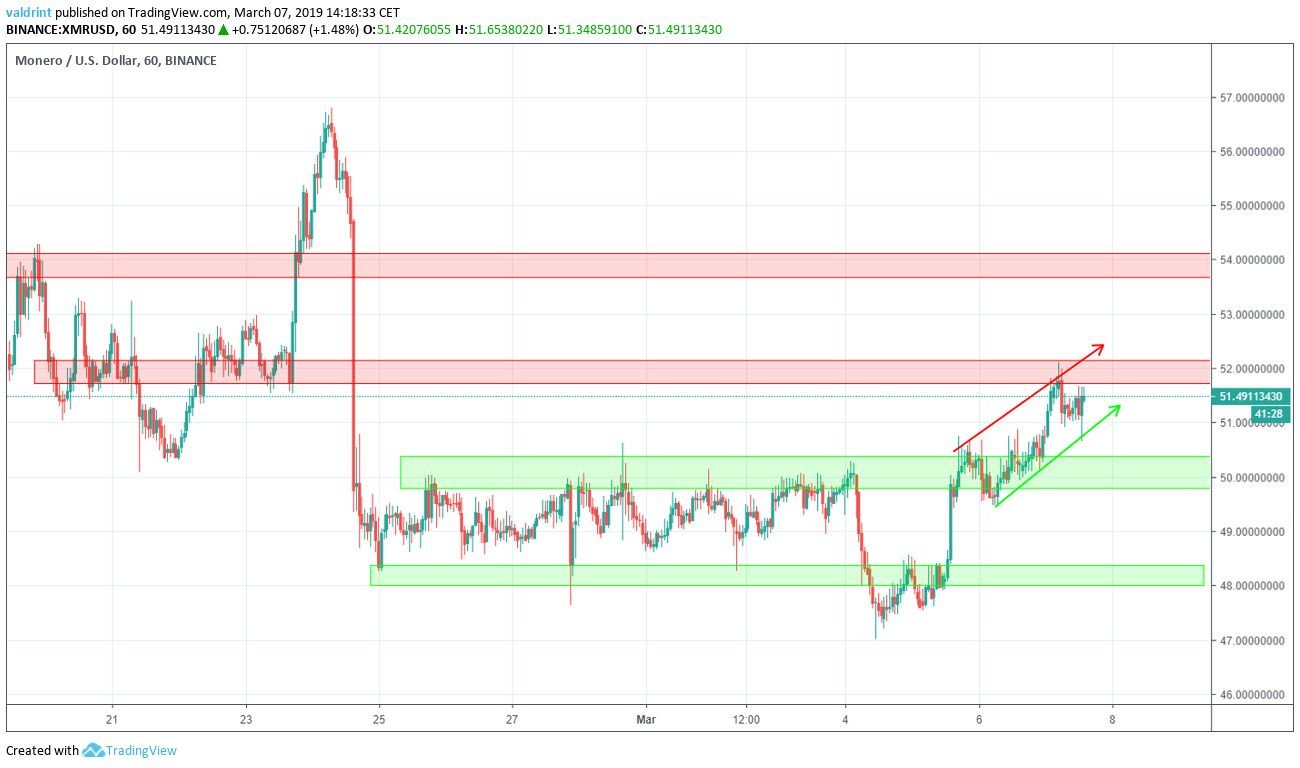
The first resistance area is found near $52. It corresponds with the top of the channel.
The second resistance area is found near $54. If price were to break out of the channel, this would be a likely area of reversal.
The first support area is found near $50. It corresponds with the beginning of the support line of the channel.
The second support area is found slightly above $48. If price were to break down from the channel, these two areas would be likely to provide a reversal.
Based on this analysis, a breakdown below support is more likely than a breakout above resistance. If the price reached the support area near $50, this prediction would be validated.
What do you think is in store for XMR? Let us know in the comments!
Disclaimer: This article is not trading advice and should not be construed as such. Always consult a trained financial professional before investing in cryptocurrencies, as the market is particularly volatile.


