$XMR
— Devchart 👨🏻💻 (@devchart) January 3, 2020
1D TF
A few days ago, @ChartAlertsIO sent a price approaching support on a daily with a huge decrease in volume (bullish bias).
The price bounced and pumped 10% and we just received an alert that it is approaching resistance again.
Follow @ChartAlertsIO #XMR#Monero pic.twitter.com/3zl06pDa0o
Long-Term Monero Outlook
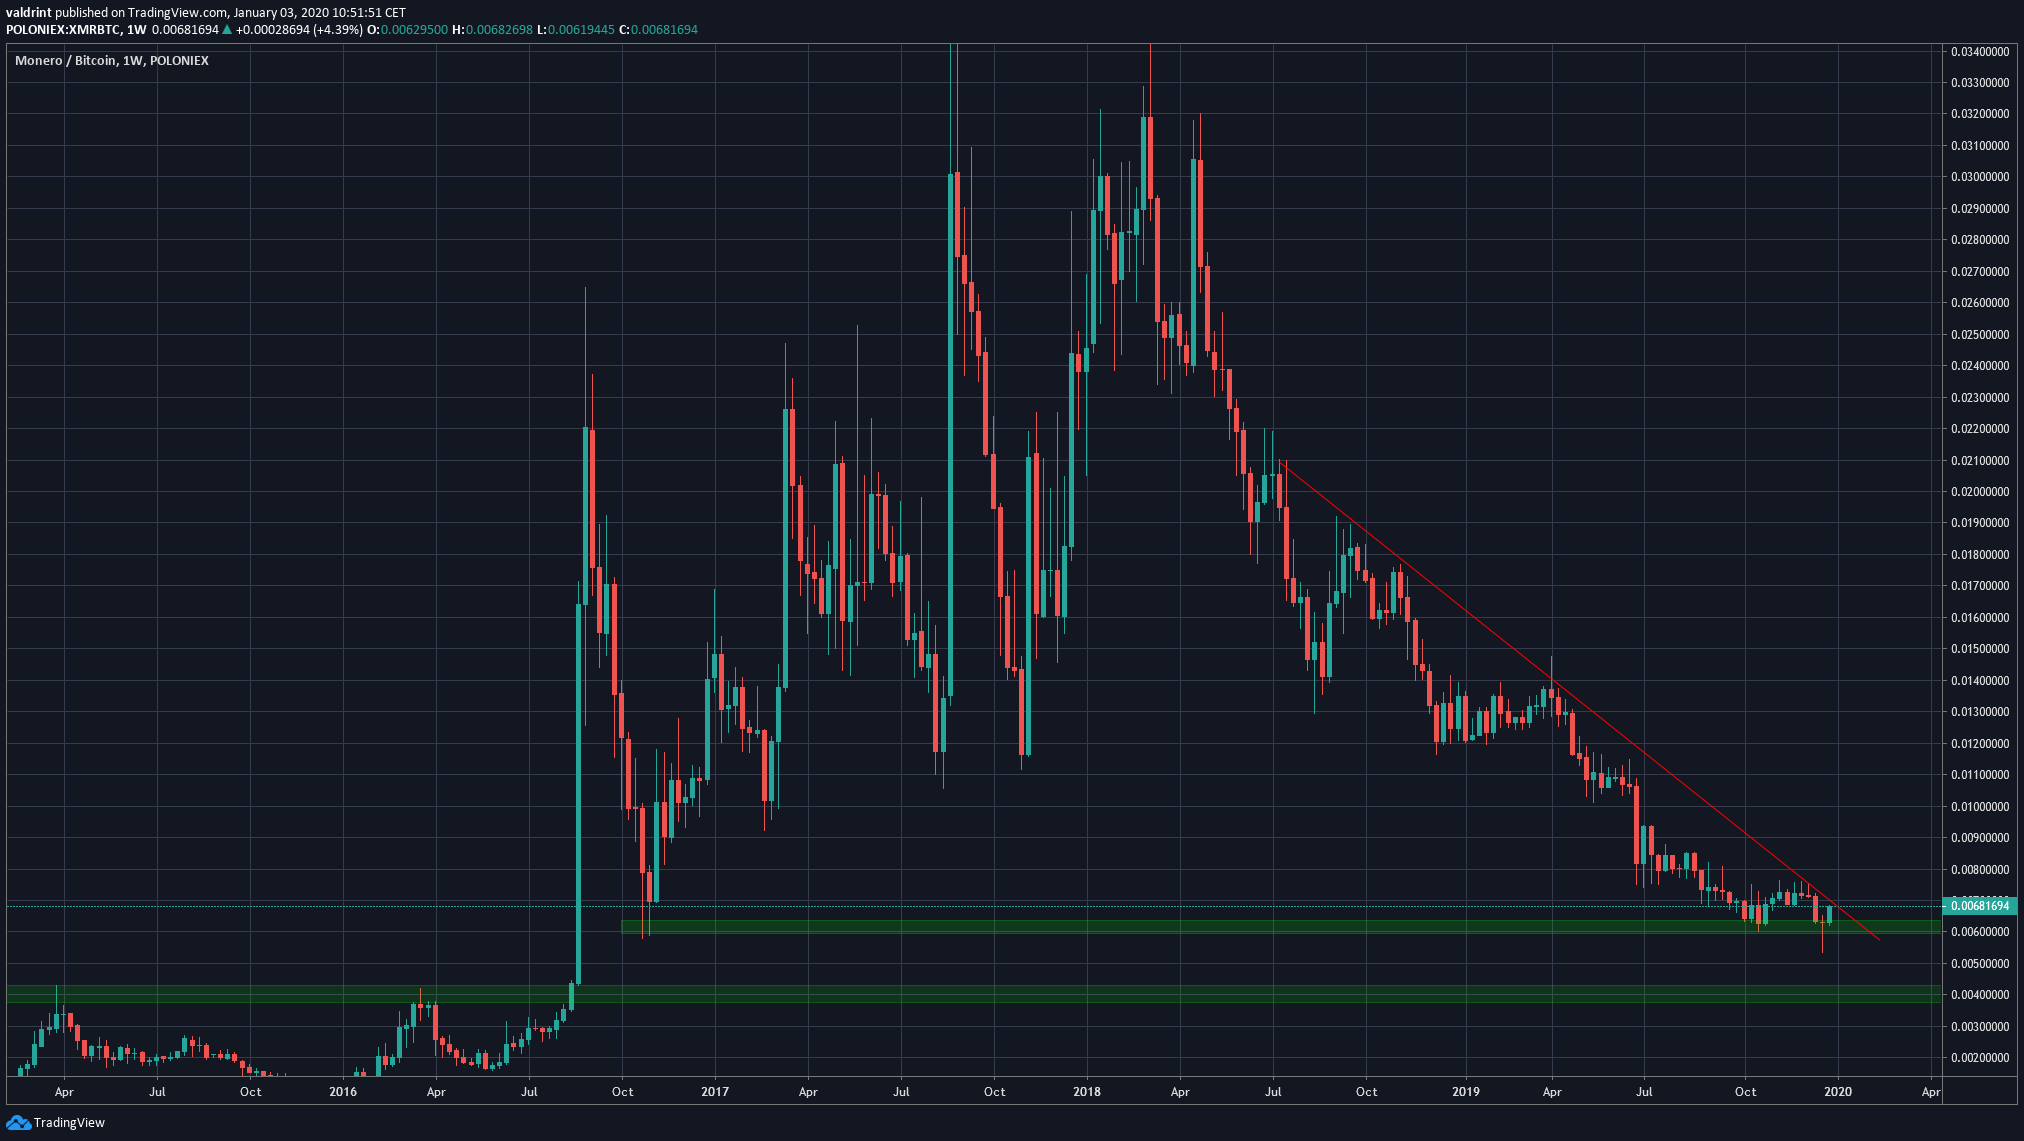
The weekly Monero chart shows that the price has been decreasing since April 2018 and following a descending resistance line since July of the same year. There are support areas at ₿0.006, where the price is currently trading and ₿0.004. When the price reached the former, it began a slight upward movement that is still ongoing. We discussed the long-term outlook in-depth in our previous analysis and suggested that if the ₿0.006 area holds, which has been the case, we could see a breakout and the beginning of a bullish upward movement that continues well into 2020.
Previous Breakout
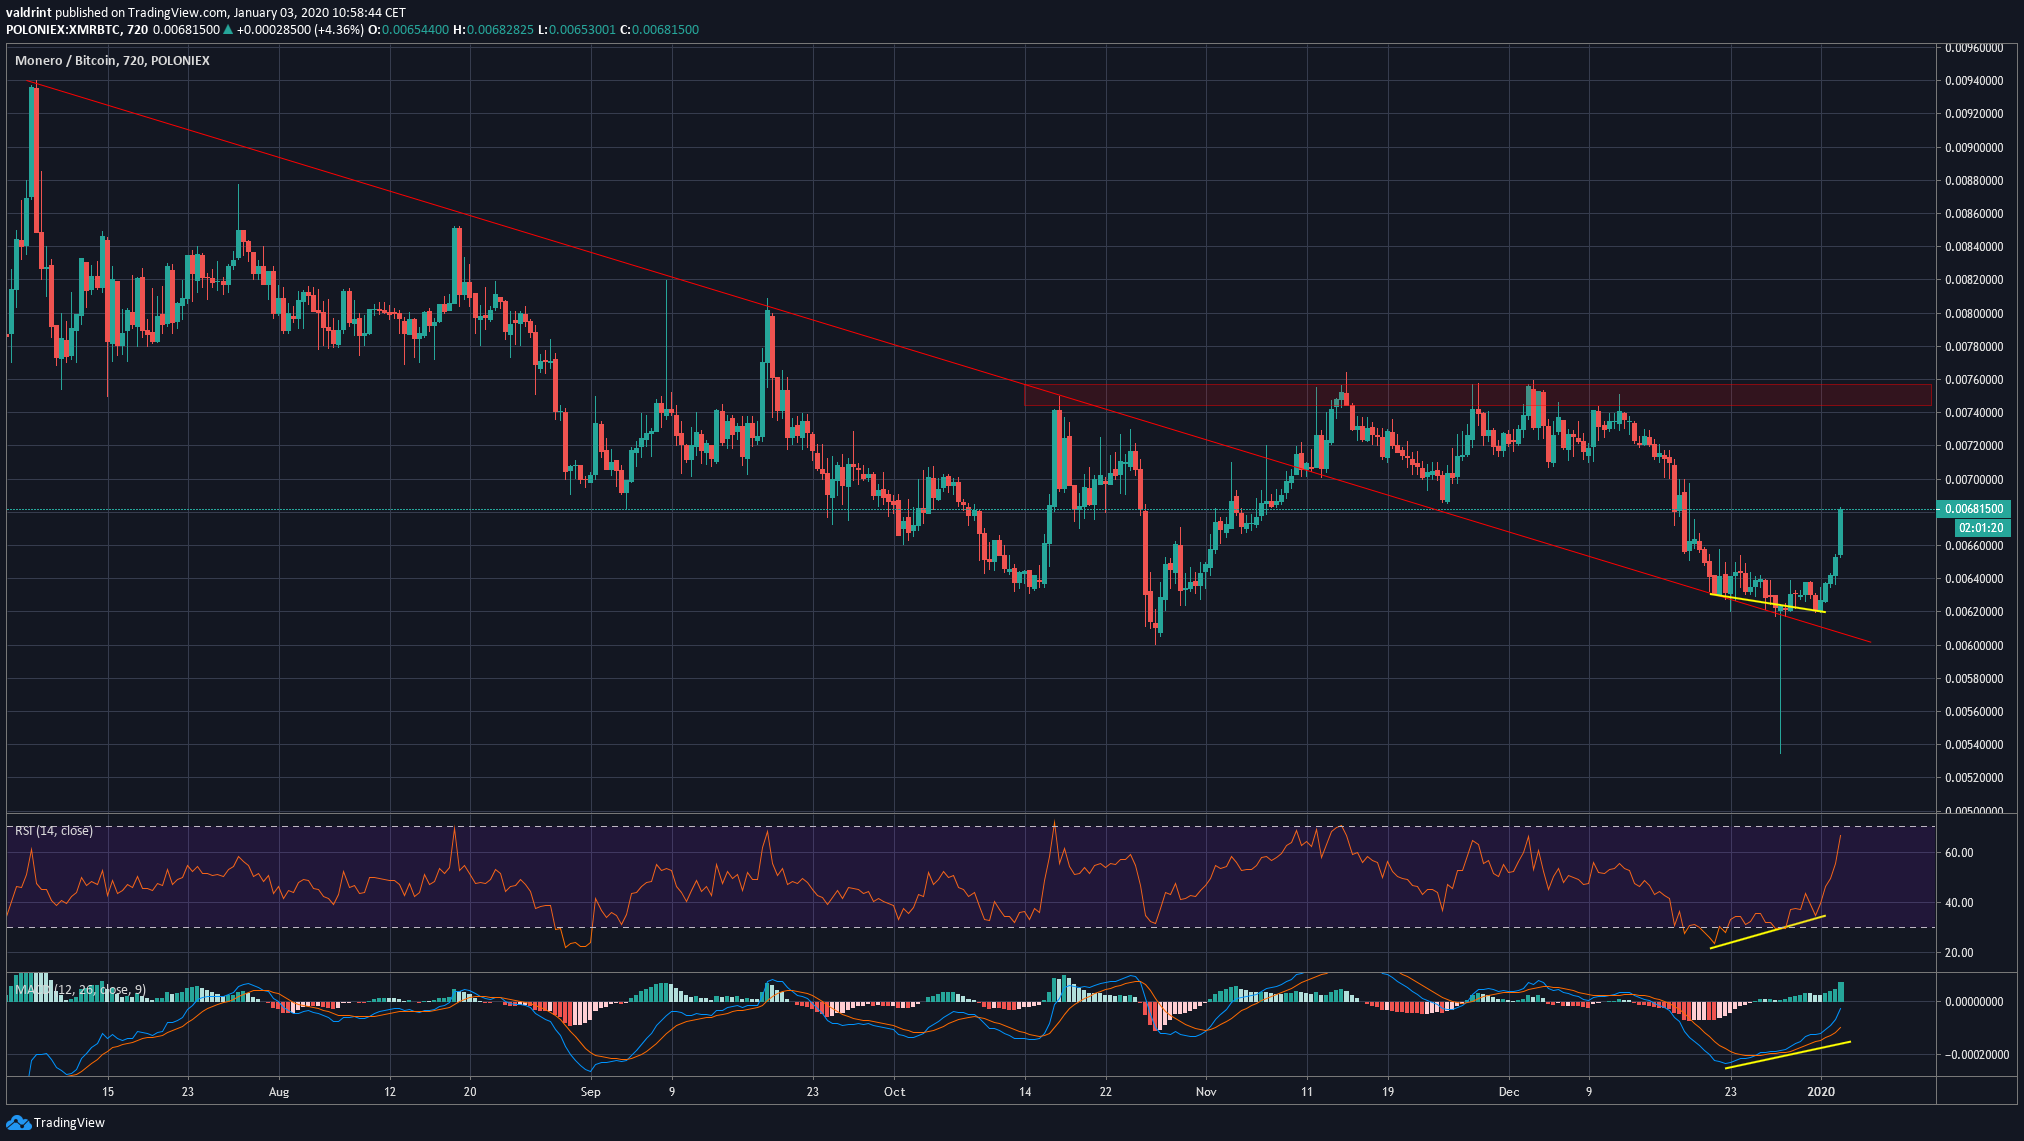
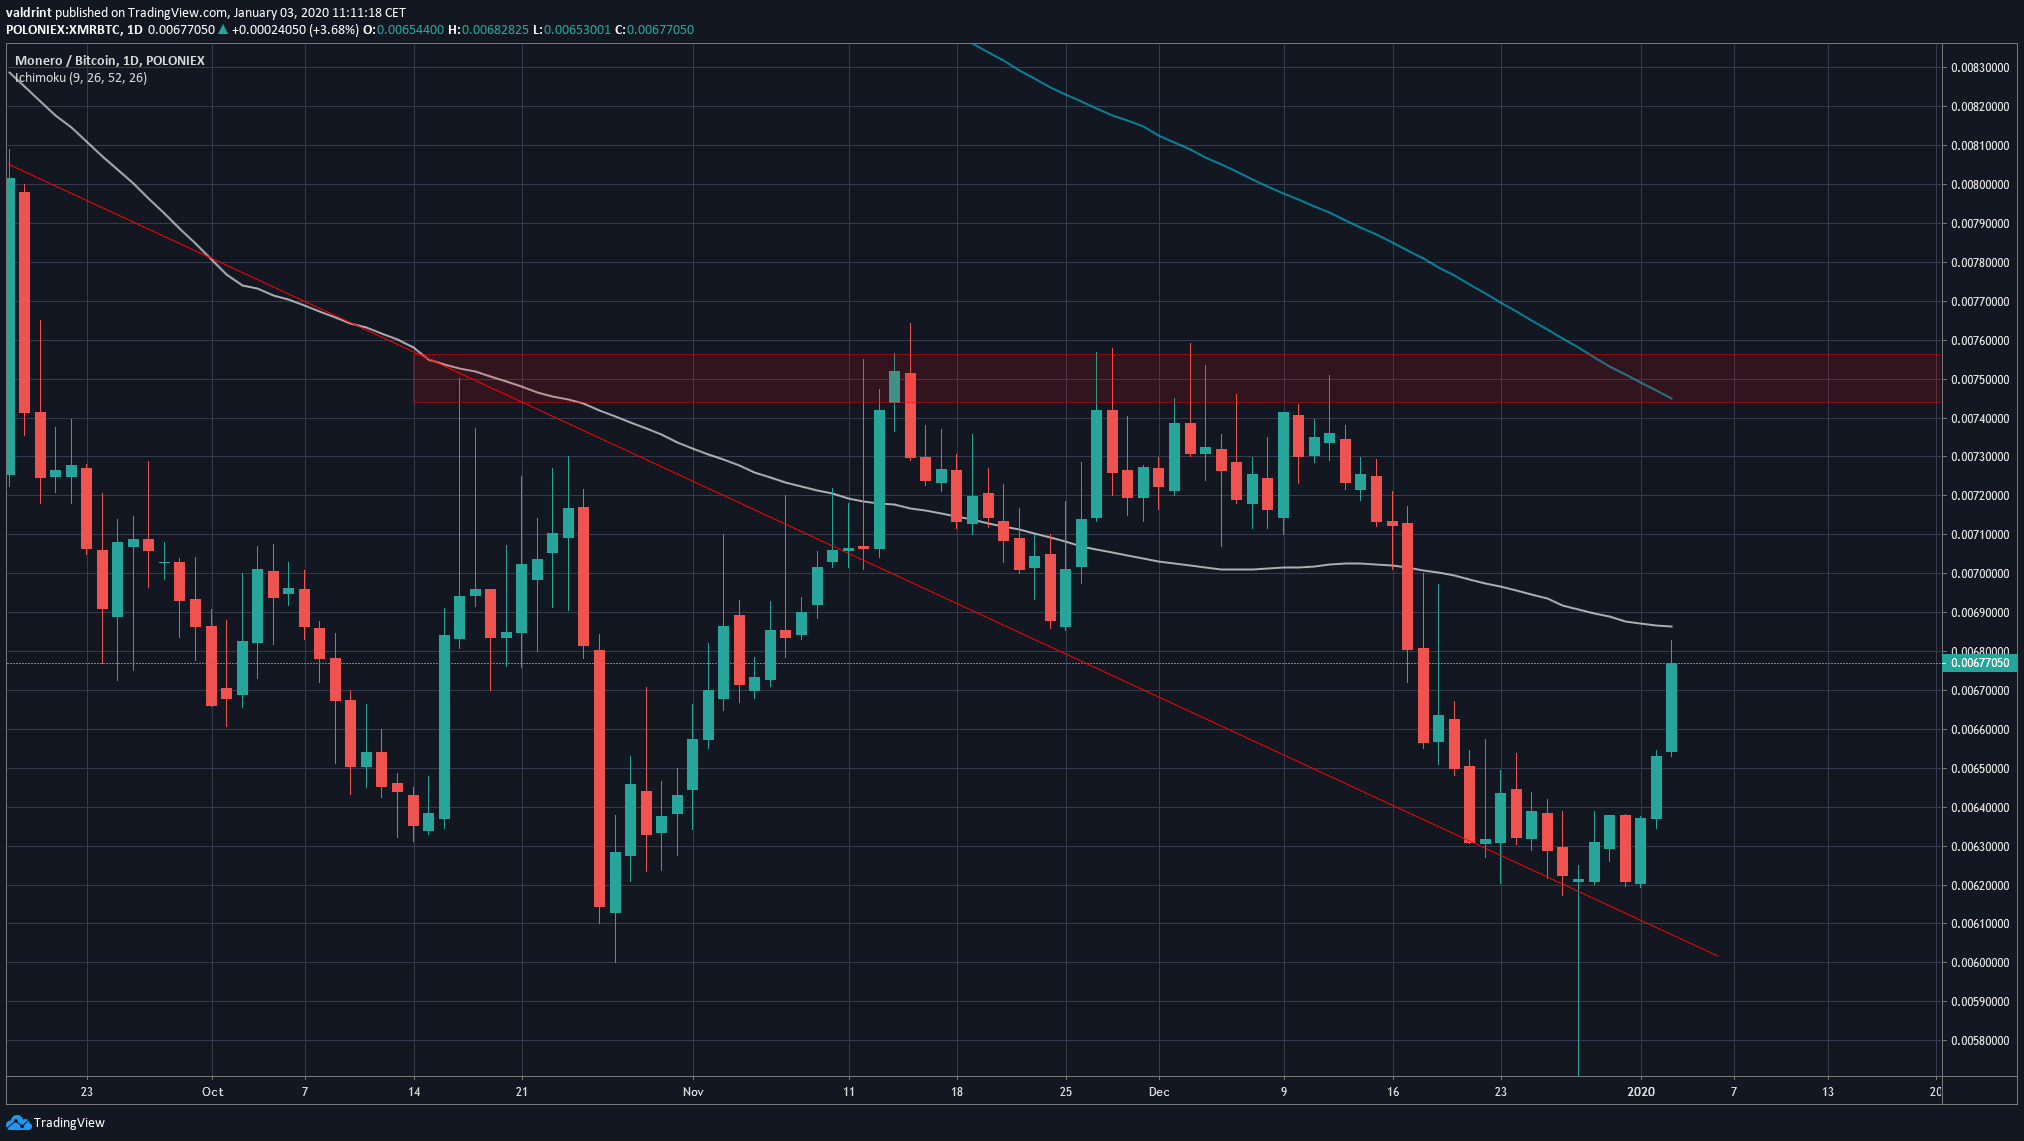
The XMR price had been following a descending resistance line since July. The price broke out in November but failed to move above the ₿0.0075 resistance area in three attempts before decreasing to validate the descending resistance line. Once the price got there, it created a strong bullish divergence in both the RSI and MACD before beginning the current upward movement. However, the price has yet to confirm that it has begun an upward movement. The rally stalled once the price reached the 100-day MA, and it has not even been close to the 200-day one. Additionally, the price has yet to make a higher low, which could act as a trendline for the possible upcoming movement.

Future Movement
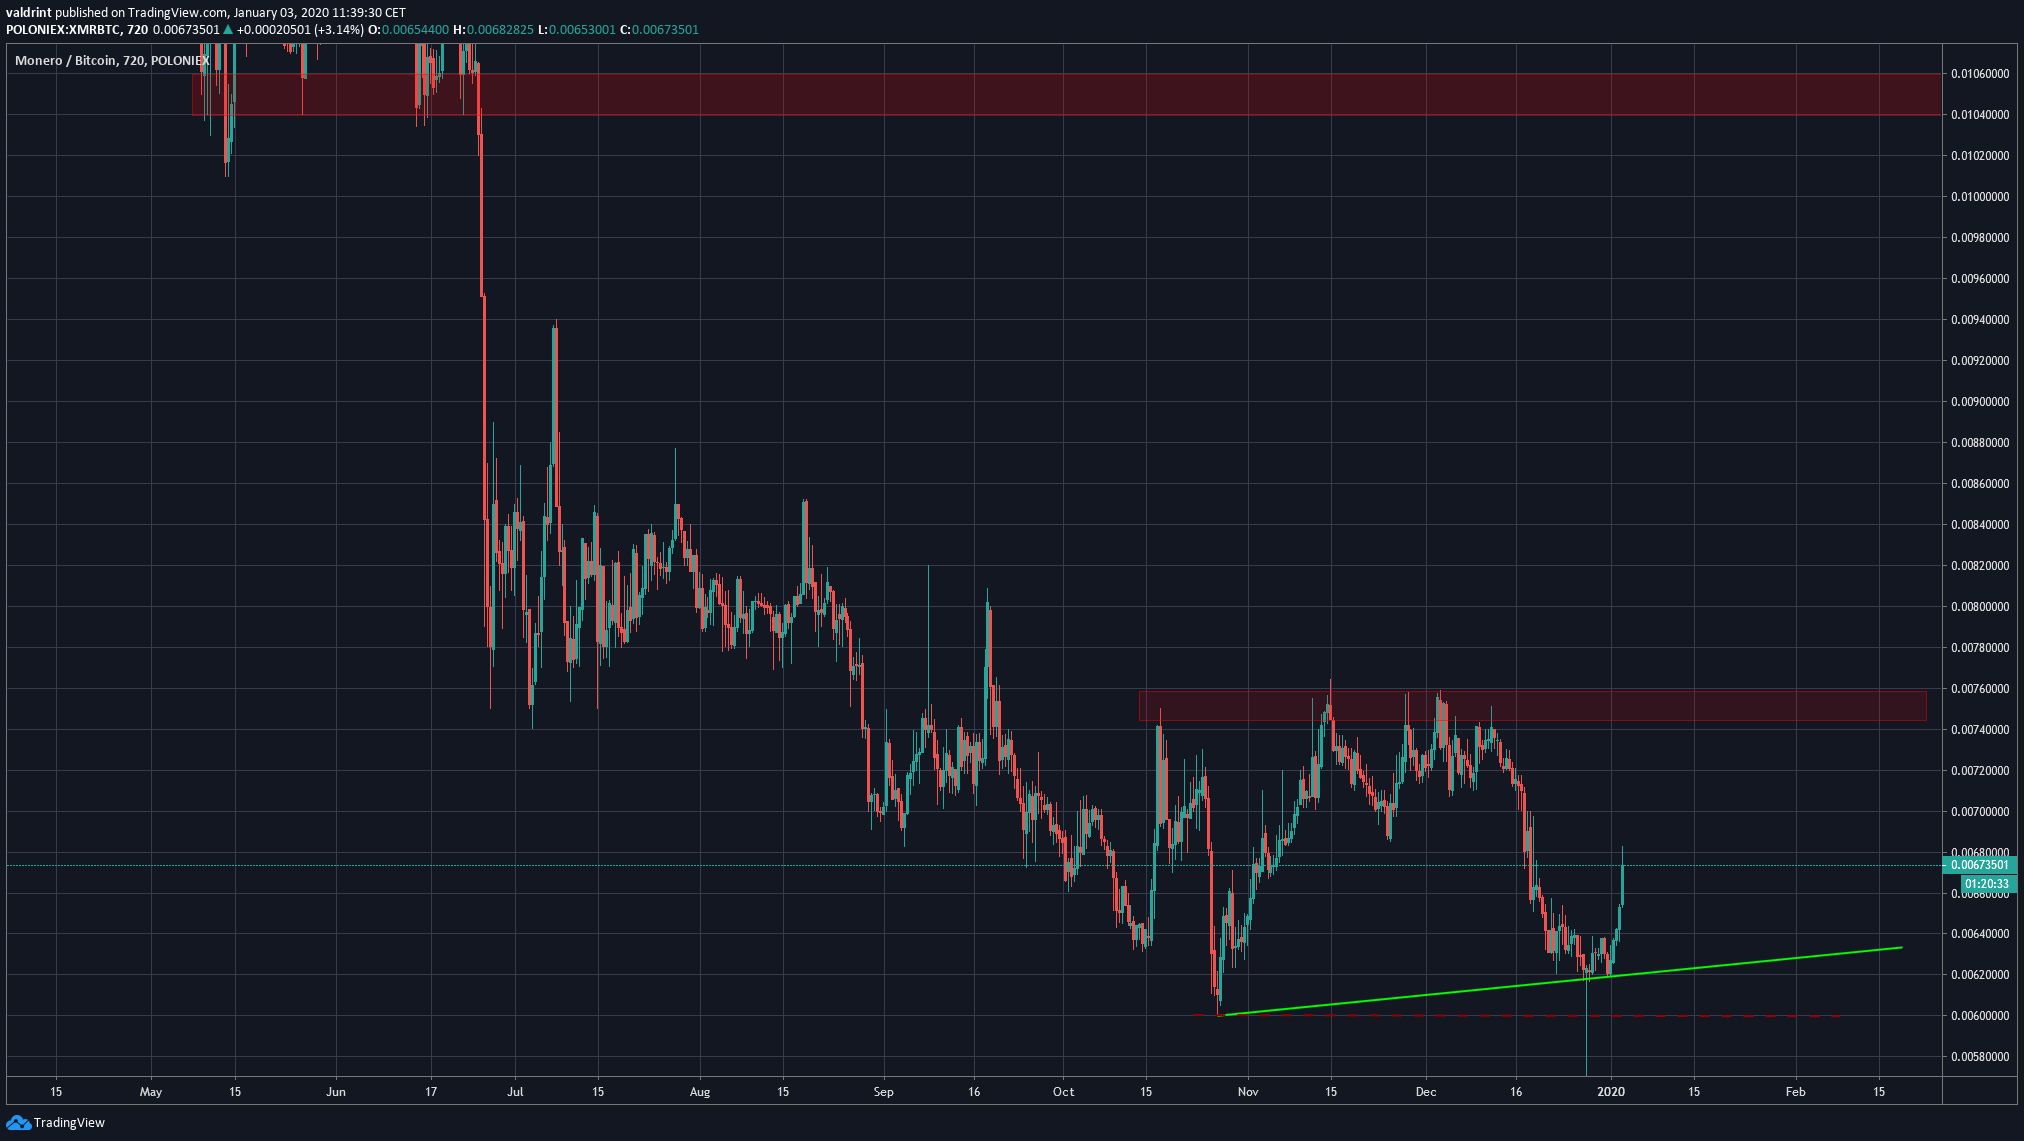
While the support line has yet to be confirmed, it is entirely possible that the XMR price has created an ascending support line, which combined with the resistance area creates an ascending triangle — a breakout from which would possibly take the price to the previous breakdown level at ₿0.0105. A stop-loss at ₿0.006 is recommended since, if the price decreases below this low, we would expect it to head towards ₿0.004. We are not giving a lot of importance to the wick low since it was not present in all exchanges. To conclude, the XMR price has reached a significant support area and initiated a bounce. However, until it breaks out above ₿0.0075, we are considering the current upward move a retracement rather than the beginning of a new upward move. A breakout above the descending resistance trend-line would likely cause a rapid price increase.
Disclaimer
In line with the Trust Project guidelines, this price analysis article is for informational purposes only and should not be considered financial or investment advice. BeInCrypto is committed to accurate, unbiased reporting, but market conditions are subject to change without notice. Always conduct your own research and consult with a professional before making any financial decisions. Please note that our Terms and Conditions, Privacy Policy, and Disclaimers have been updated.


