


On January 3, the Monero (XMR) price broke out above a descending resistance line that had been in place for 541 days.
While a short-term retracement towards ₿0.0069 could occur, the price is expected to resume its upward movement soon and eventually reach the ₿0.0115 resistance area.
Margin trader Crypto Krillin (@LSDinmycoffee) tweeted an XMR price chart, stating that the price is in the process of retesting the previous resistance level. If successful, the upward move is expected to continue.
Here comes the retest….
It better hold or that will be really disappointing 🙁 pic.twitter.com/ebHo13szfs
— krillin ॐ (@LSDinmycoffee) January 16, 2020
Will the rally continue? If so, what is the likeliest target for the future price? Let’s take a closer look at the price movement and reach a verdict.
Monero Resistance Area
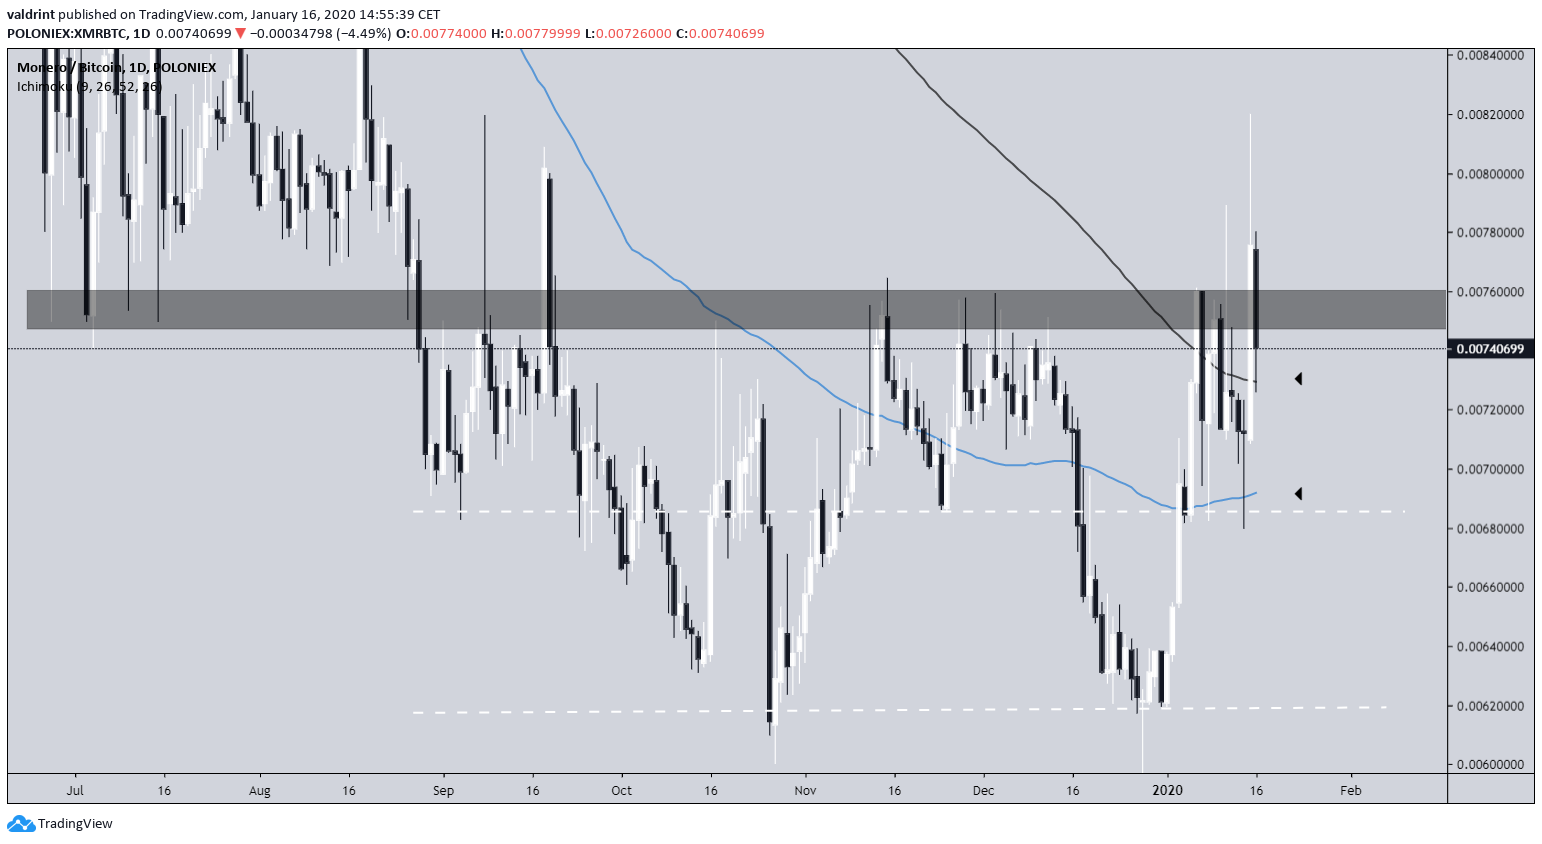
The presently significant resistance area is found at ₿0.0075. While the price reached a high of ₿0.0082 yesterday, it failed to close above the area with determination. At the time of writing, it was in the process of falling below this area once more.
However, the price has seemingly found support above the 200-day moving average (MA). If it manages to hold on to it and begin an upward move that closes above the resistance area, we can safely assume that the price has cleared its overhead resistance.
But, the more bearish scenario has the price falling toward the middle of the range at ₿0.0069, finding support at the 100-day MA. Since the MA is rising, it could soon initiate a bullish cross with the 200-day one.
Therefore, while the worst-case scenario has the price decreasing all the way to ₿0.0069, it is likely to eventually break out.
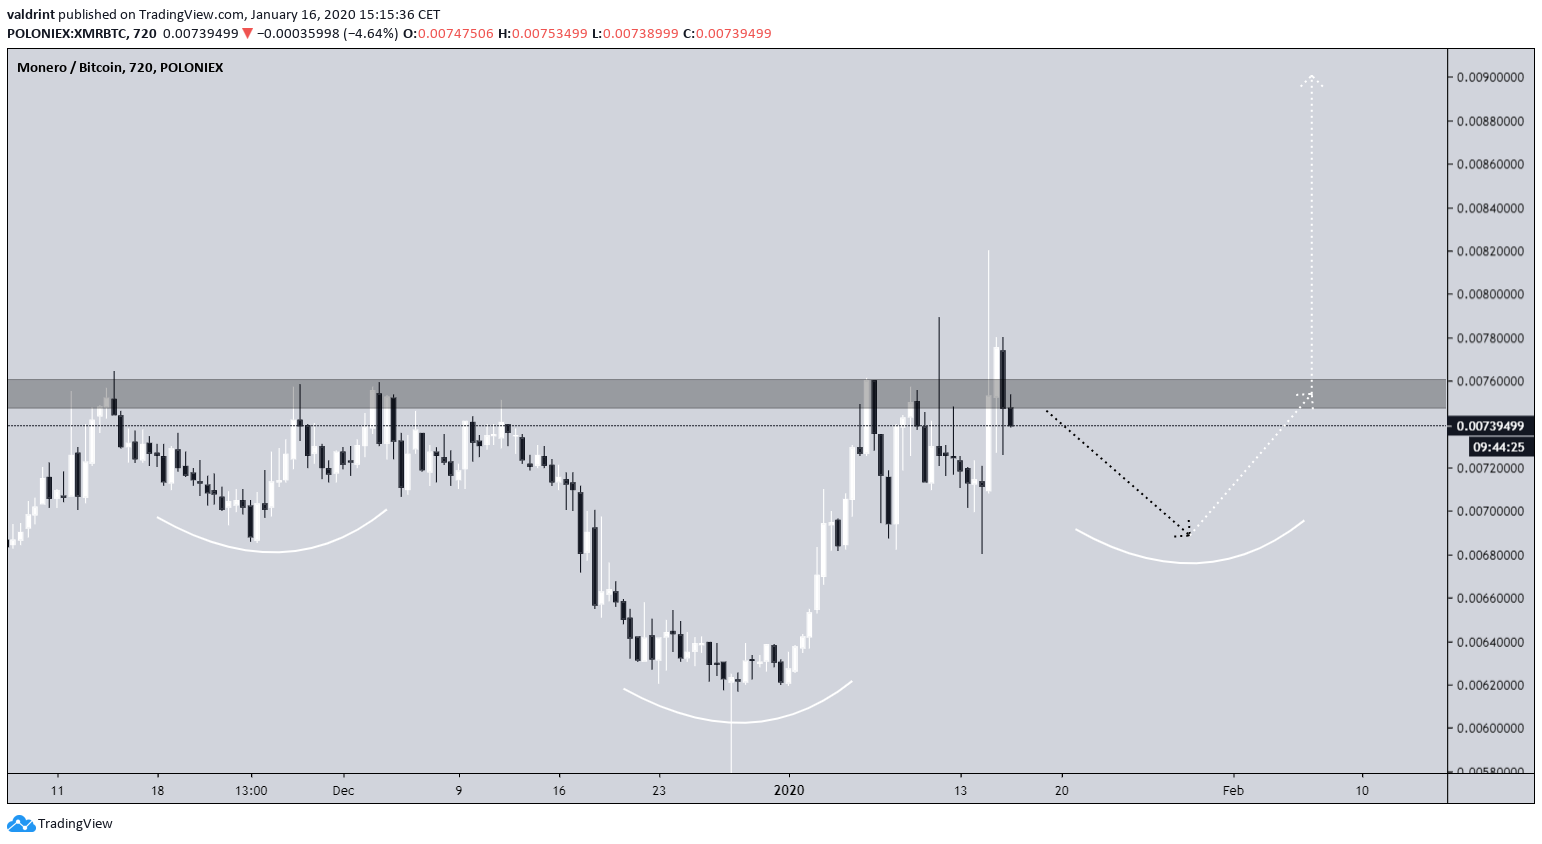
The second scenario could complete an inverse head and shoulders pattern. While the price has completed what looks like the left shoulder and the head, a decrease towards ₿0.0069 could complete the right shoulder, after which a breakout is likely.
During the formation of the head, we predicted the ensuing upward movement in our previous analysis.
Long-Term Movement
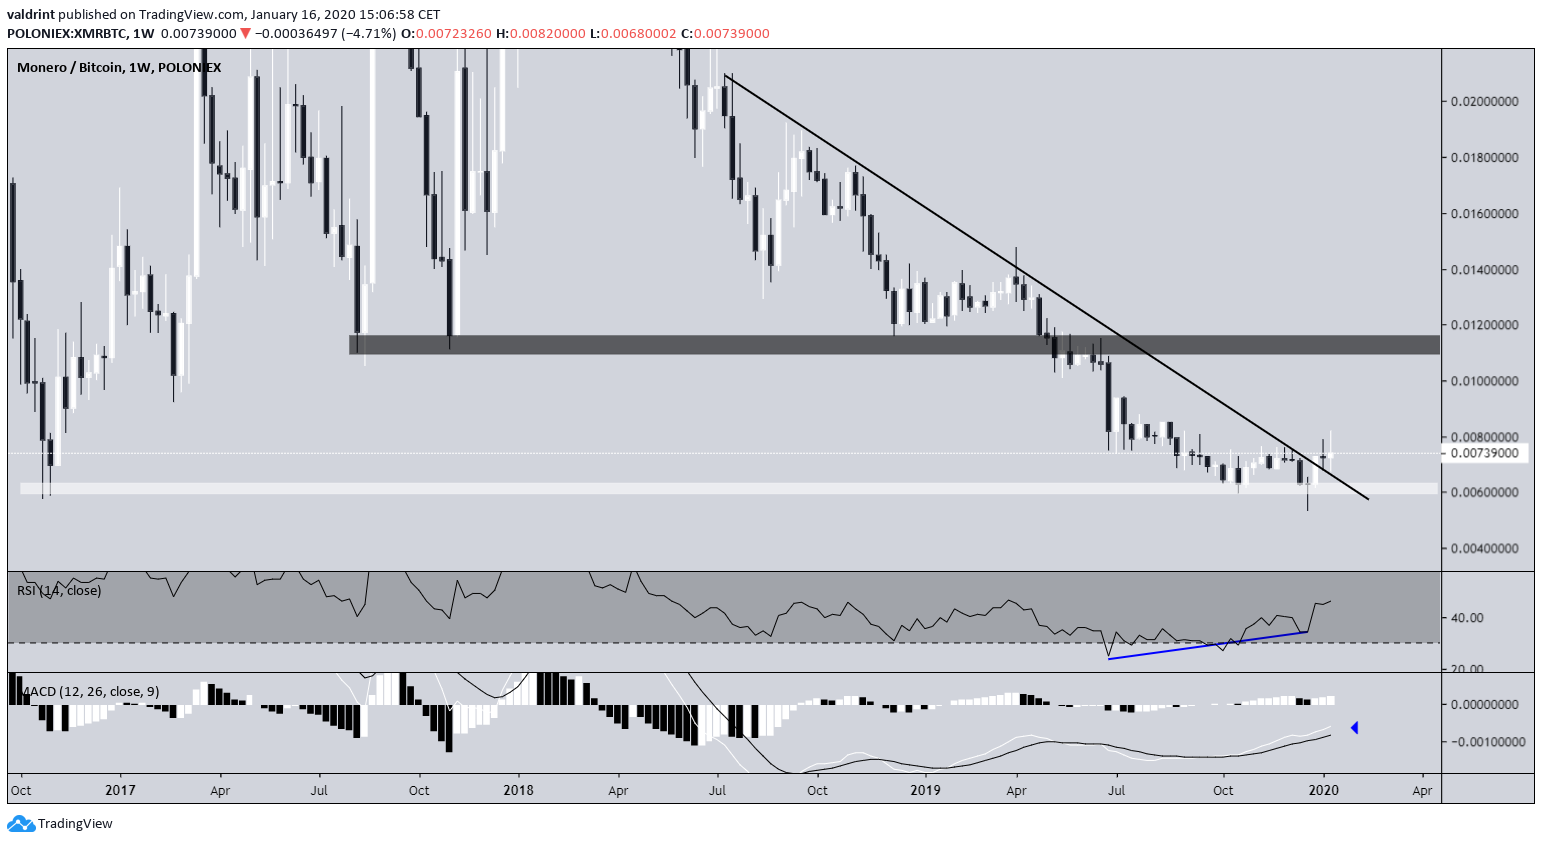
The weekly chart suggests that a long-term upward trend is more likely. The Monero price had been following a descending resistance line since July 2018 and finally broke out last week. The breakout was preceded by a very significant bullish divergence in the weekly RSI. Furthermore, the MACD is very close moving above the 0 line, confirming that the upward trend has begun.
The most important resistance area is found at ₿0.011, which serves as the breakdown level. Once the price decreased below this level in July 2019, the rate of decrease was greatly accelerated.
To conclude, the Monero price is in the process of validating a previously significant resistance area as support. It is trading above important long-term moving averages (MA) and has broken out above a long-term resistance line. A continued increase could take the price as high as ₿0.0115.
