
Monad’s MON token had an unusually strong launch. It jumped more than 35% within a day, even though most new airdrop-led TGEs fall quickly in weak markets. But the early excitement is slowing.
Possible selling from airdrop claims, reduced perp exposure, and soft volume now put short-term pressure on the Monad price prediction chart.
With almost no long-term history, MON still trades in launch conditions, so short-term signals matter more than usual.
Perp Traders Turn Bearish?
Perpetual positions are the cleanest early signal for MON because most fresh liquidity flows through perps during the first days of trading. These moves often lead the Spot price, especially when volatility is high.
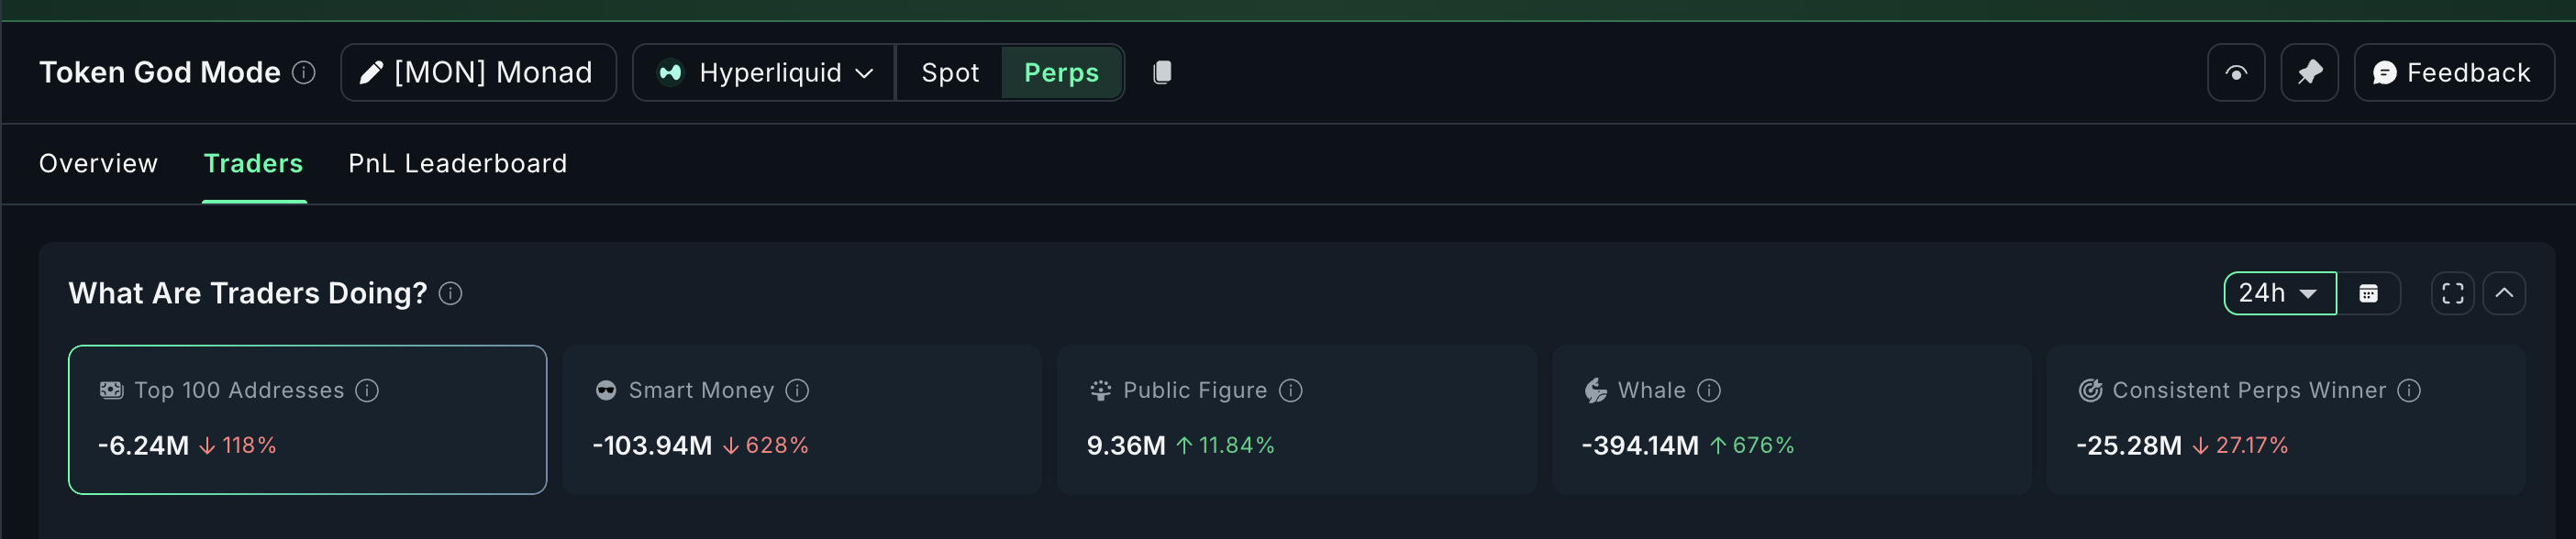
In the past 24 hours, the bias has turned bearish.
Top 100 addresses or mega whales cut net long exposure, a 118% drop, which shows they are closing long positions faster than before. A 118% drop means net long positions flipped negative, showing strong position cuts.
Smart Money remains in a negative position of $103.94 million (short-biased), a sharp 628% decline, which signals a strong bearish tilt from the most efficient traders.
Whales remained net negative, but they showed one positive shift with a 676% increase in long-side adjustments. This doesn’t flip the bias, but it reduces the downside weight slightly. Do note that despite the increase, the net whale positions are short-biased.
Want more token insights like this? Sign up for Editor Harsh Notariya’s Daily Crypto Newsletter here.
Together, these changes show that aggressive players are trimming upside risk while volatility stays high. That sets the tone for the rest of the price analysis.
Big-Money Flow Weakens on the 1-Hour Chart
Because MON launched on November 24 and has very little history, the one-hour chart is the best way to read early strength or weakness. Lower time frames matter more during these periods because order books are thin, liquidity is uneven, and each move creates outsized reactions.
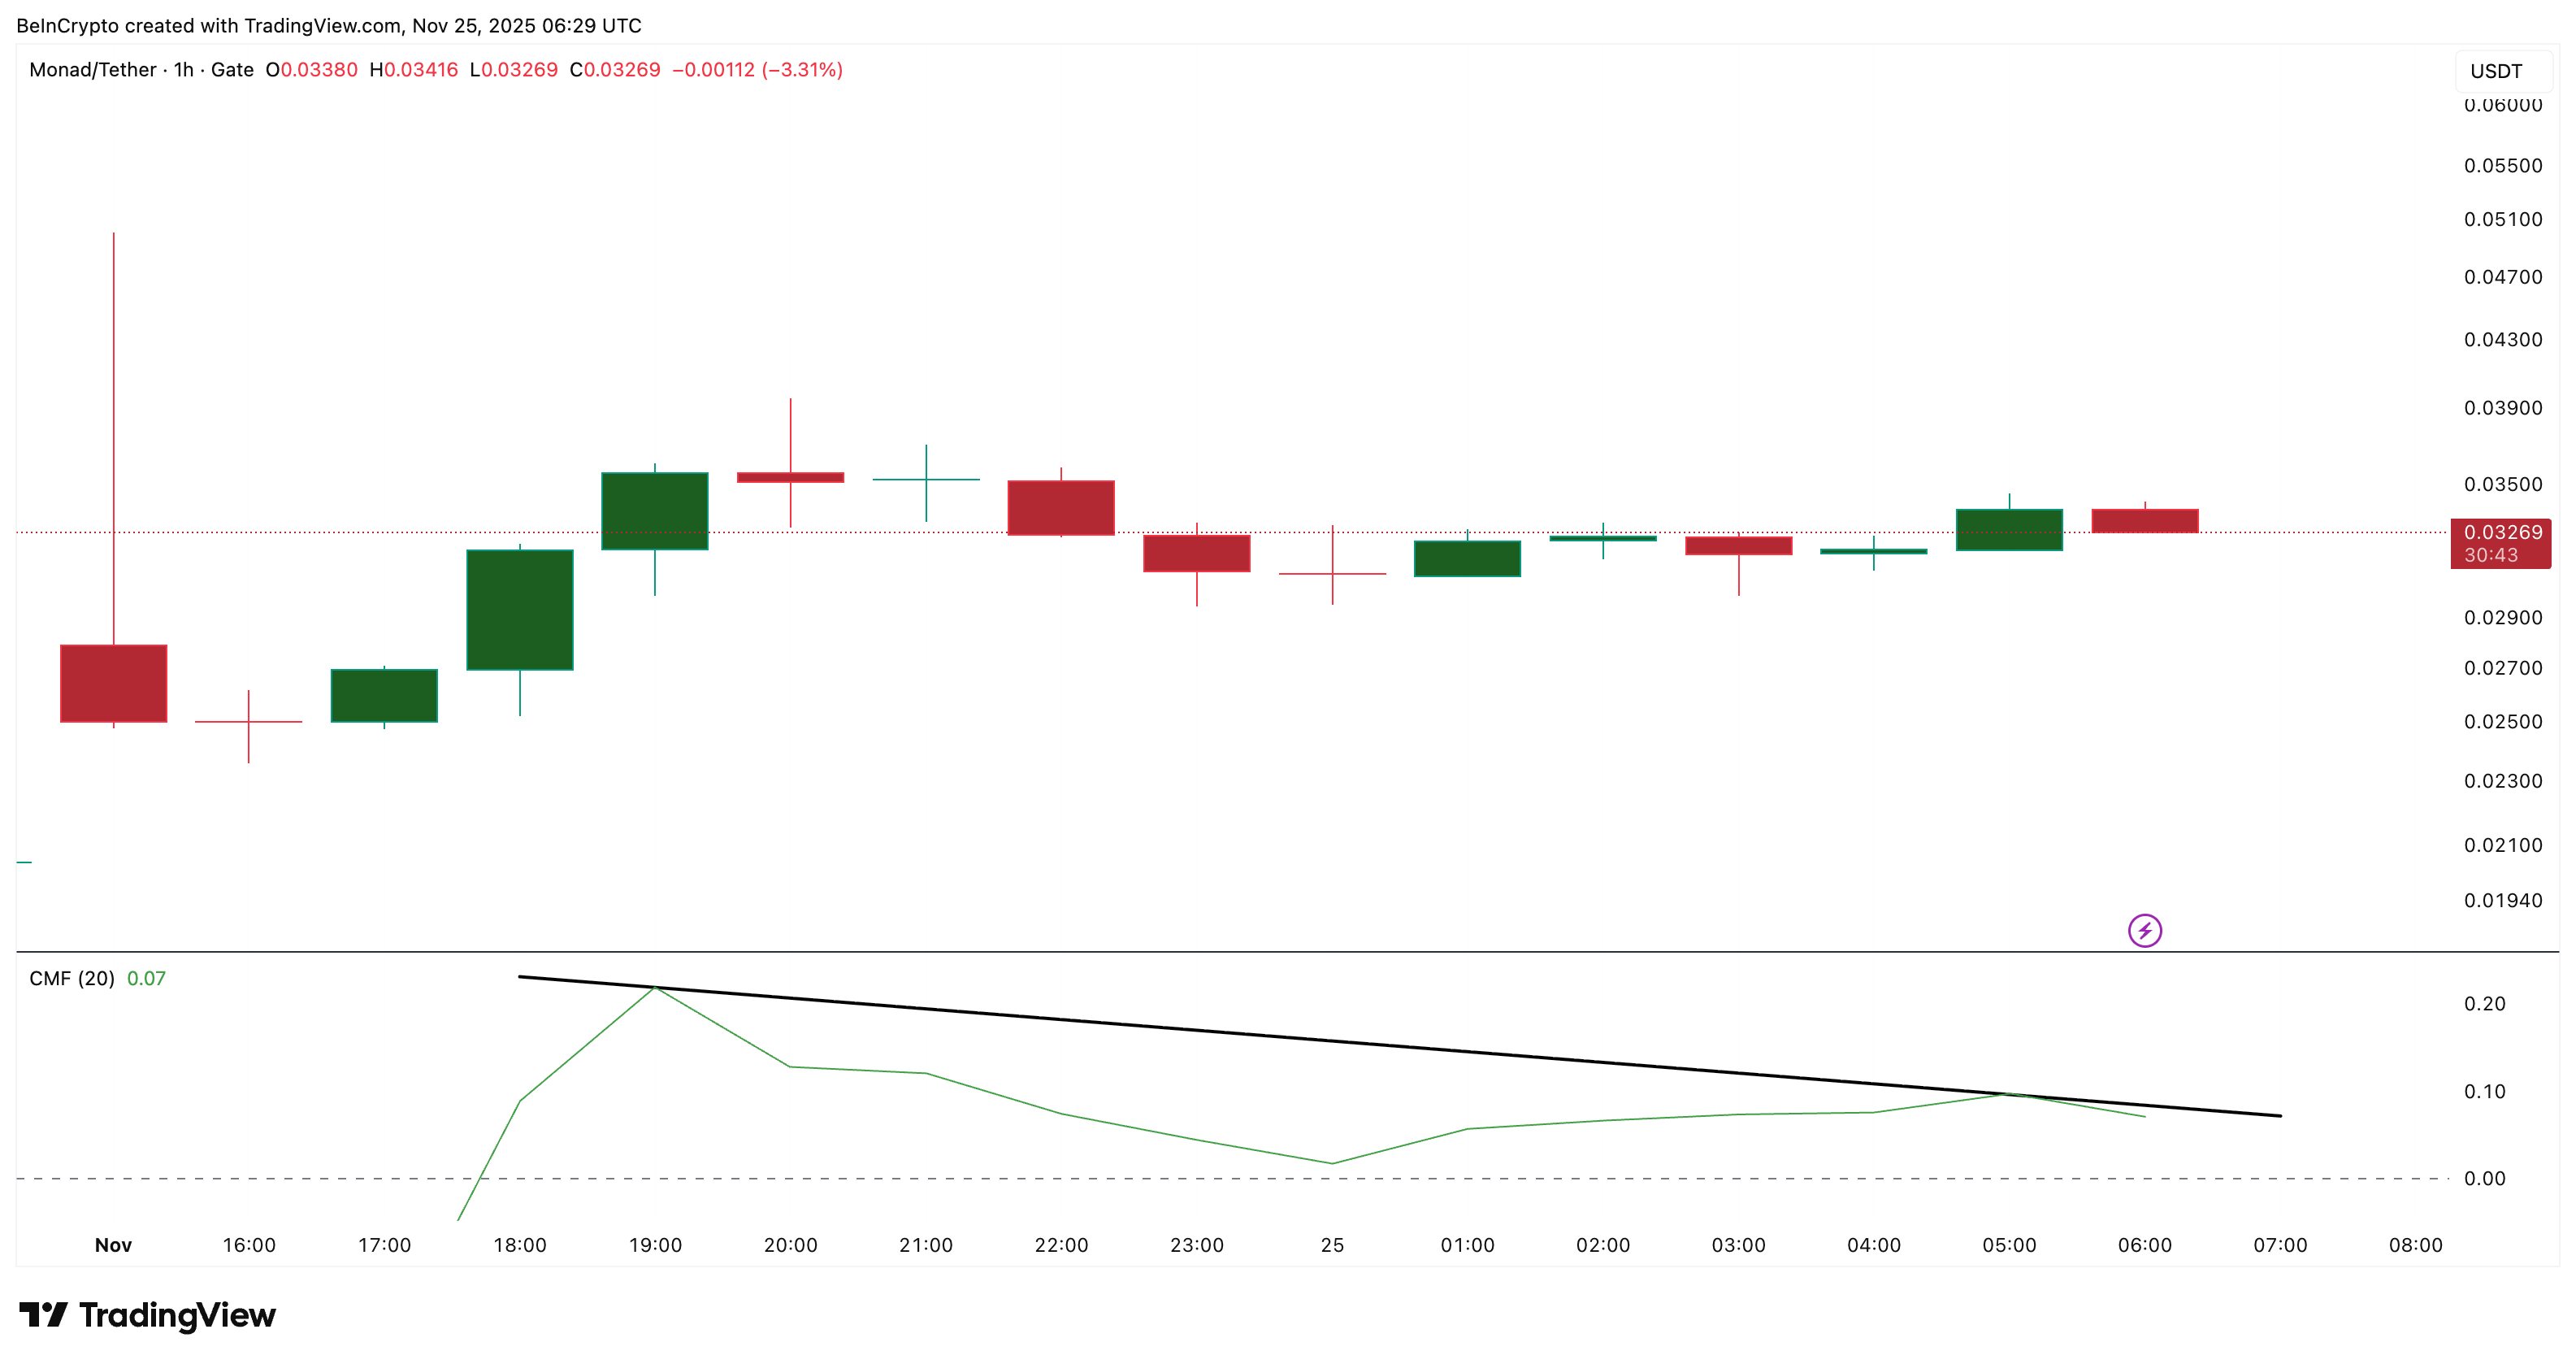
Big-money flow is soft. The CMF tried to rise on launch day, but it failed to break its upper trendline and has been slipping since. CMF shows whether large buyers are supporting the price. Its failure to hold upward momentum means big wallets are not increasing pressure behind the bounce. For bullish continuation, CMF must break above its trendline and hold there.
Volume tells the same story. On-Balance Volume tracks whether real participation is growing. OBV has not broken down yet, but it keeps flattening. Every time OBV has dipped, MON has seen sharp one-hour drops of almost 20% to 21%.
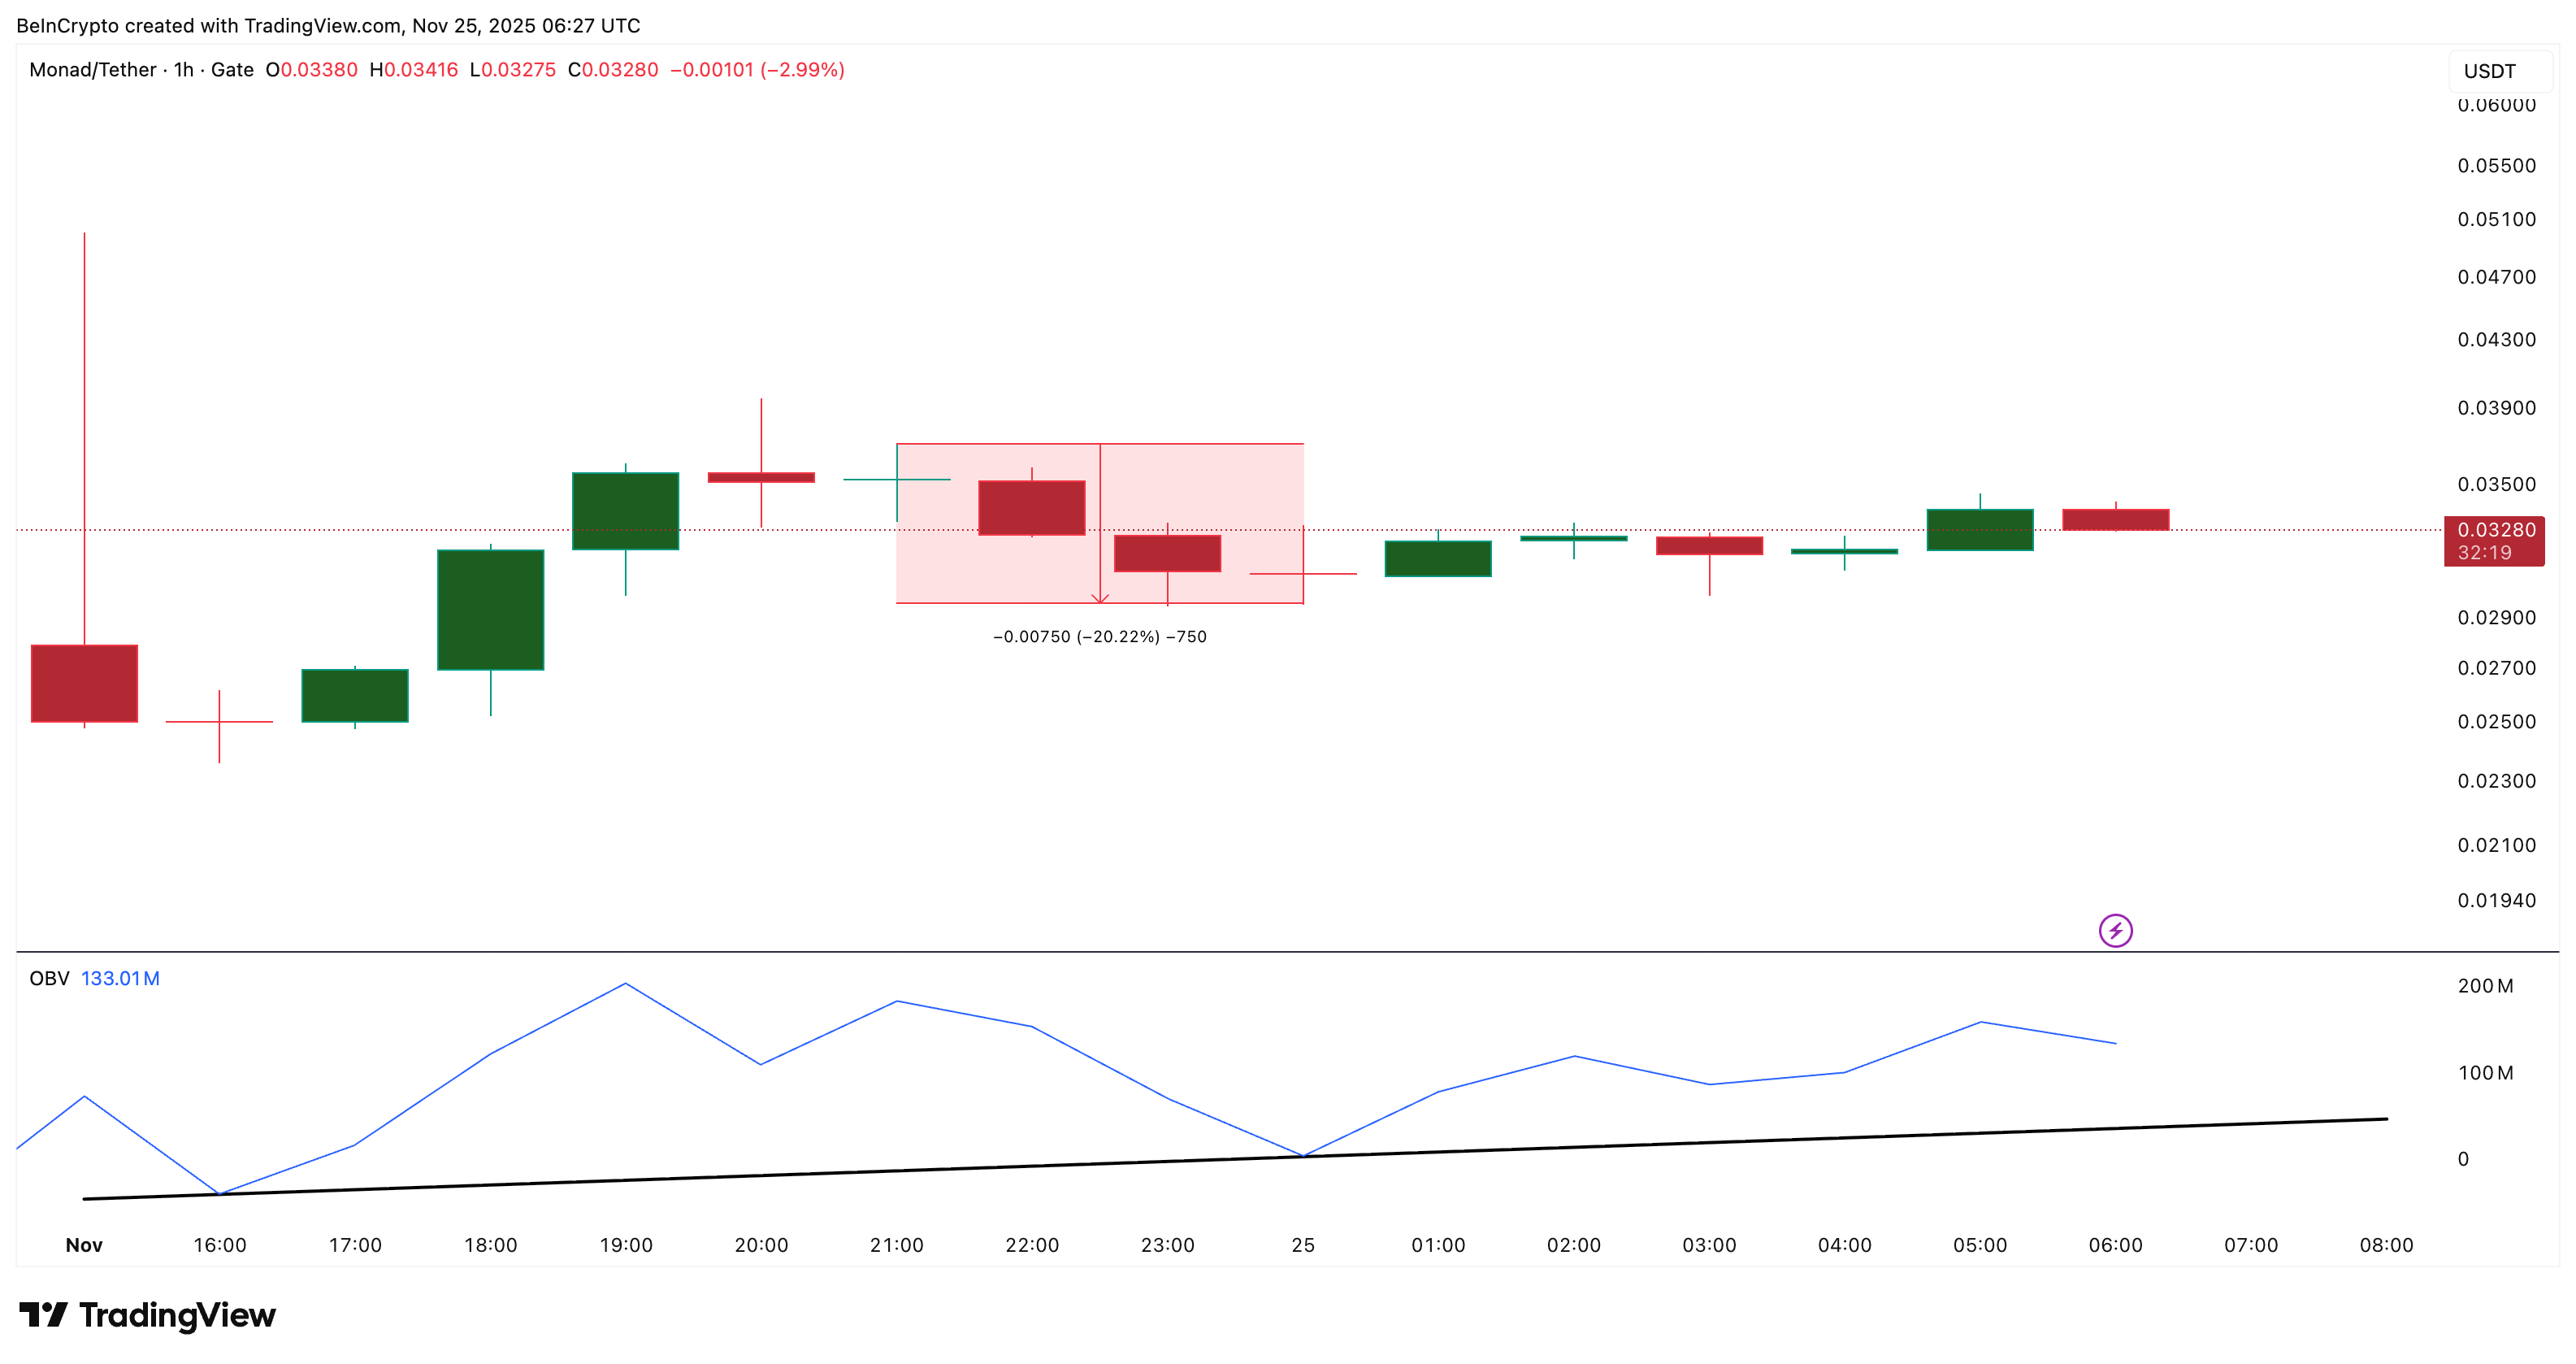
The current slope is weak, and OBV has failed to make a higher high. If this trend persists, the price is at risk of another fast correction.
These two signals line up with the perp data: cautious Monad traders are stepping into the short territory, and the spot chart is losing steady support.
Key Monad Price Prediction Levels To Watch
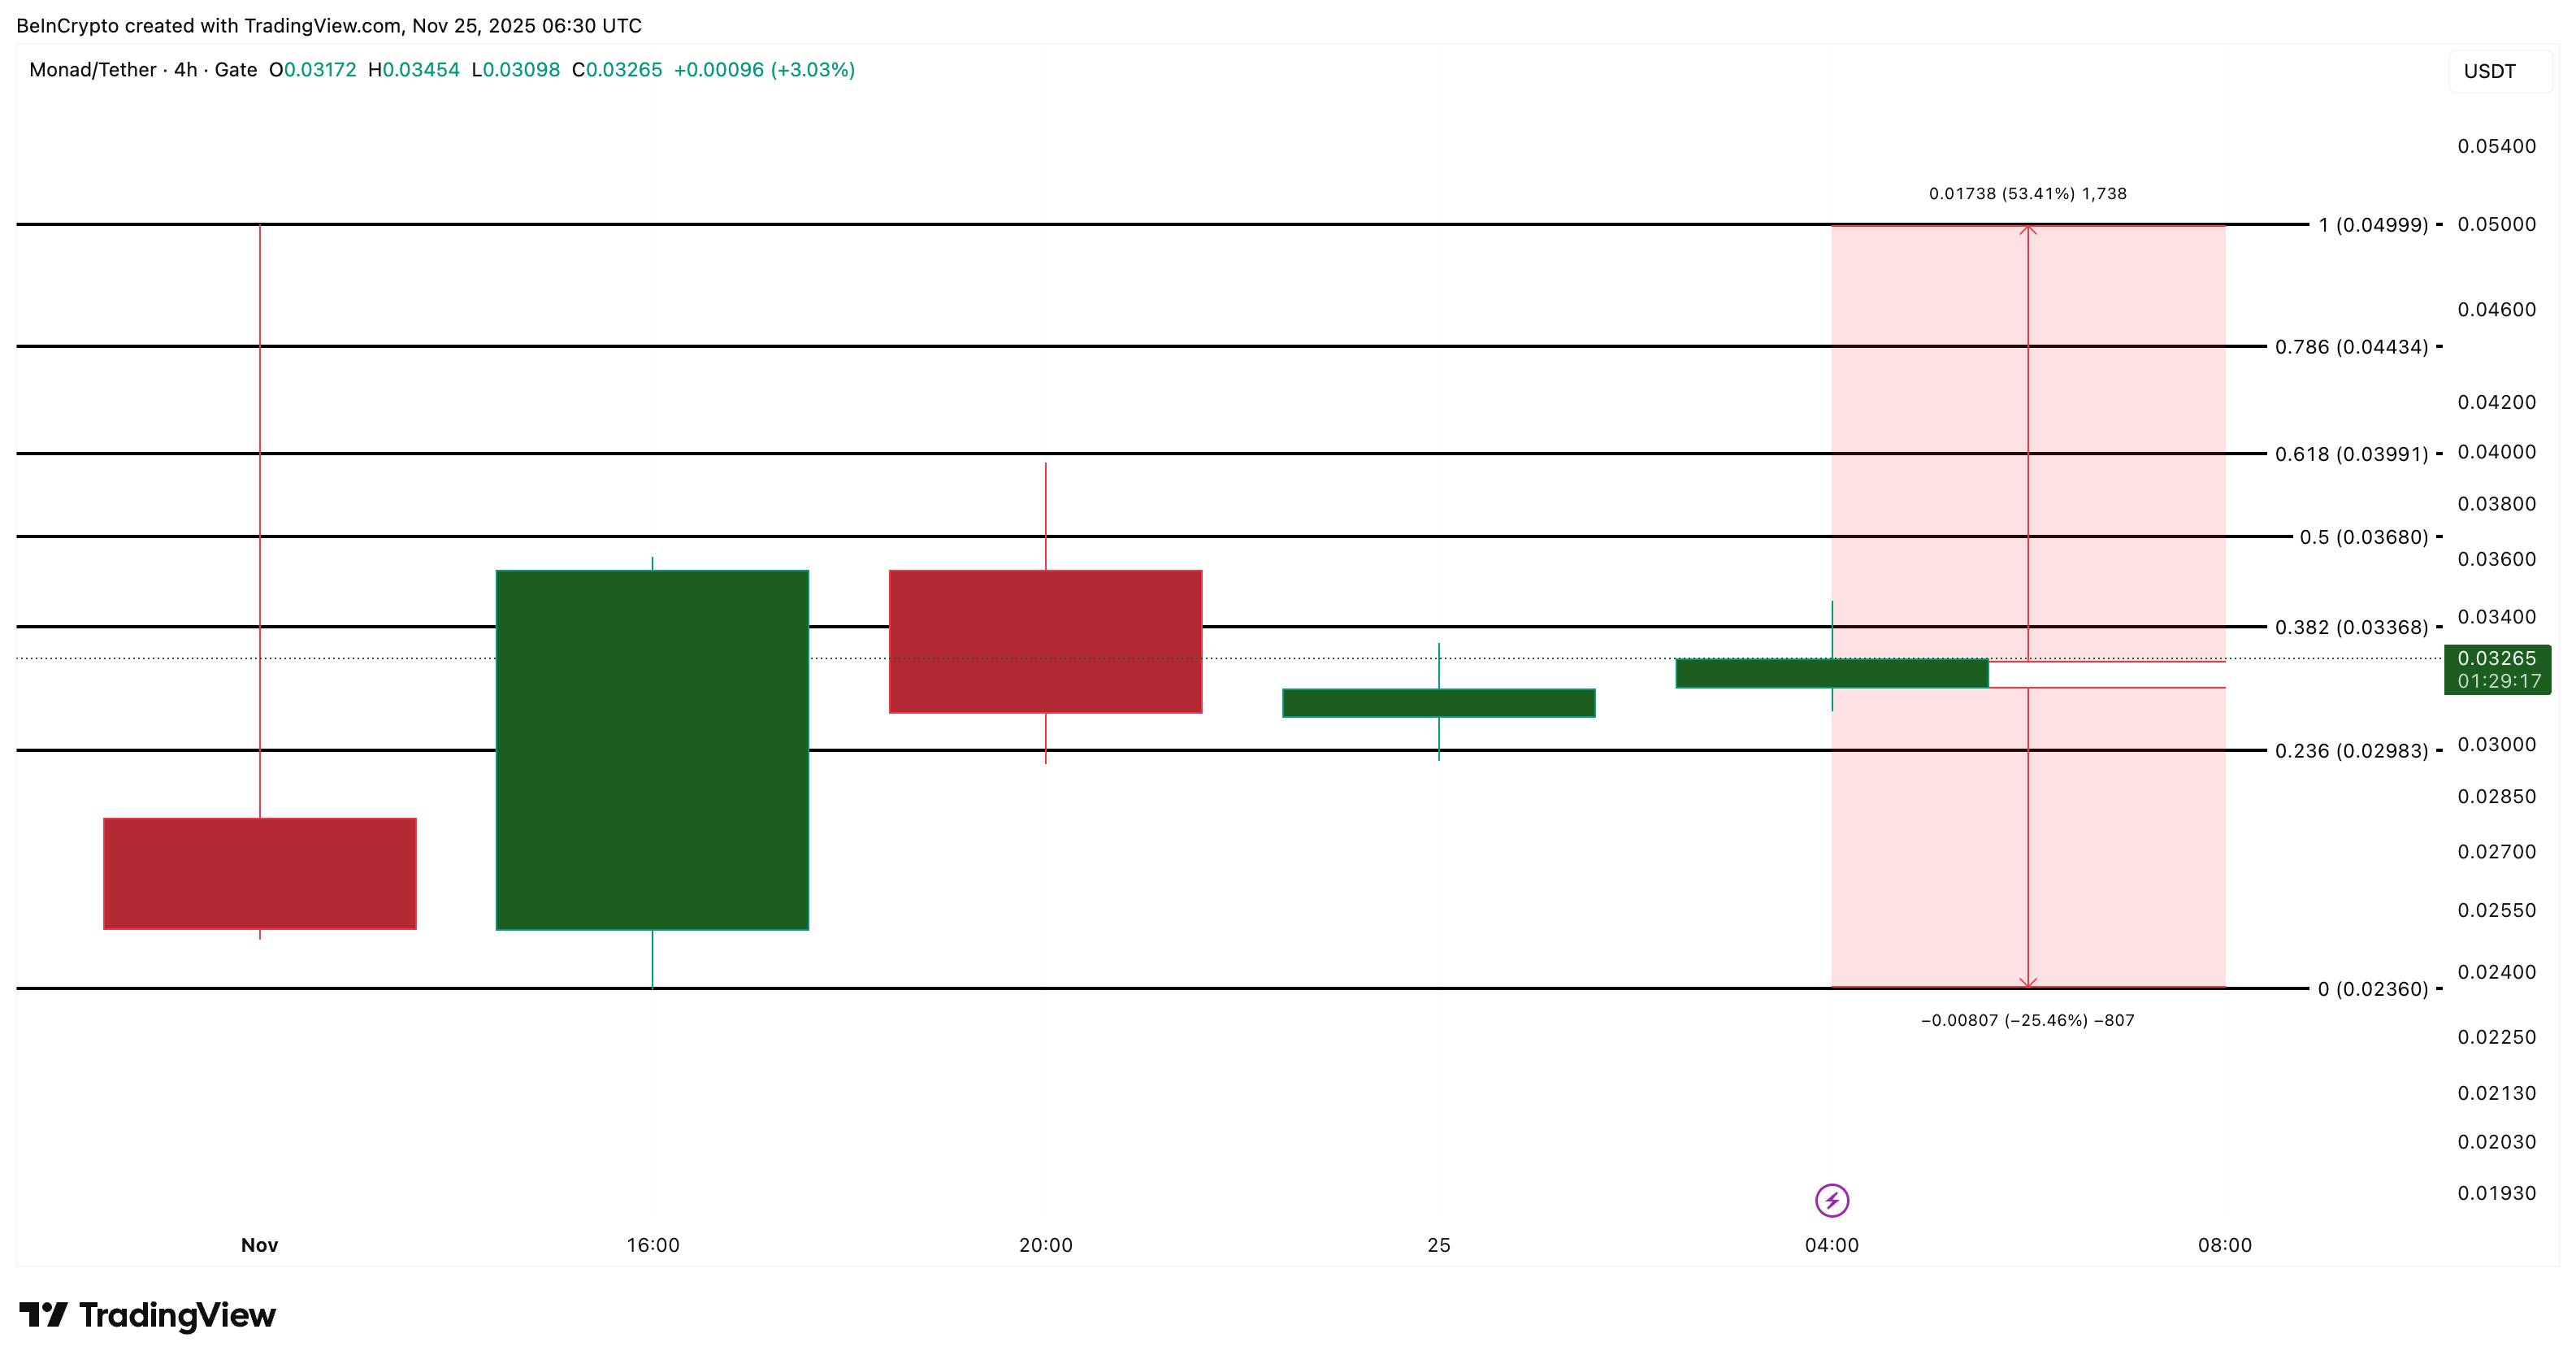
Monad (MON) trades in a tight band, and both outcomes remain close
To turn momentum upward, the price must close above $0.044. This level sits above the recent consolidation range. A clean move above it opens the next window at $0.049, but this requires rising OBV and a CMF breakout. Without that, upside remains weak.
On the downside, the key level is $0.029 on the 4-hour chart. A close below this line exposes $0.023, which marks almost a 25% drop from current prices. This level acted as the base right after the airdrop liquidity hit exchanges, and breaking it shows that selling from new recipients is still active.
With more than 10.8 billion tokens unlocked and many wallets still moving funds to exchanges, sharp swings can repeat.
