
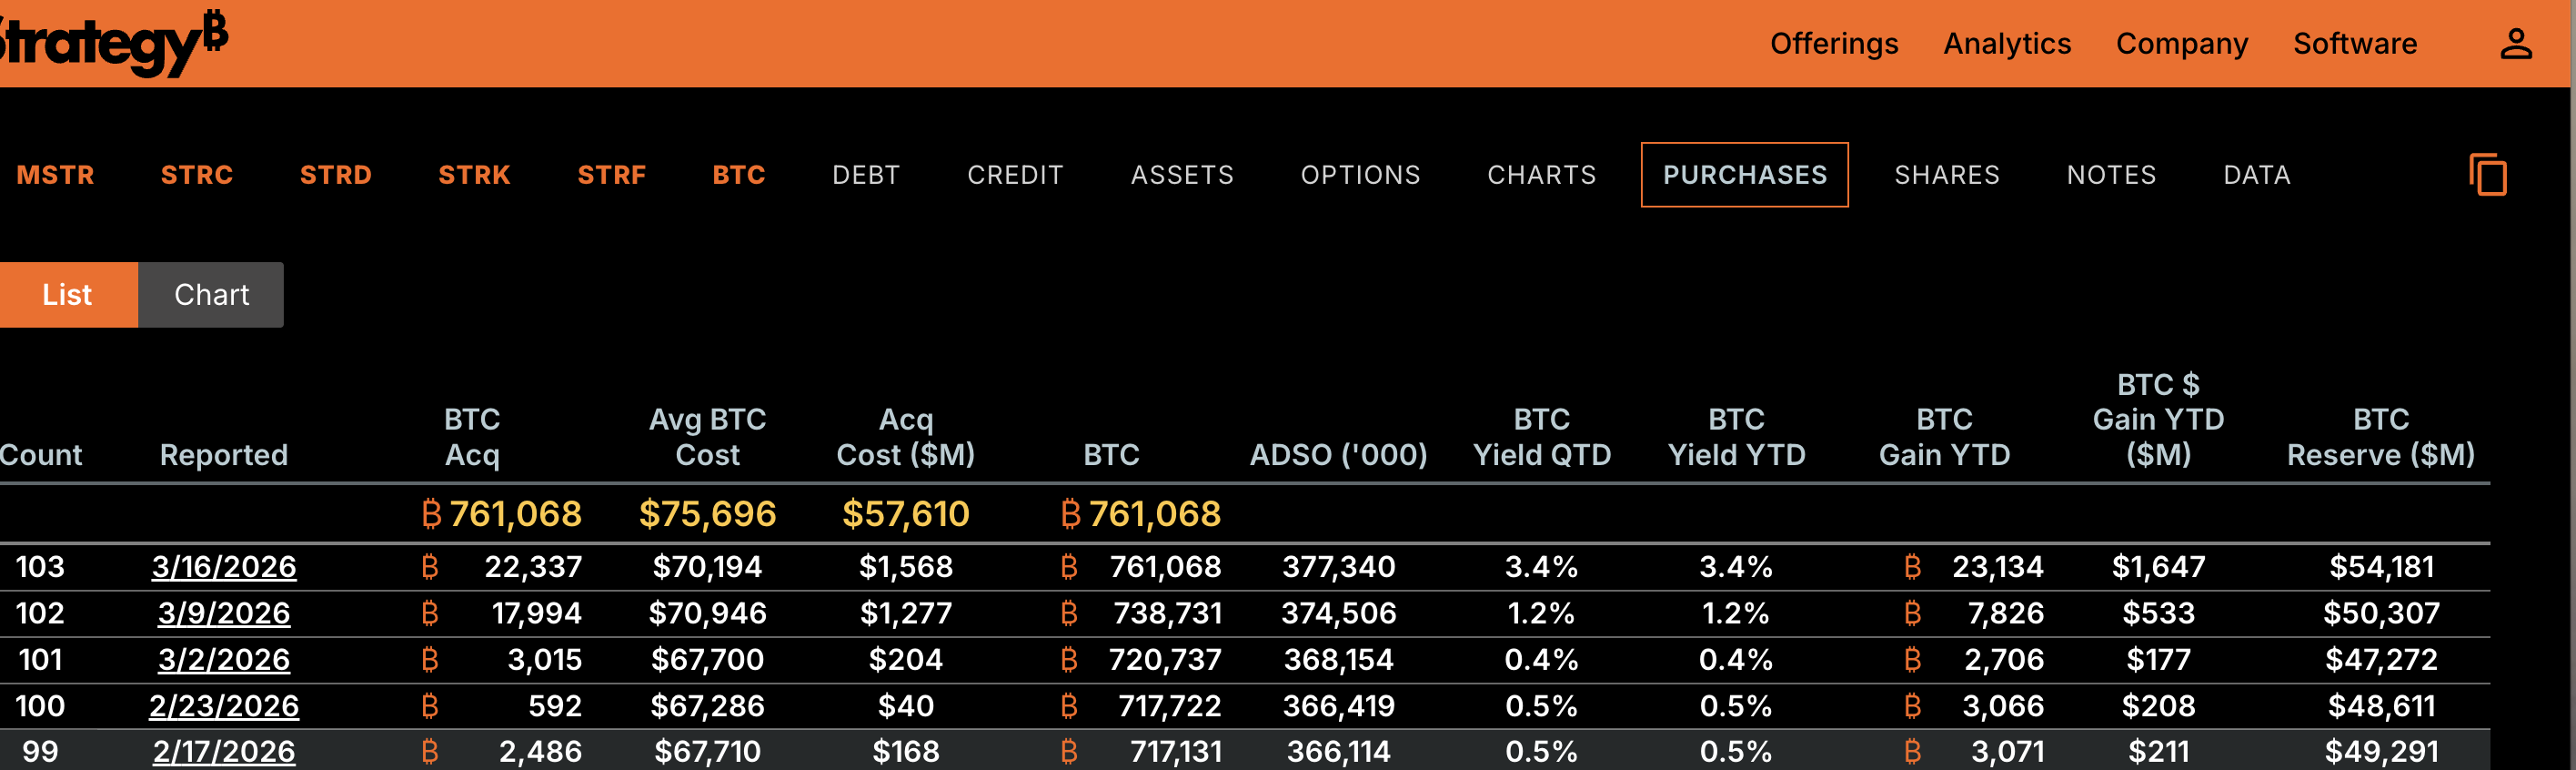
The MicroStrategy share price is approaching a key technical level after announcing its largest Bitcoin purchase in more in 16 months. The company recently acquired 22,337 BTC, bringing total holdings to 761,068 BTC with an average cost basis of $75,696.
Meanwhile, the MSTR stock has recovered sharply from February lows and now trades near the $149–$150 resistance zone, a level that could determine whether the rally continues.
MicroStrategy’s Record Bitcoin Purchase Strengthens Bullish Sentiment
MicroStrategy recently confirmed it purchased 22,337 Bitcoin, marking its largest acquisition since November 2024. The purchase lifted the company’s total Bitcoin holdings to 761,068 BTC, acquired at an average price of $75,696.
This aggressive accumulation strategy has long shaped how investors interpret MicroStrategy’s stock. Many market participants view the company as a proxy for Bitcoin exposure, meaning large purchases during a bullish crypto phase often boost investor sentiment toward the stock.
The latest acquisition arrived as Bitcoin prices recovered from recent volatility. As a result, the purchase has reinforced the perception that Strategy remains confident in Bitcoin’s long-term outlook.
The purchase also comes as Bitcoin trades near MicroStrategy’s average cost basis of $75,696, placing the company close to eliminating much of its recent paper losses.
That renewed optimism has coincided with a sharp recovery in the company’s share price, which at press time is up over 3% over the past 24 hours and almost 12% month-on-month.
MSTR Stock Reclaims 20-Day EMA as Recovery Channel Builds
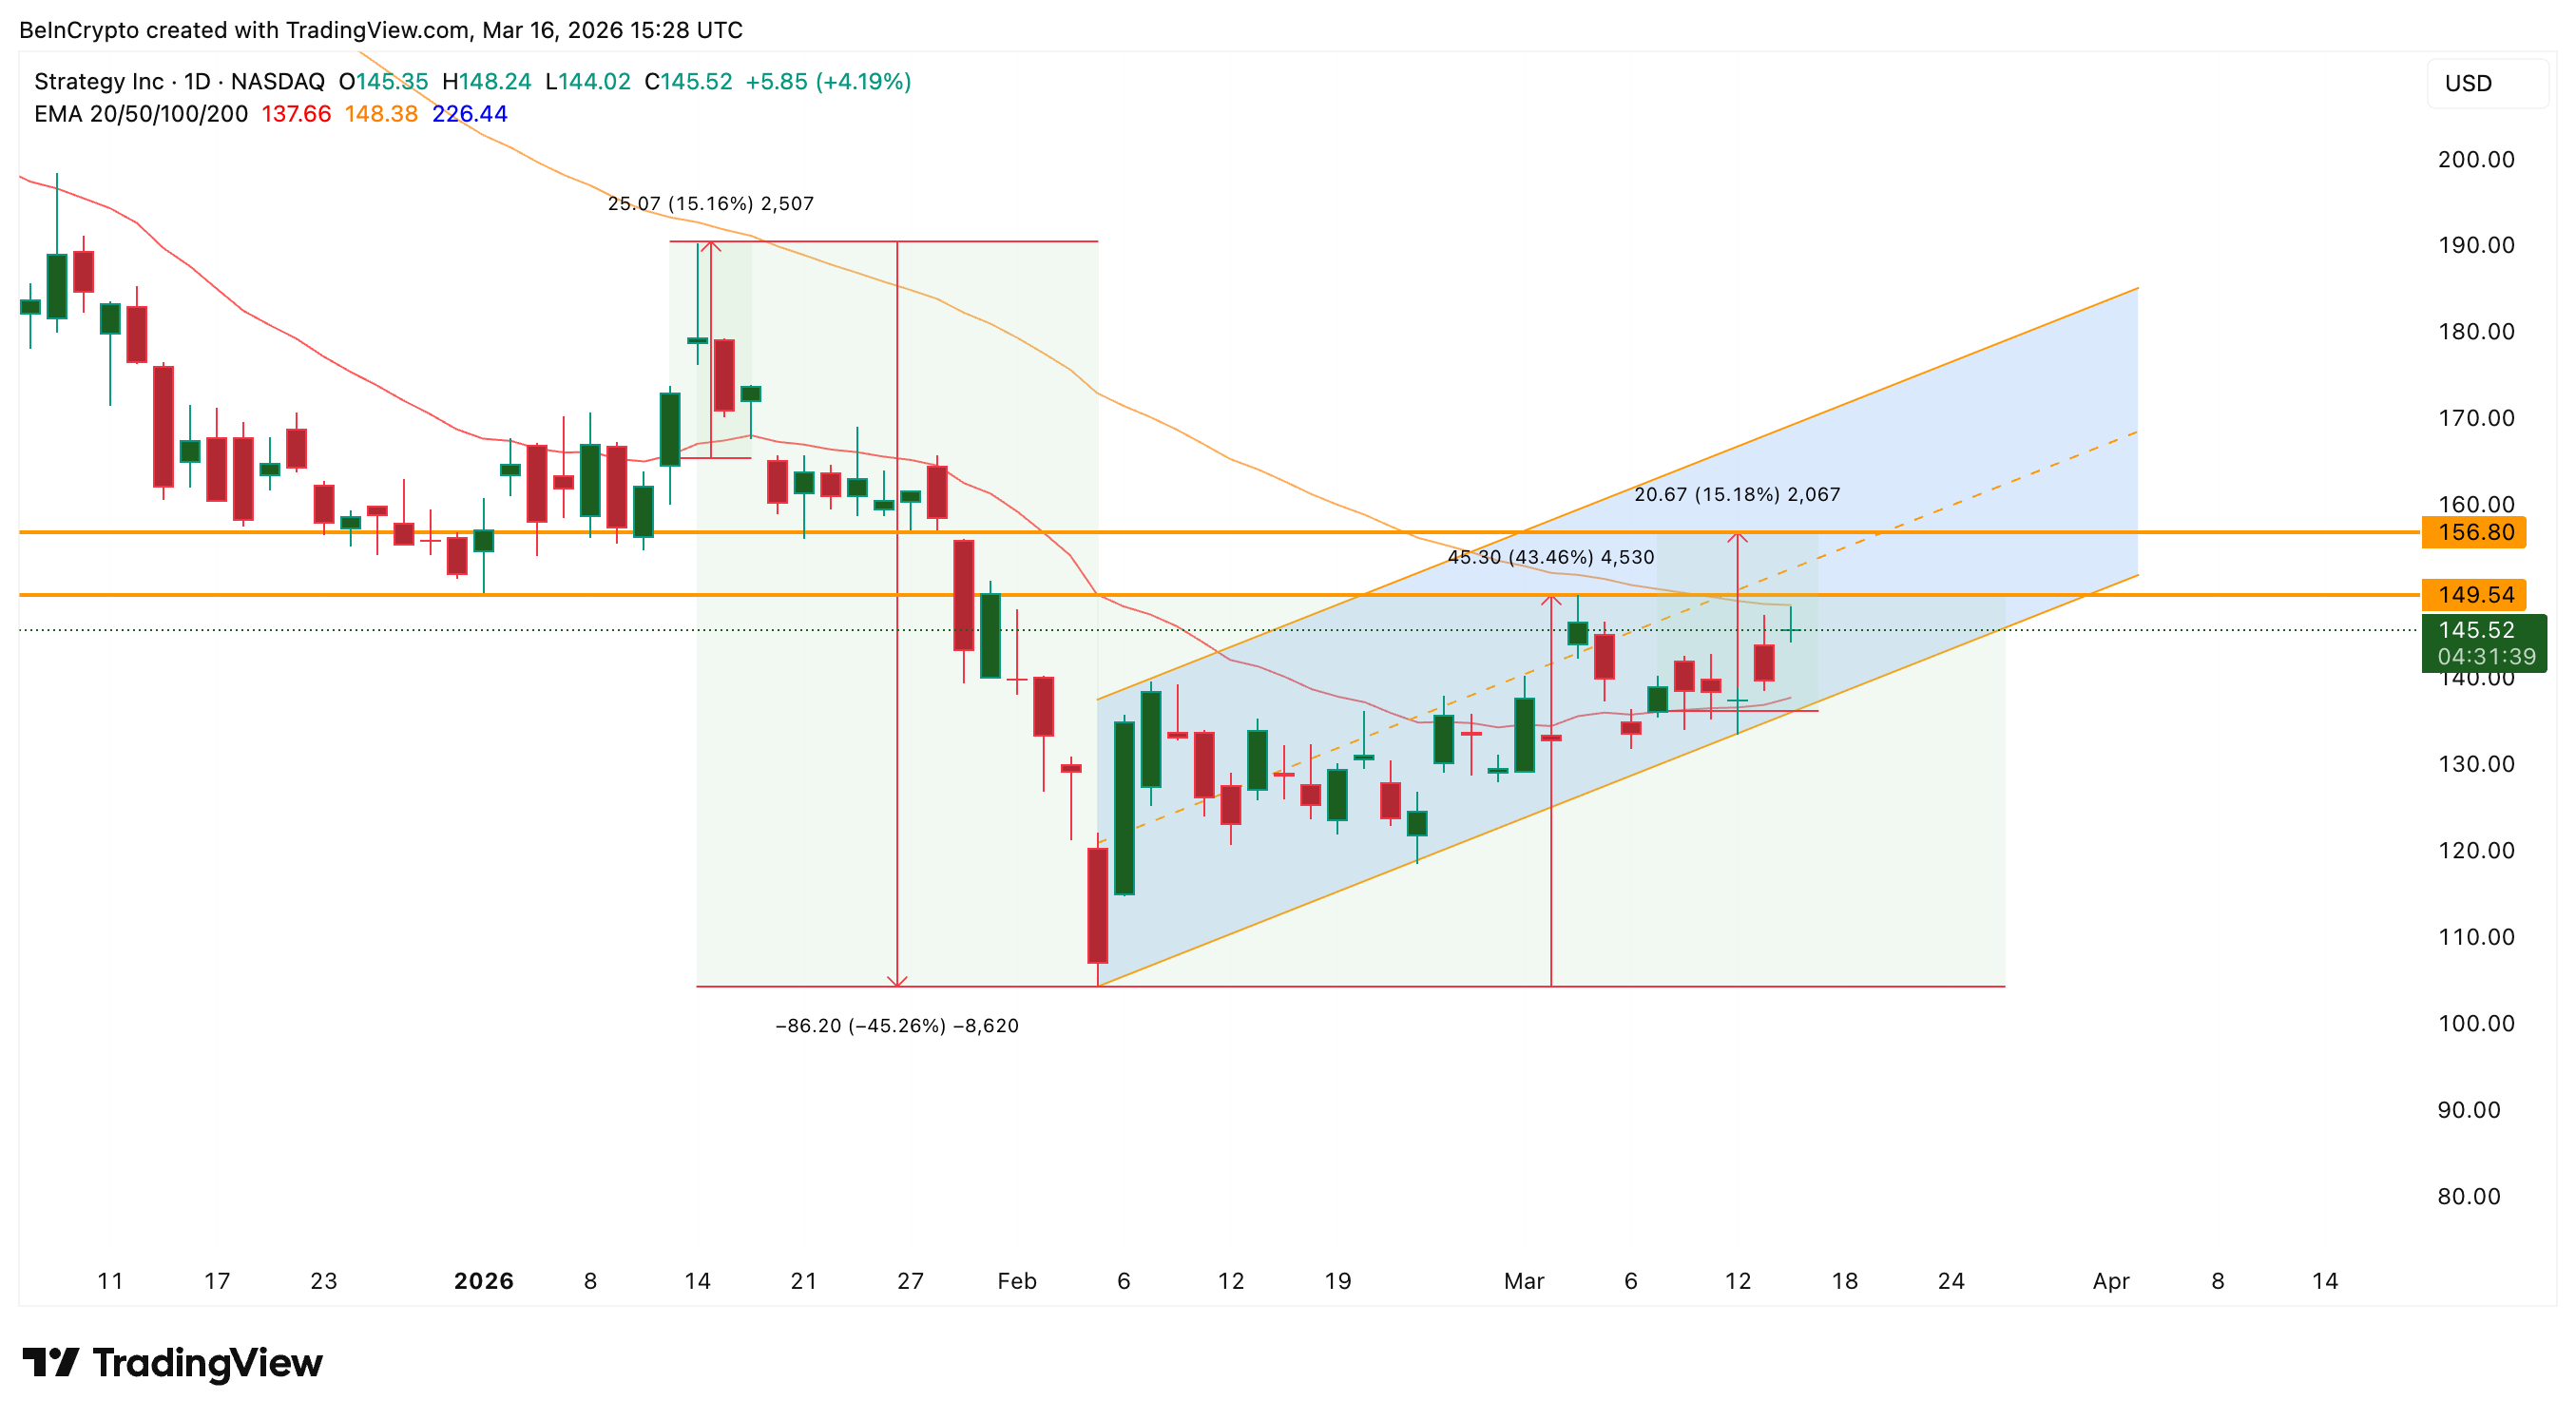
After peaking earlier this year, MicroStrategy’s stock dropped roughly 45% from its January high before stabilizing in early February. Since then, the stock has climbed about 43%, gradually recovering inside an ascending channel.
However, this ascending channel cannot be considered outright bullish as it forms after a steep price drop.
Yet, one important development occurred on March 9, when the stock reclaimed its 20-day Exponential Moving Average (EMA). The EMA is a trend indicator that gives greater weight to recent price movements, helping analysts identify short-term momentum shifts.
The last time MicroStrategy reclaimed the 20-day EMA cleanly, in mid-January, the stock rallied roughly 15% shortly afterward.
The stock is now approaching another major technical barrier near $149–$150. This area aligns with both the 50-day EMA and a previous swing high, making it a critical resistance zone.
The 20-day EMA reclaim might give MicroStrategy shares the push they need to cross the key barrier.
While the ascending channel suggests improving momentum, a confirmed breakout above this resistance is still required to validate a stronger bullish move. Investor positioning indicators provide additional clues about the improved breakout sentiment.
Capital Inflows and Options Positioning Point to Growing Optimism
Market positioning indicators suggest investor sentiment toward MicroStrategy has become increasingly positive in recent weeks.
One key signal comes from the Chaikin Money Flow (CMF) indicator, which tracks whether big capital is flowing into or out of a stock.
Since early February, CMF has been trending higher alongside the price, indicating that buying pressure has gradually strengthened.
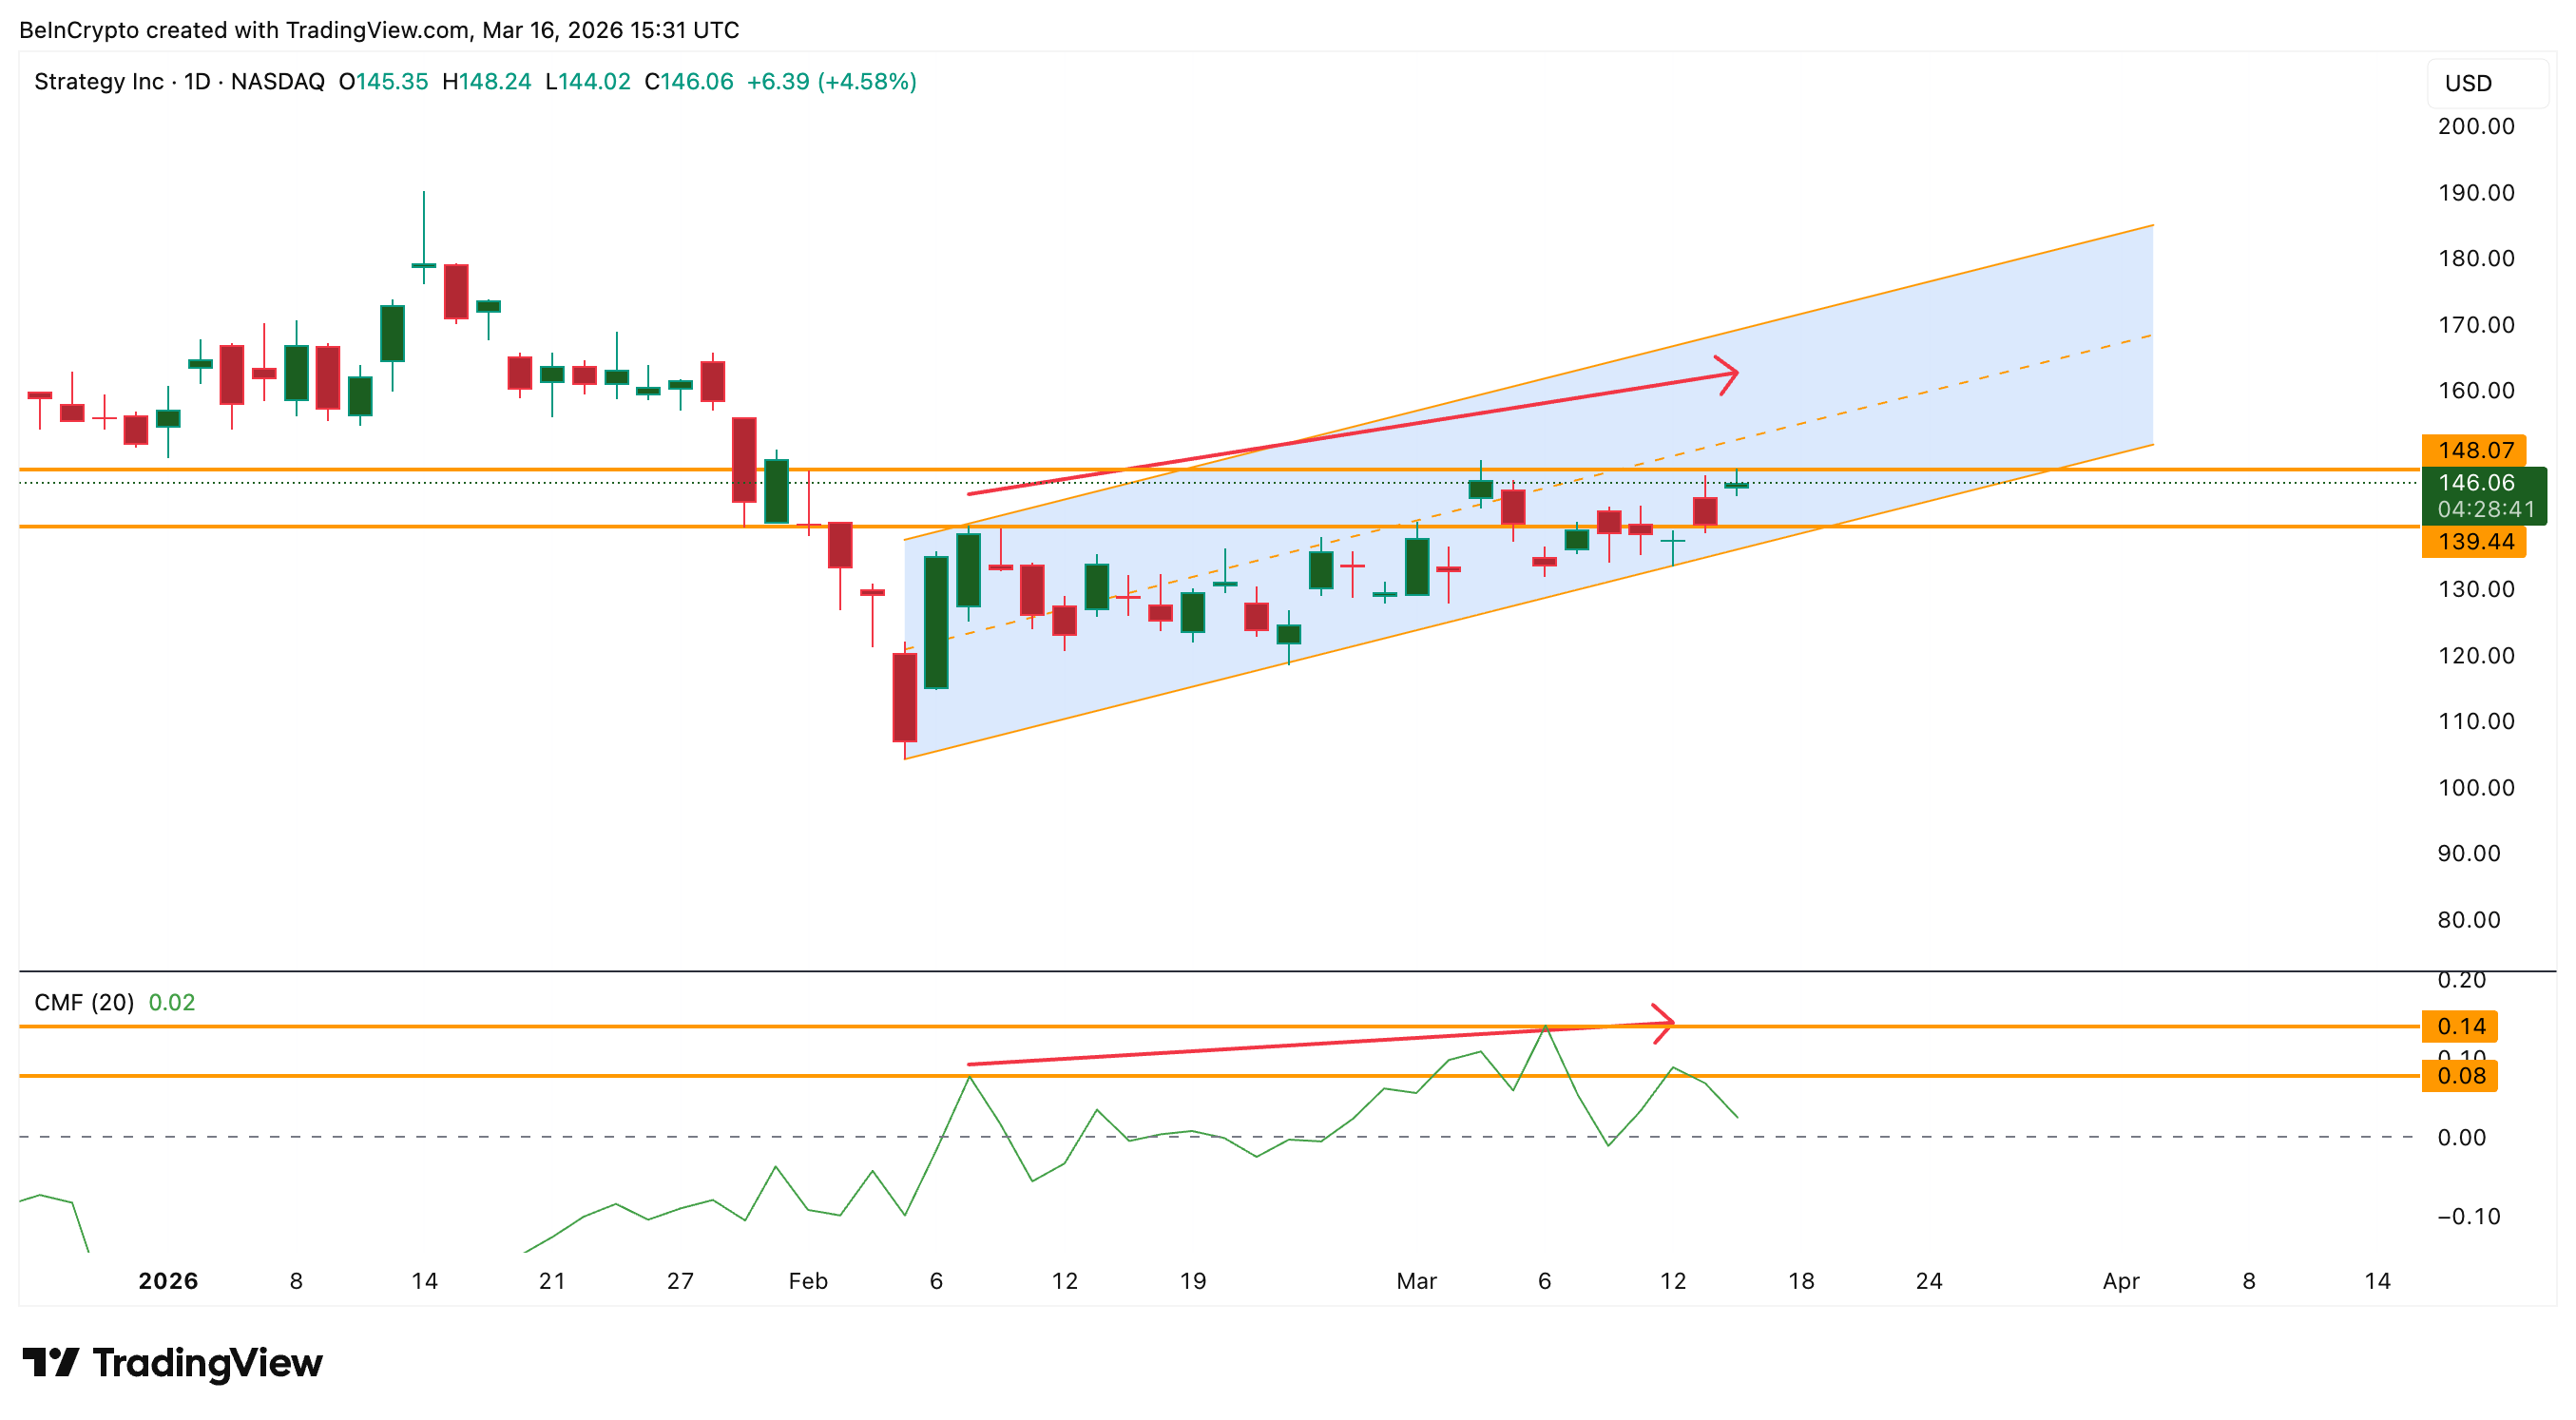
If CMF climbs toward the 0.14 level, it would confirm stronger capital inflows and reinforce the current recovery trend, keeping the higher-high structure intact.
Options markets also reflect improving sentiment. This market allows traders to bet on whether a stock’s price will rise or fall without actually buying the stock.
The put-call ratio, which compares bearish put options to bullish call options, currently sits below 1, with a volume ratio near 0.81 and an open-interest ratio around 0.89.
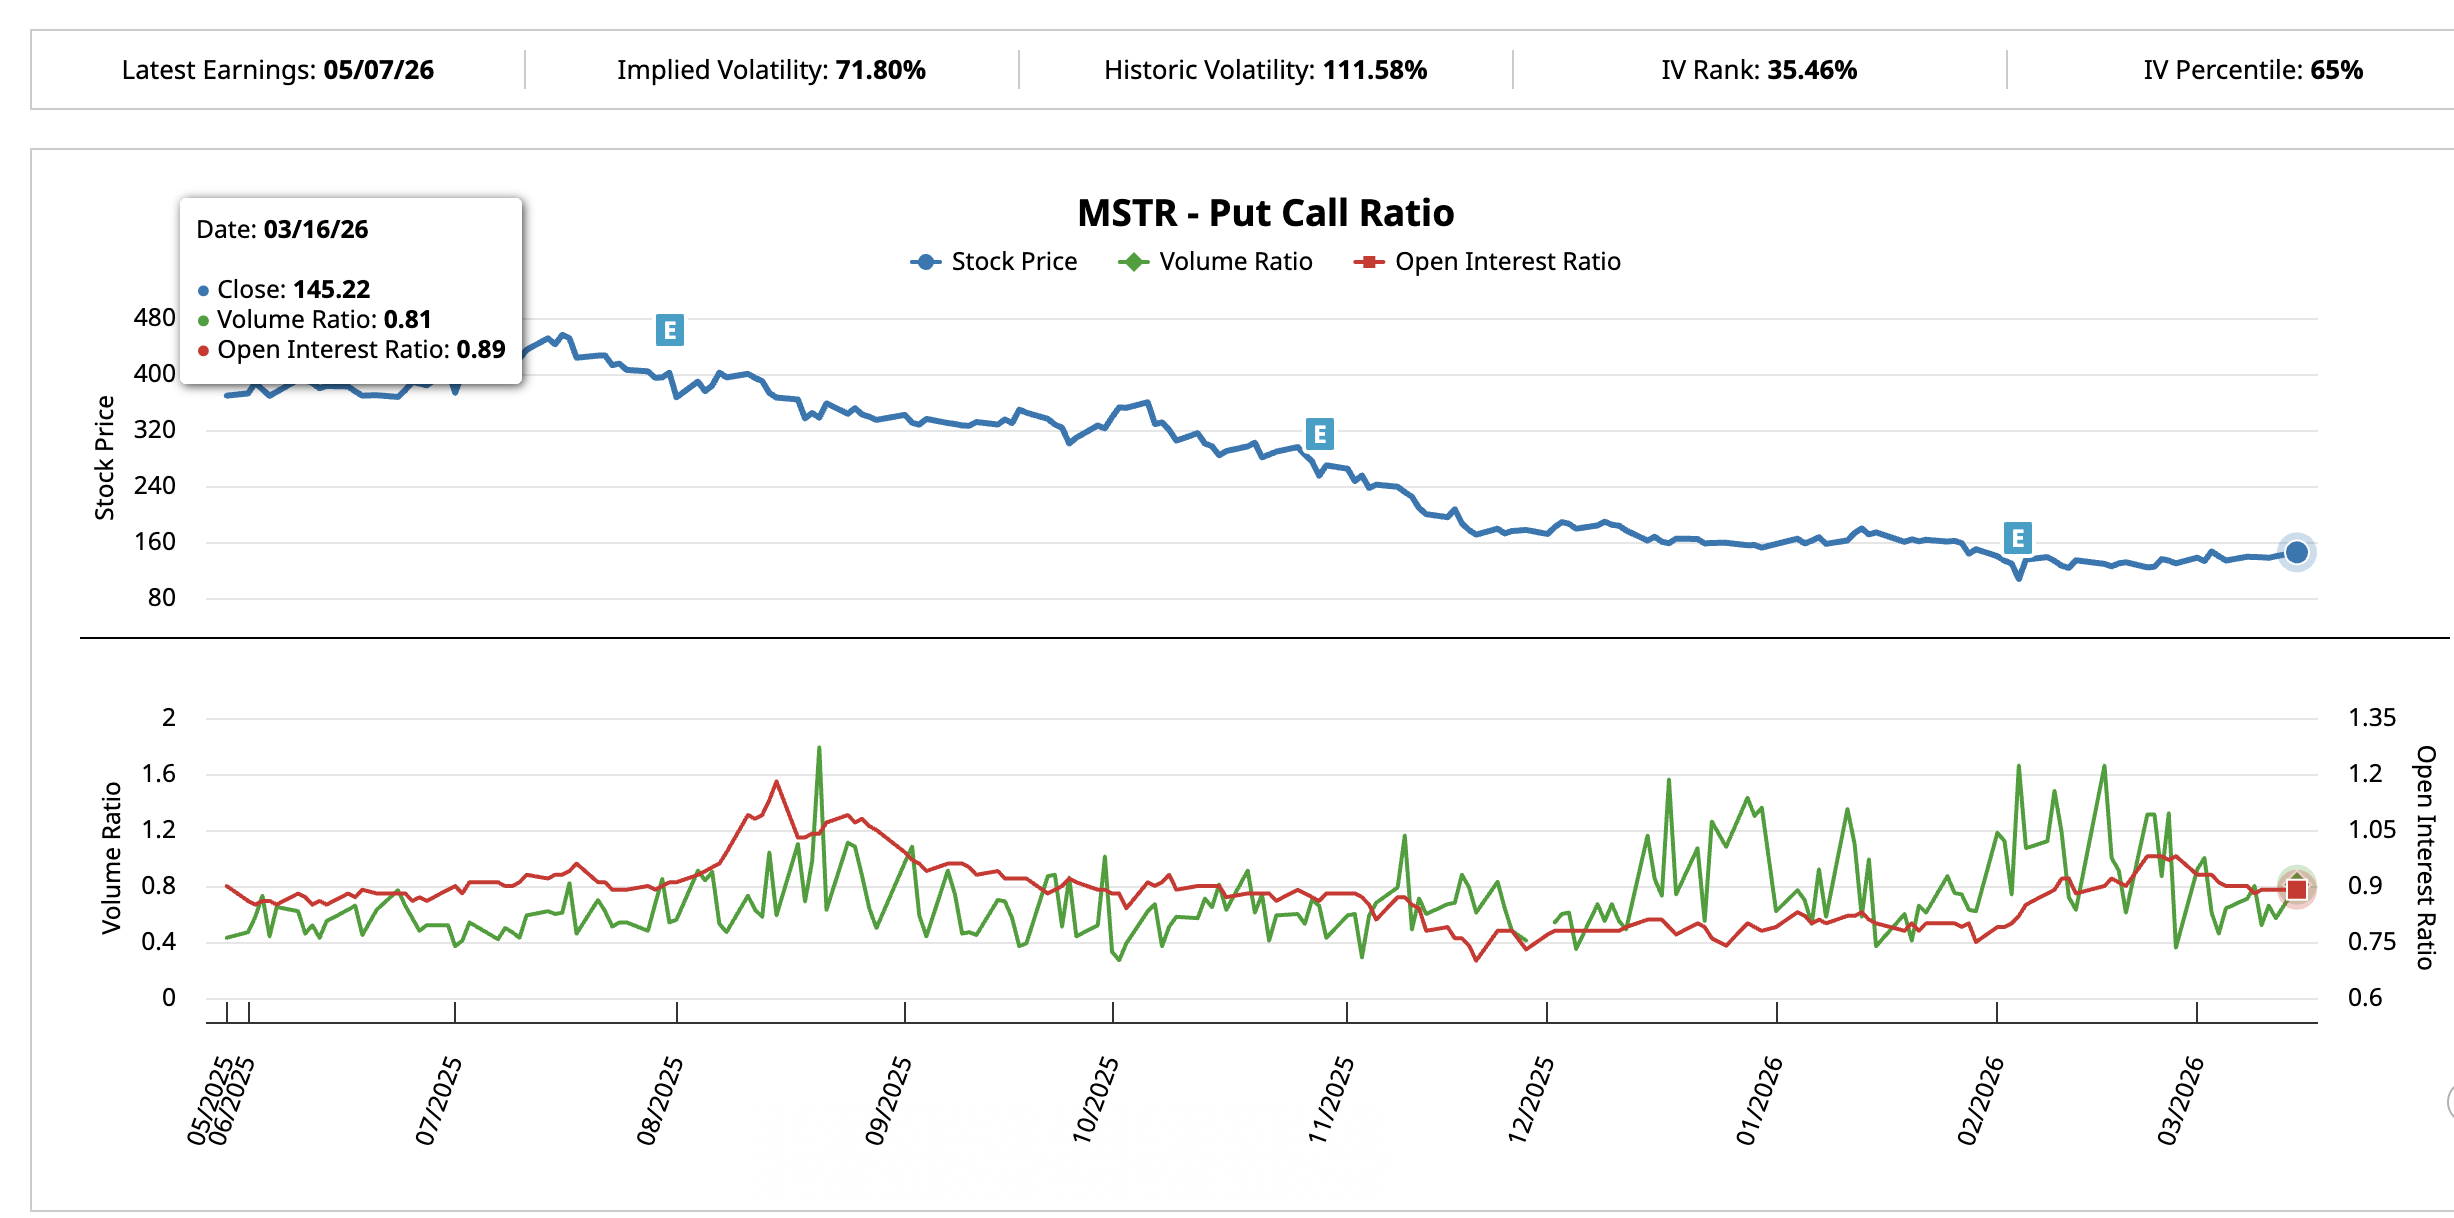
A put-call ratio below 1 means traders are holding more call options than puts, suggesting that options traders are leaning bullish on the stock’s direction. Together, rising capital inflows and bullish options positioning strengthen the case that investors are preparing for a potential breakout.
This brings attention to a technical pattern that again places the $149–$150 level at the center of the next move.
Bullish Pattern Puts $150 Breakout in Focus
MicroStrategy’s chart also appears to be forming an inverse head-and-shoulders pattern, a structure that often signals a potential bullish reversal after a downtrend. The pattern comes with a 45% breakout potential if the neckline breaks.
For MicroStrategy, the pattern’s neckline sits around the $149–$150 zone, the same level currently acting as resistance. If the stock breaks above this neckline, the pattern could activate a bullish move.
Based on the pattern’s structure, such a breakout could open the path toward levels around $160, $177, and potentially near $217, the projected target.
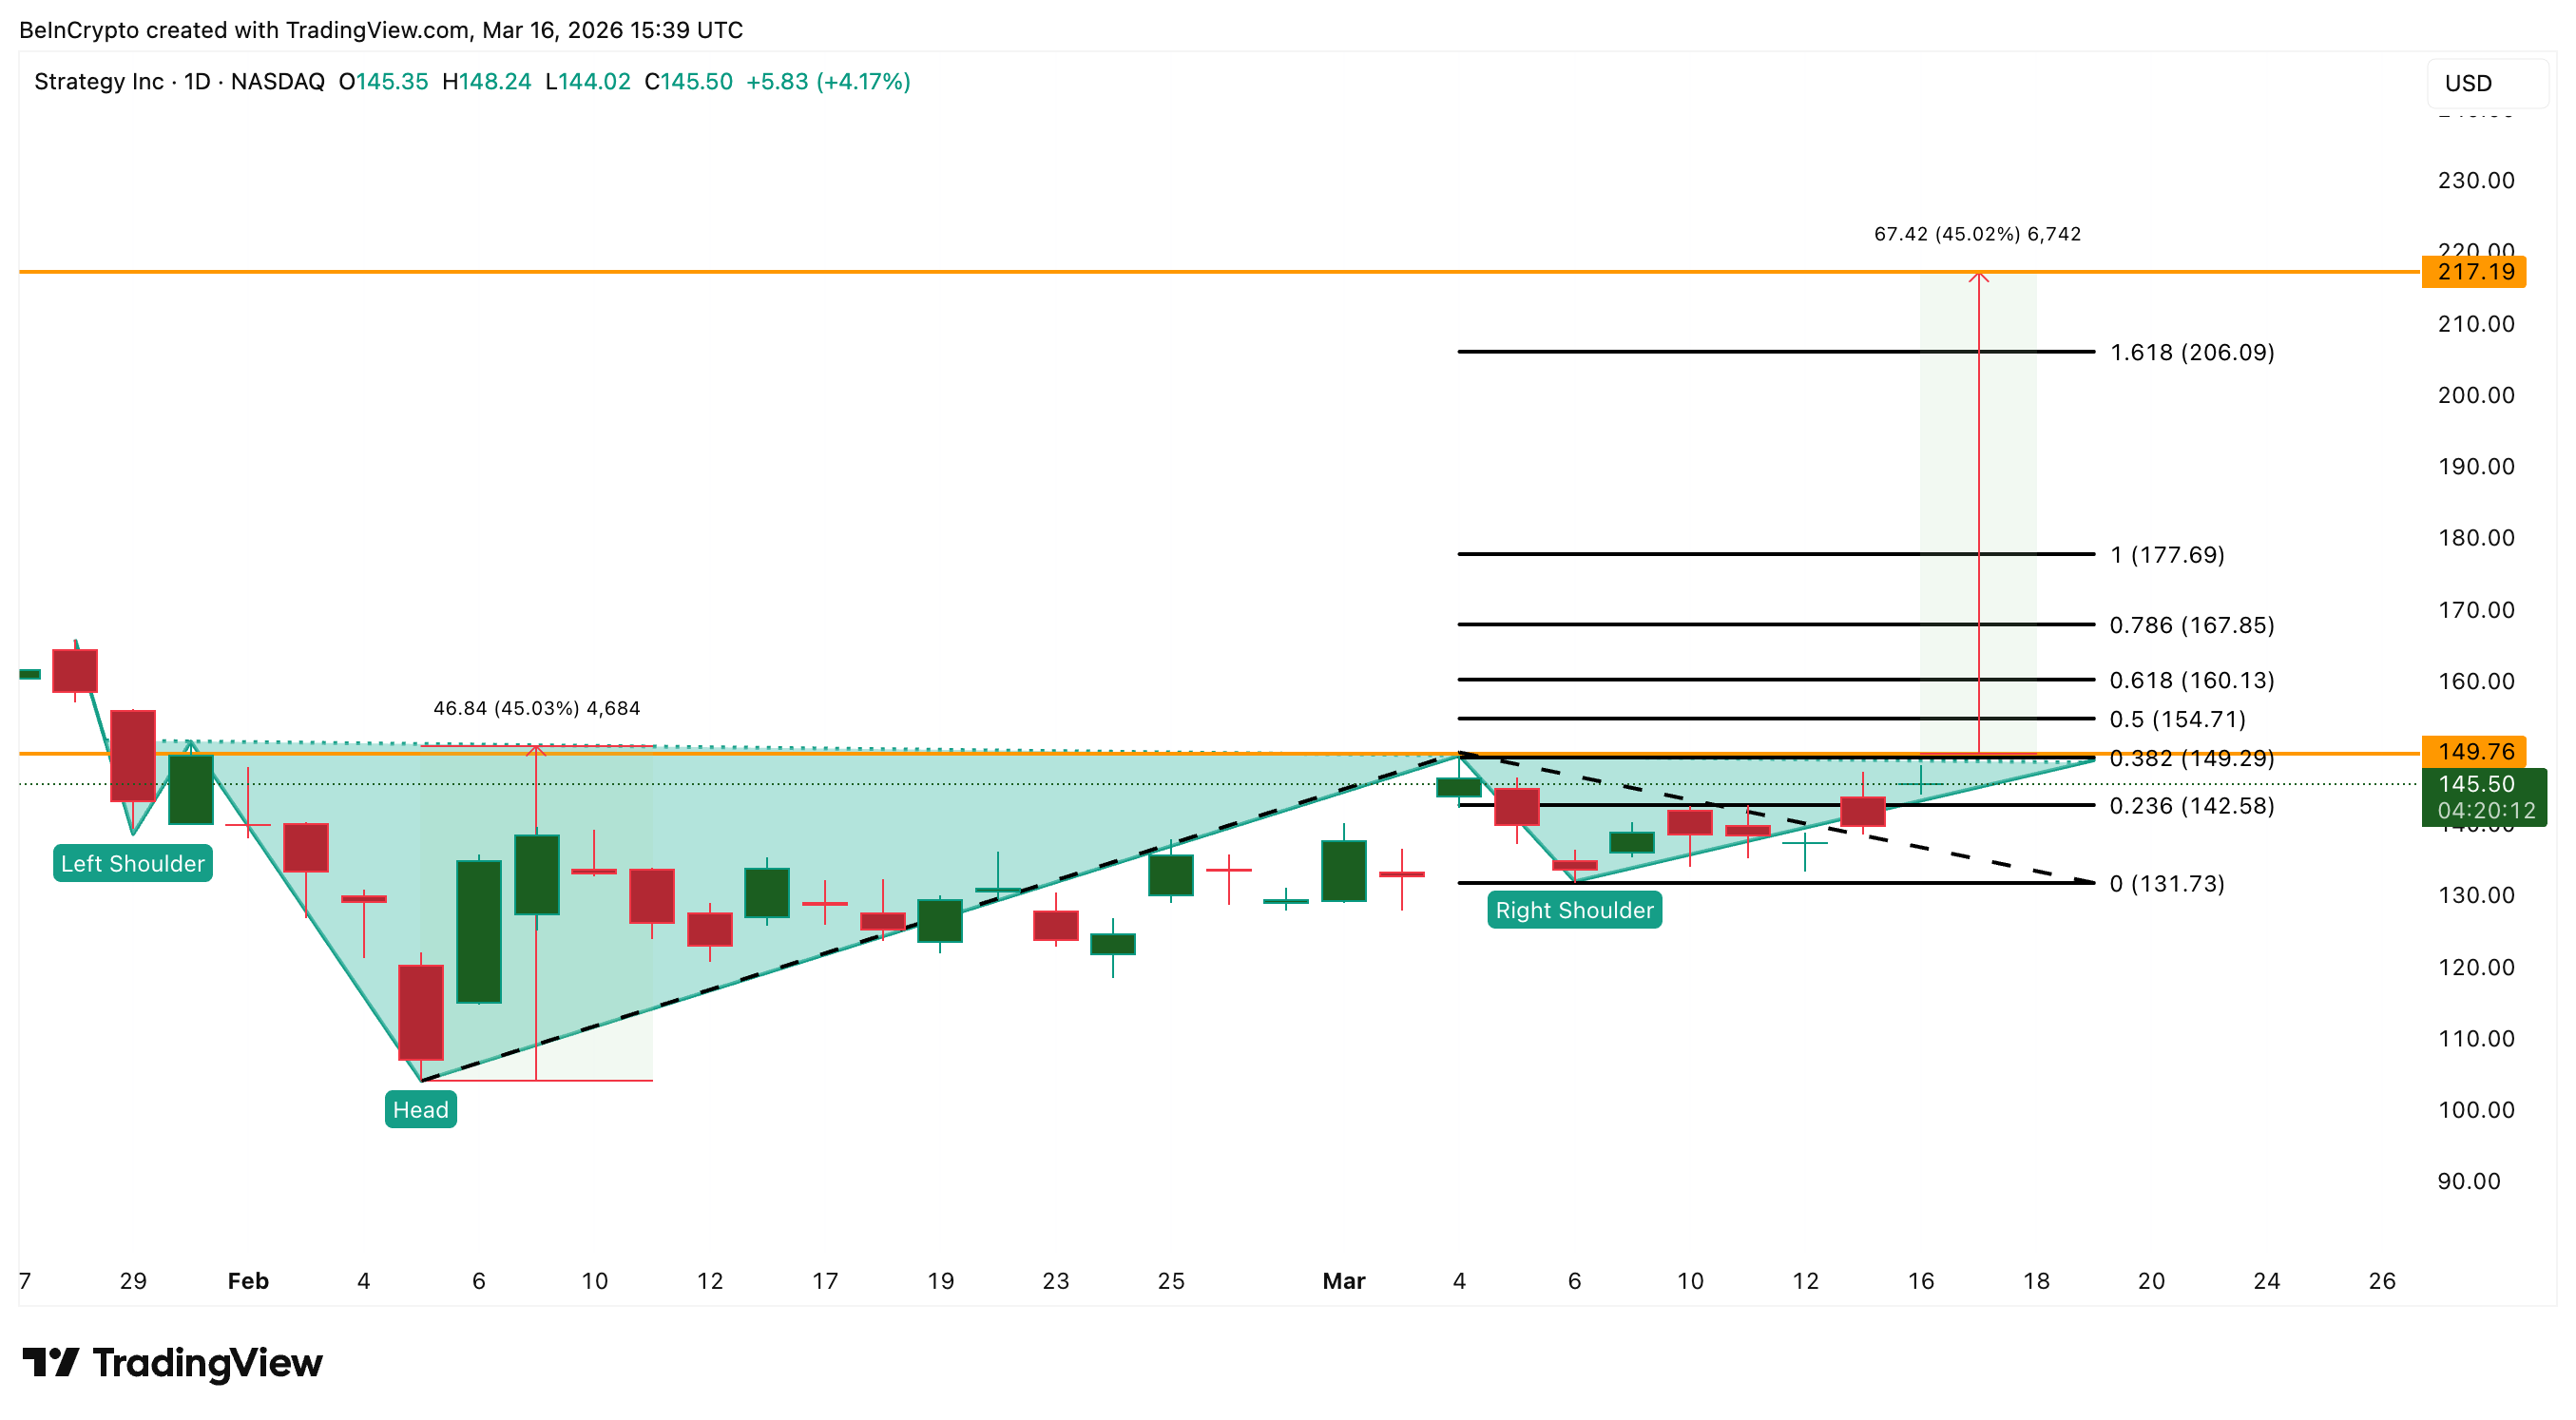
However, the bullish thesis depends heavily on a breakout above the $149-$150 level.
If the stock fails to reclaim the $149–$150 resistance, the recovery channel could weaken. A decline below $142 would indicate fading momentum, while a deeper drop below $131 would weaken it considerably.
For now, MicroStrategy sits at a technical crossroads. The combination of a record Bitcoin purchase, strengthening capital inflows, and improving options sentiment has built a bullish setup, but the $149–$150 level remains the decisive trigger that could determine the stock’s next major move.
