
M, the native coin of MemeCore, the first Layer-1 (L1) blockchain built for memes, is today’s top gainer in the crypto market. The coin’s price has surged more than 20% in the last 24 hours.
With bullish momentum building, M might be gearing up for even more gains in the short term.
M Double-Digit Surge Puts Bulls Back in the Driver’s Seat
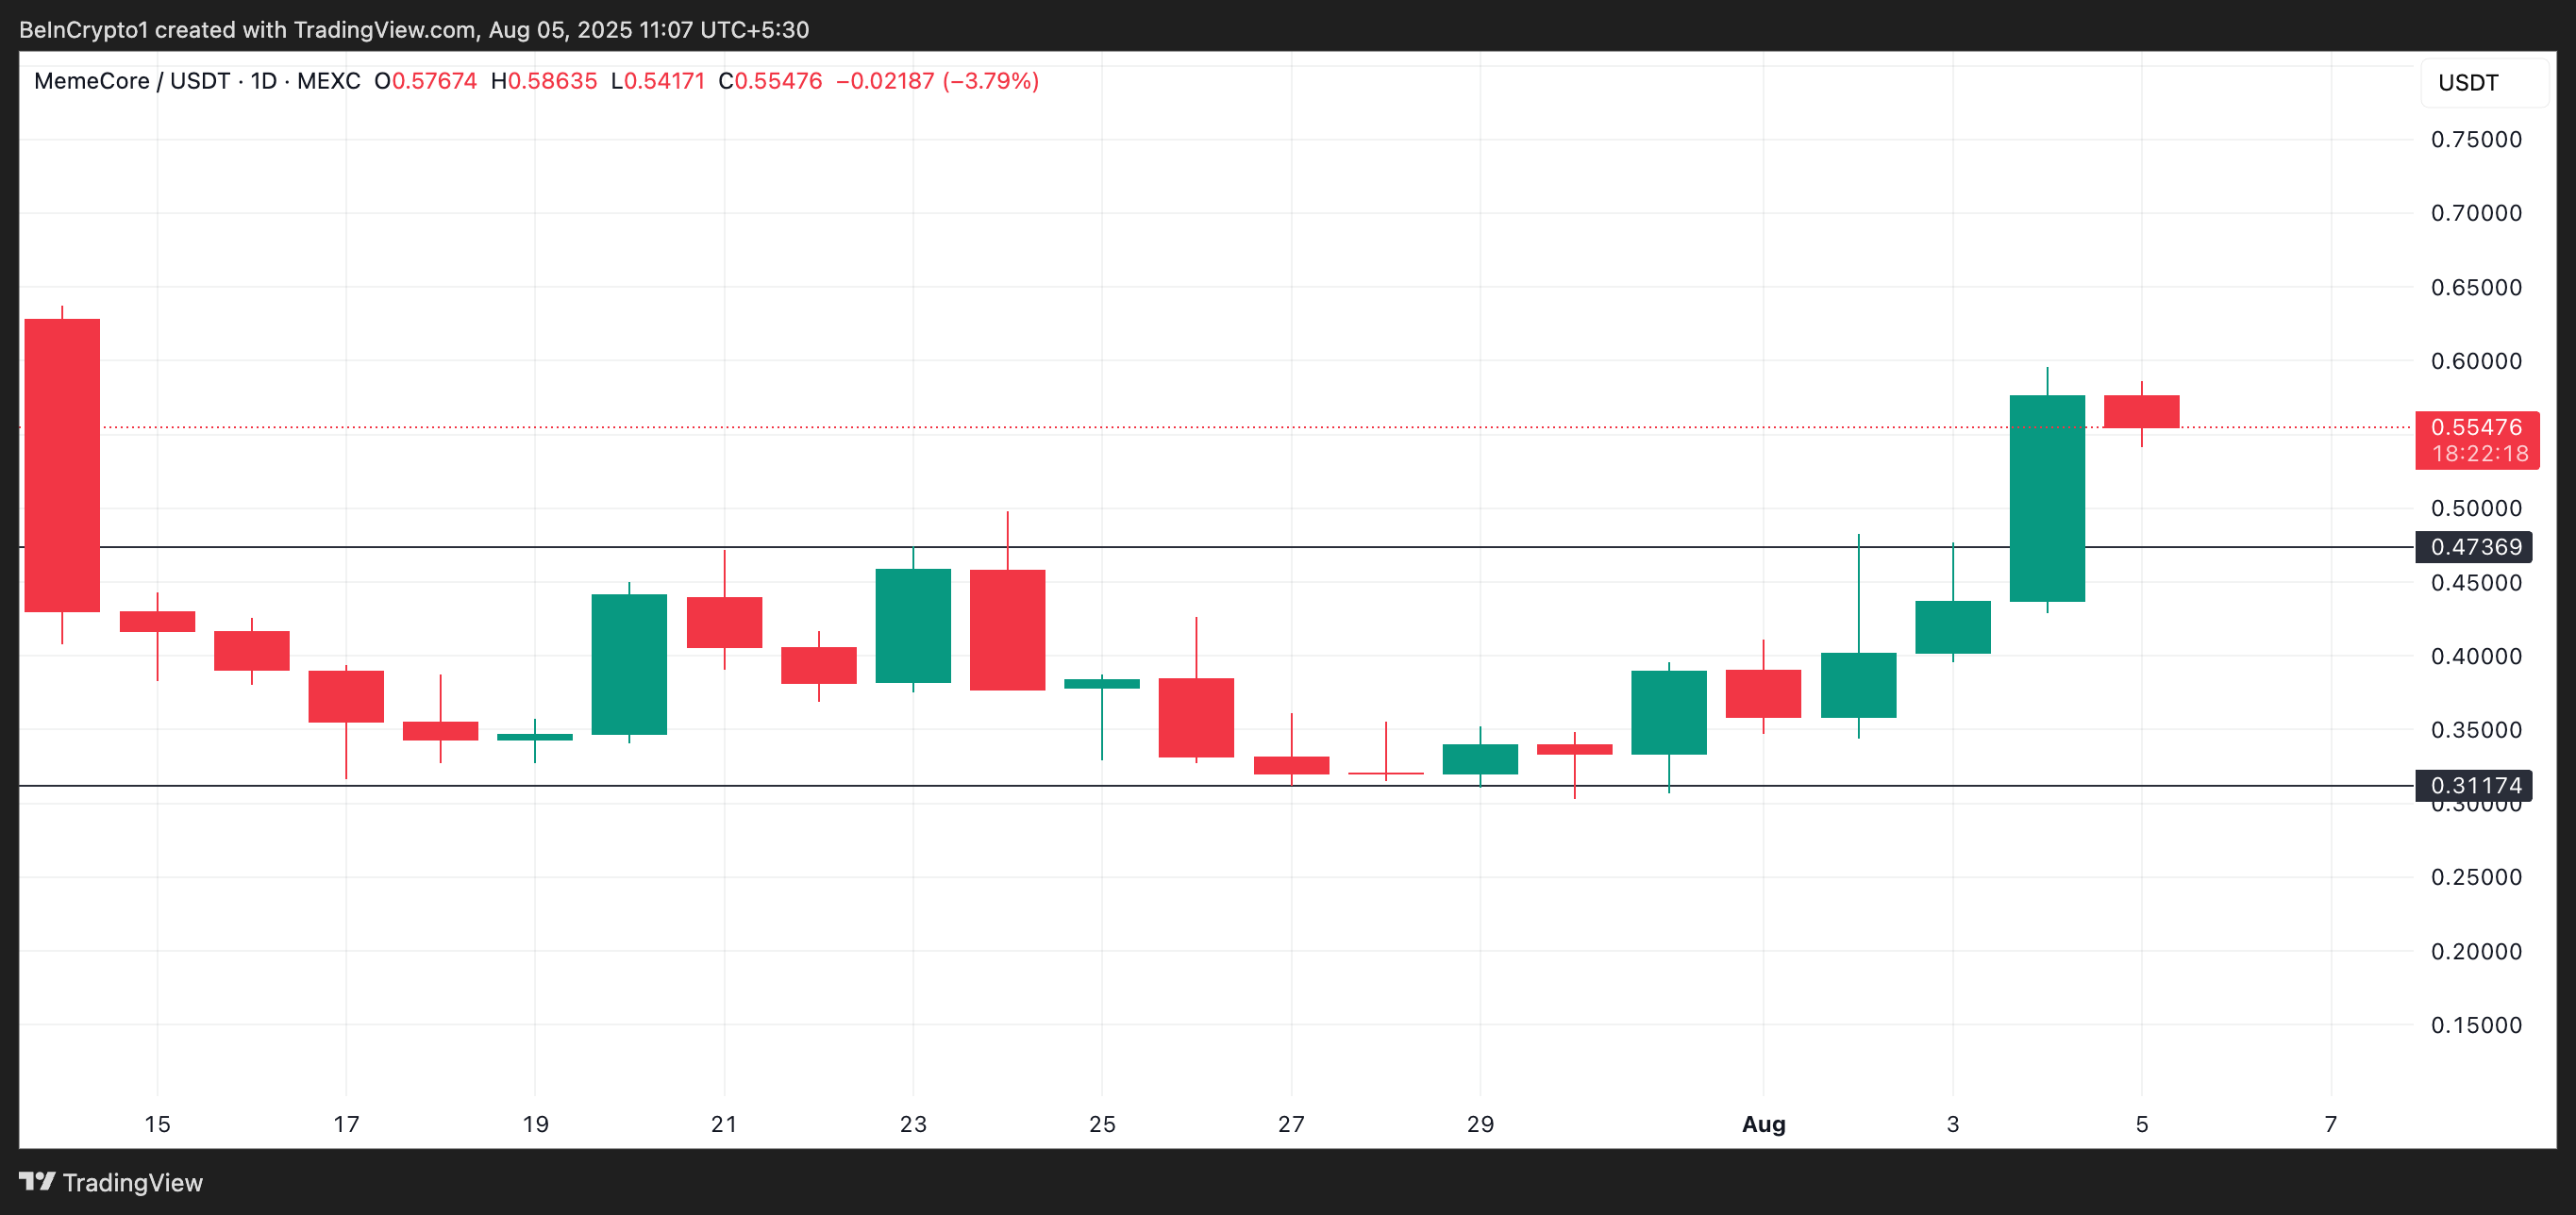
M’s double-digit rally comes after it closed above the narrow trading range that its price traded within between July 15 and August 4. During that period, the altcoin faced resistance at $0.47 while finding firm support at $0.31, creating a tight channel of indecision in the market.
However, a resurgence in new demand has now propelled M above the $0.47 price barrier, signaling a potential shift in sentiment.
For token TA and market updates: Want more token insights like this? Sign up for Editor Harsh Notariya’s Daily Crypto Newsletter here.
On the daily chart, technical indicators like M’s Chaikin Money Flow (CMF), which tracks the flow of capital into and out of the asset, confirm that positive bias may be gaining ground. This adds weight to the case for further upside.
As of this writing, the momentum indicator is at 0.01, having just broken above the zero line. This shift signals that buying pressure is beginning to outweigh selling activity, a pattern that is an early confirmation of bullish momentum.
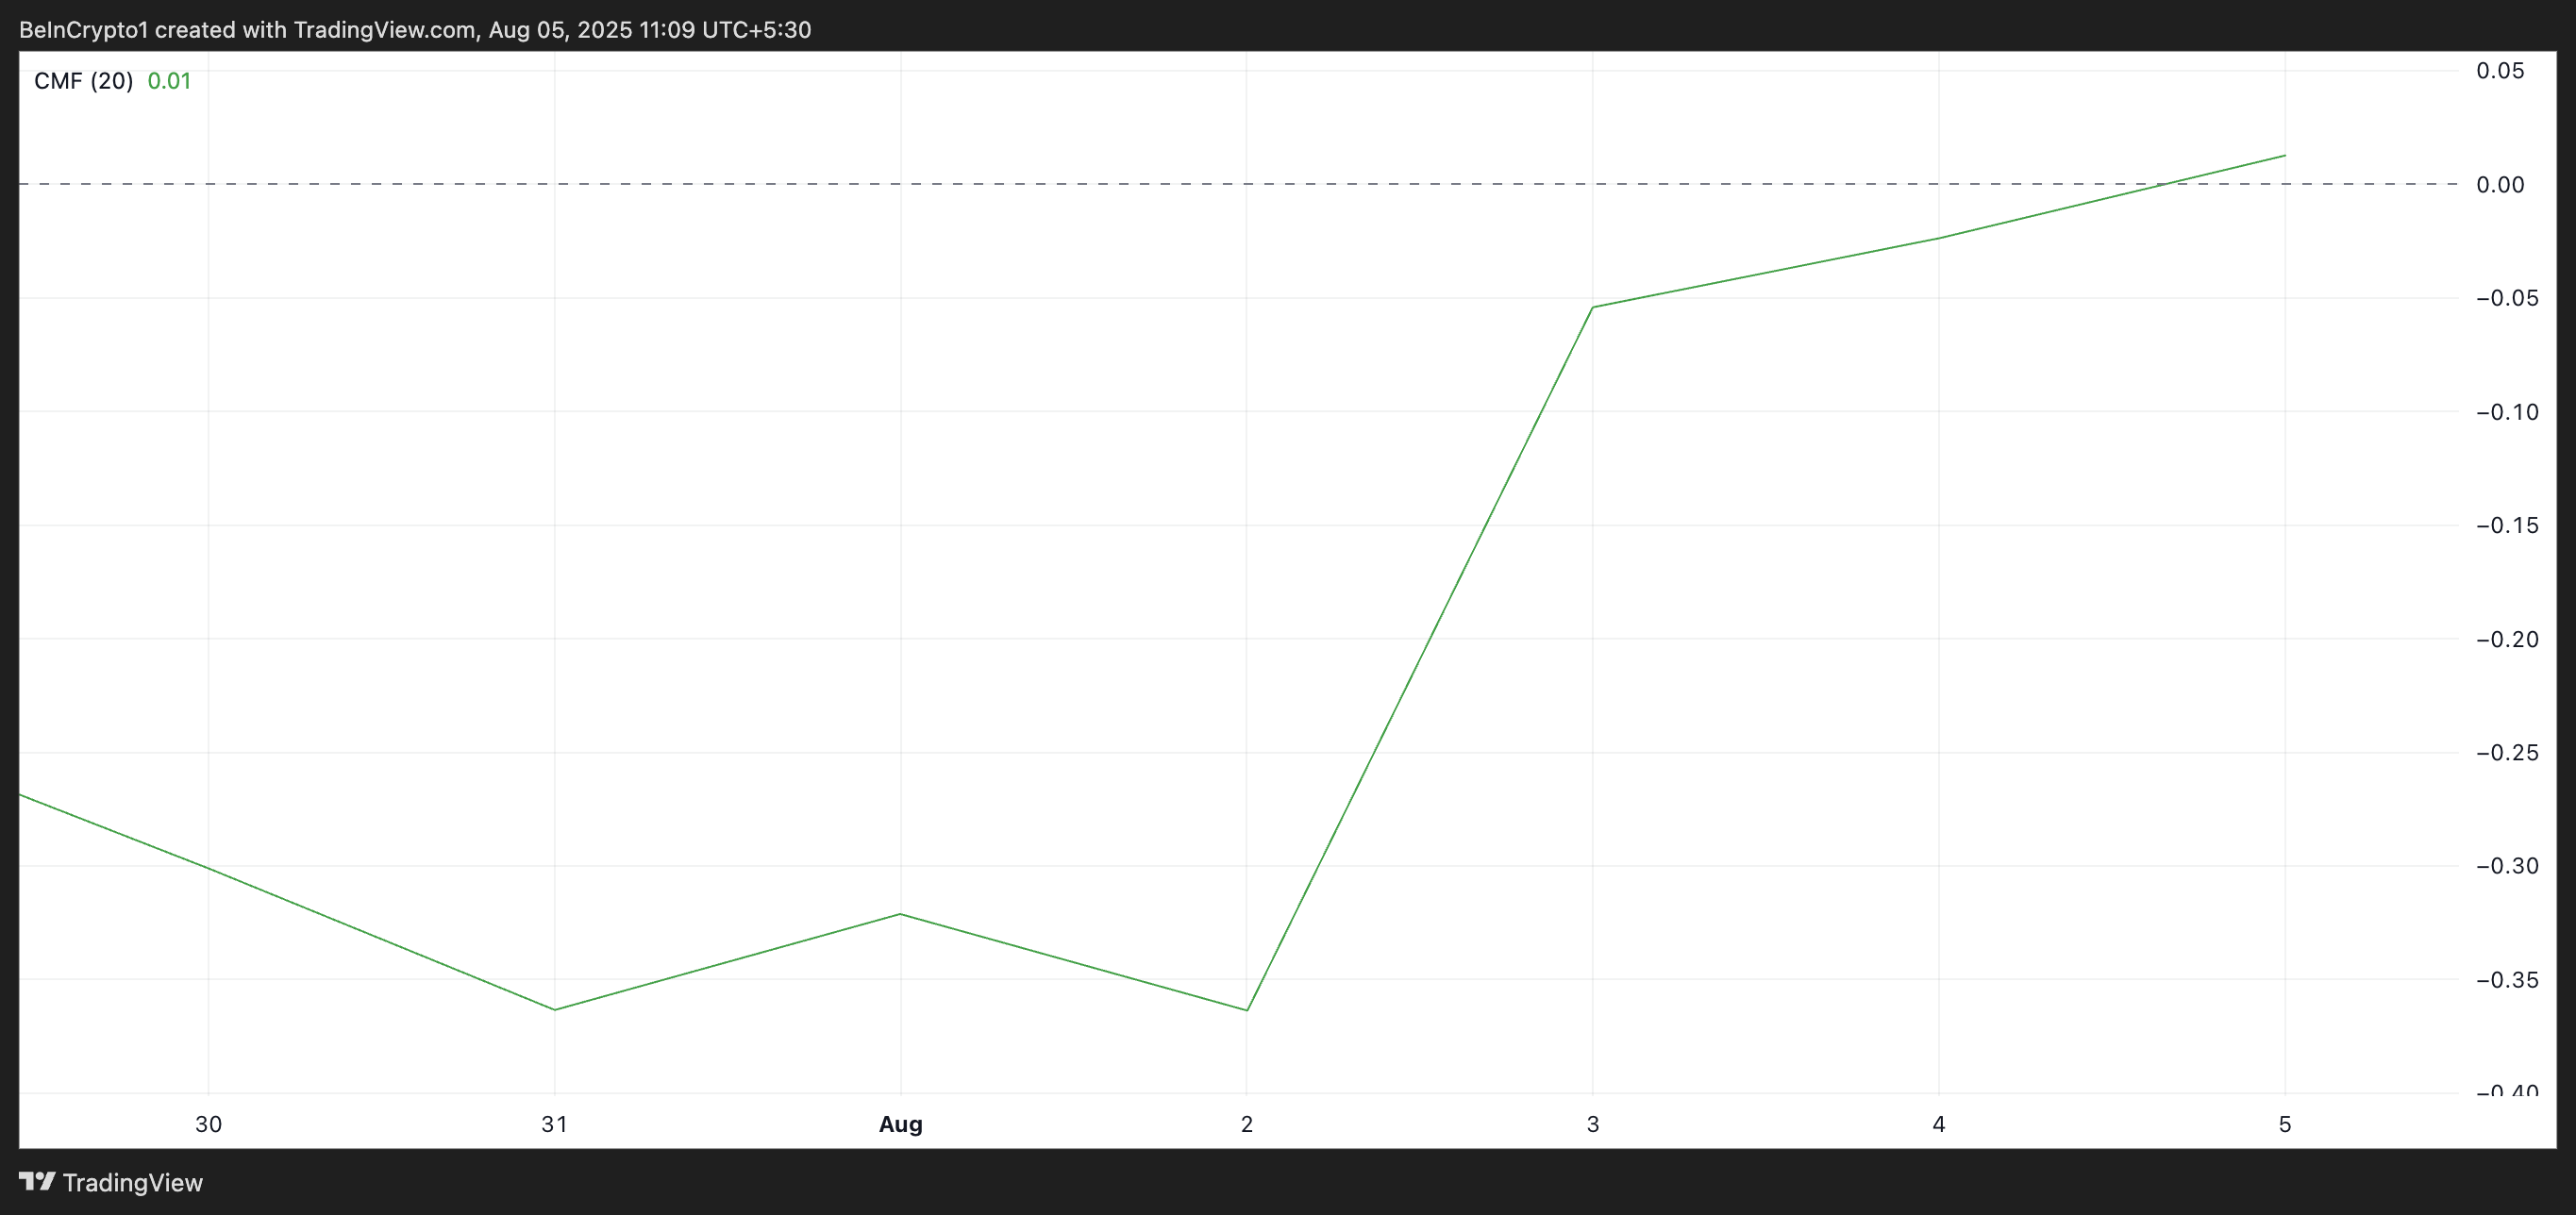
This uptick in money flow could help M maintain its upward trajectory over the next few trading sessions before exhaustion sets in.
Furthermore, M currently trades above its 20-day Exponential Moving Average (EMA), reflecting the buy-side pressure in the market.
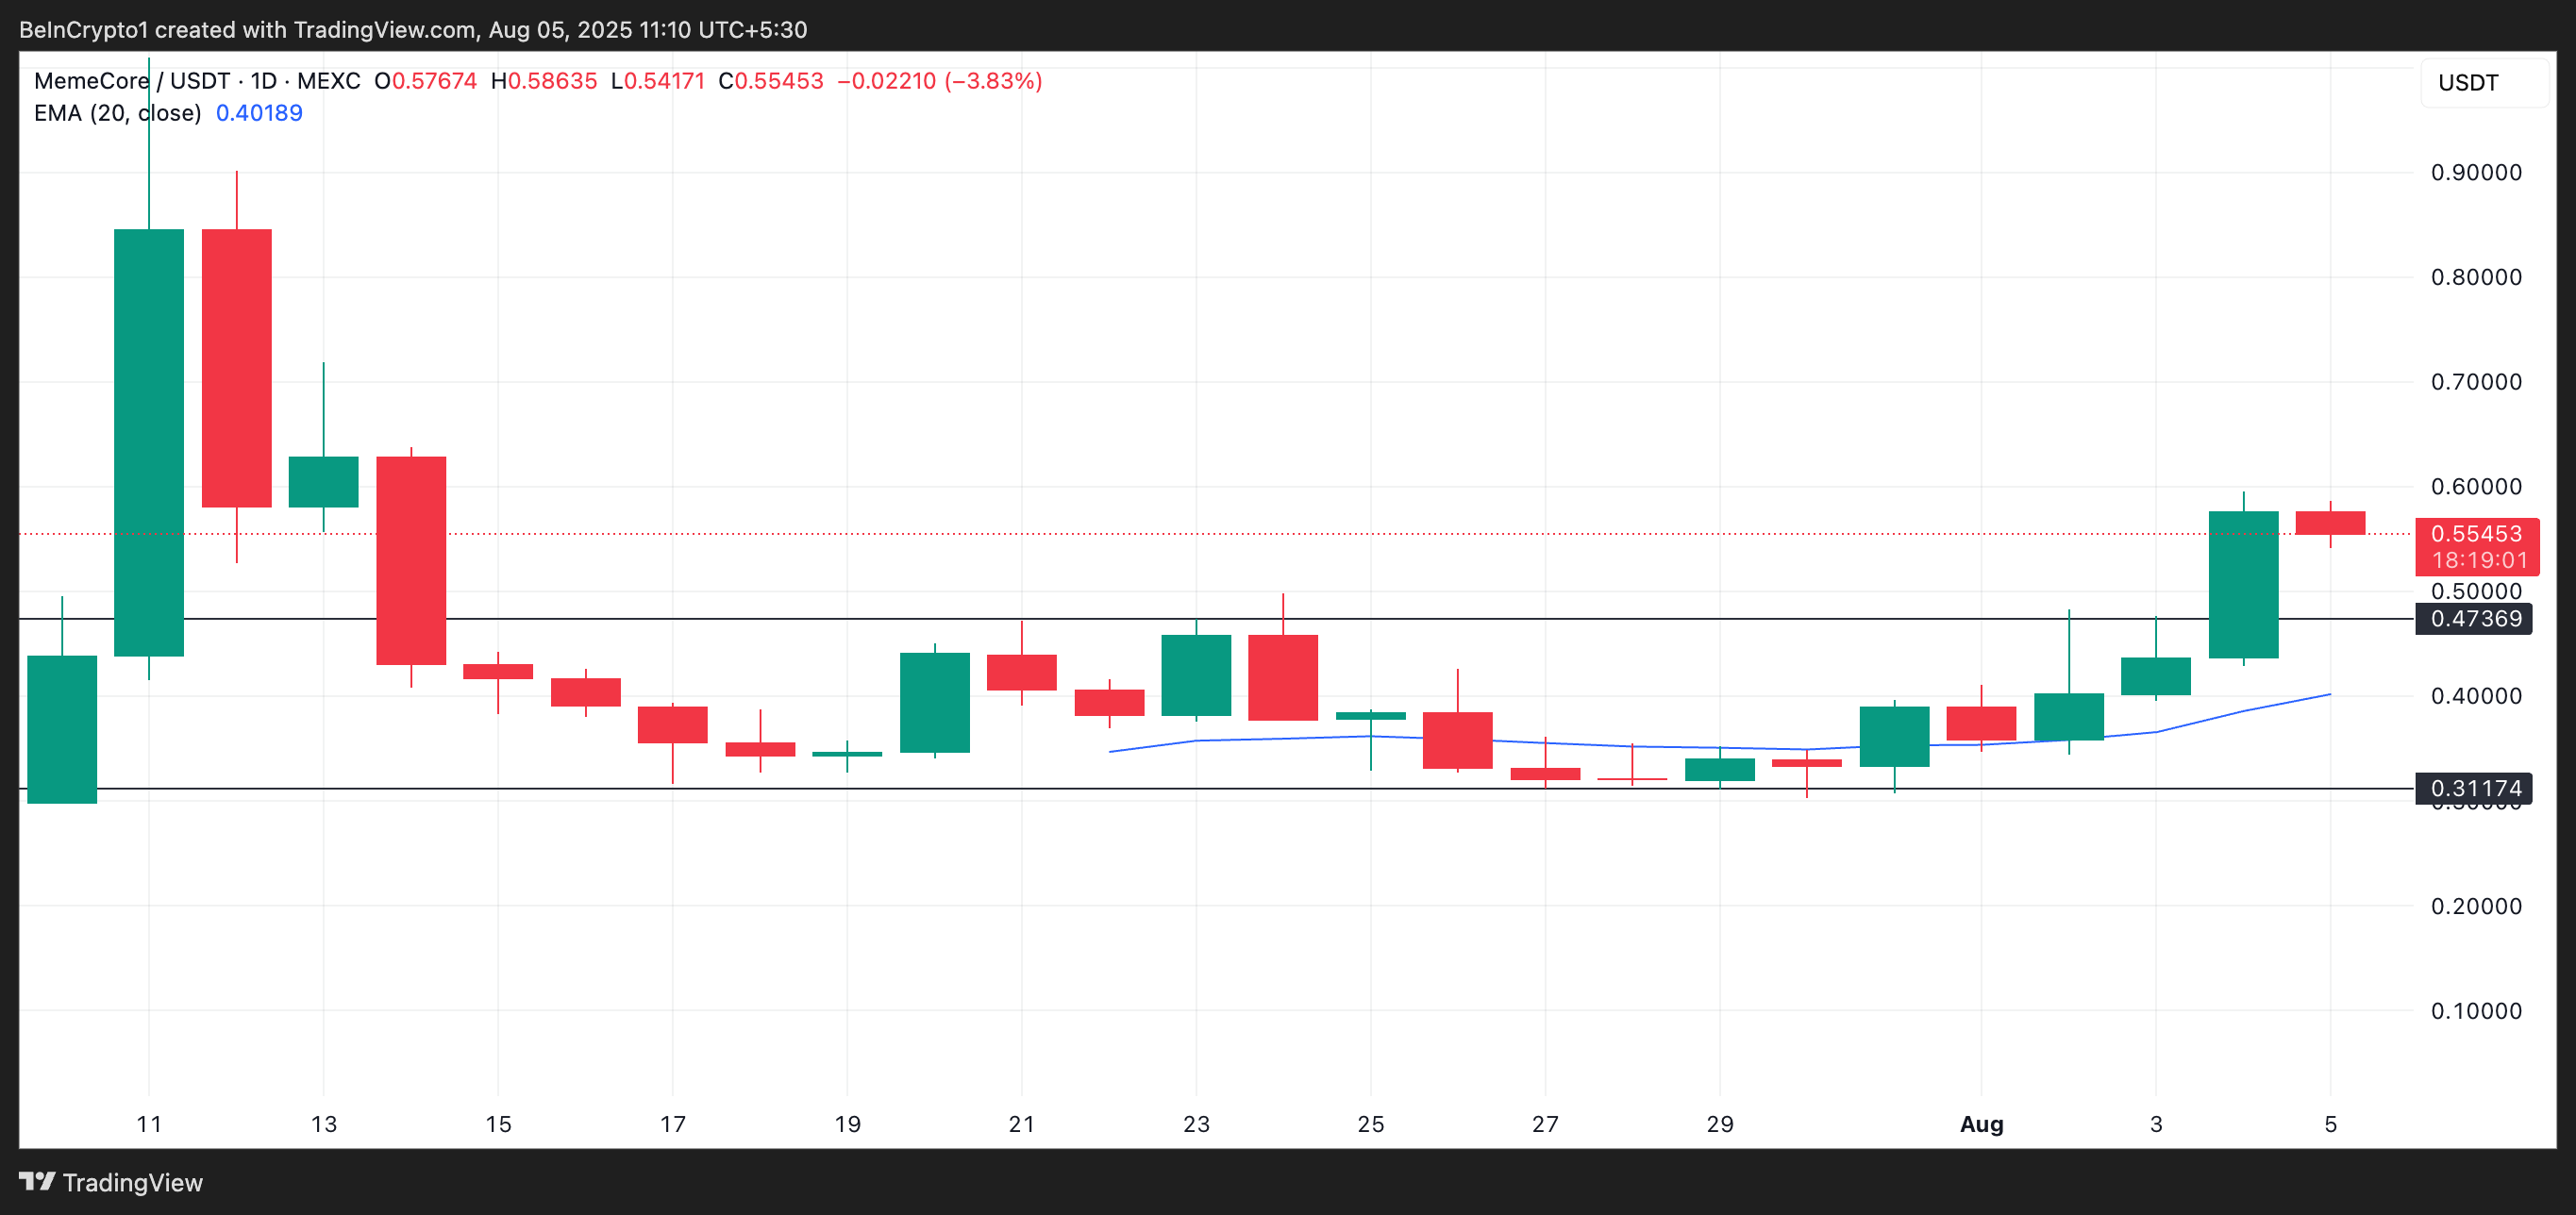
M 20-Day EMA. Source: TradingView
As of this writing, the key moving average forms dynamic support below the coin’s price at $0.40. For context, M currently trades at $0.55.
The 20-day EMA measures an asset’s average price over the past 20 trading days, giving weight to recent prices. When the price trades below the 20-day EMA, it signals increasing distribution and weakening short-term support.
On the other hand, when an asset’s price trades above this level, it means short-term bullish momentum is climbing, buyers are in control, and they can drive further gains.
M Climbs Out of Consolidation, But Can It Stay There?
M’s recent breakout from its sideways pattern marks a shift from consolidation to a potential bullish trend. If accumulation strengthens, the altcoin’s price could climb to $0.63, a high last observed on July 13.
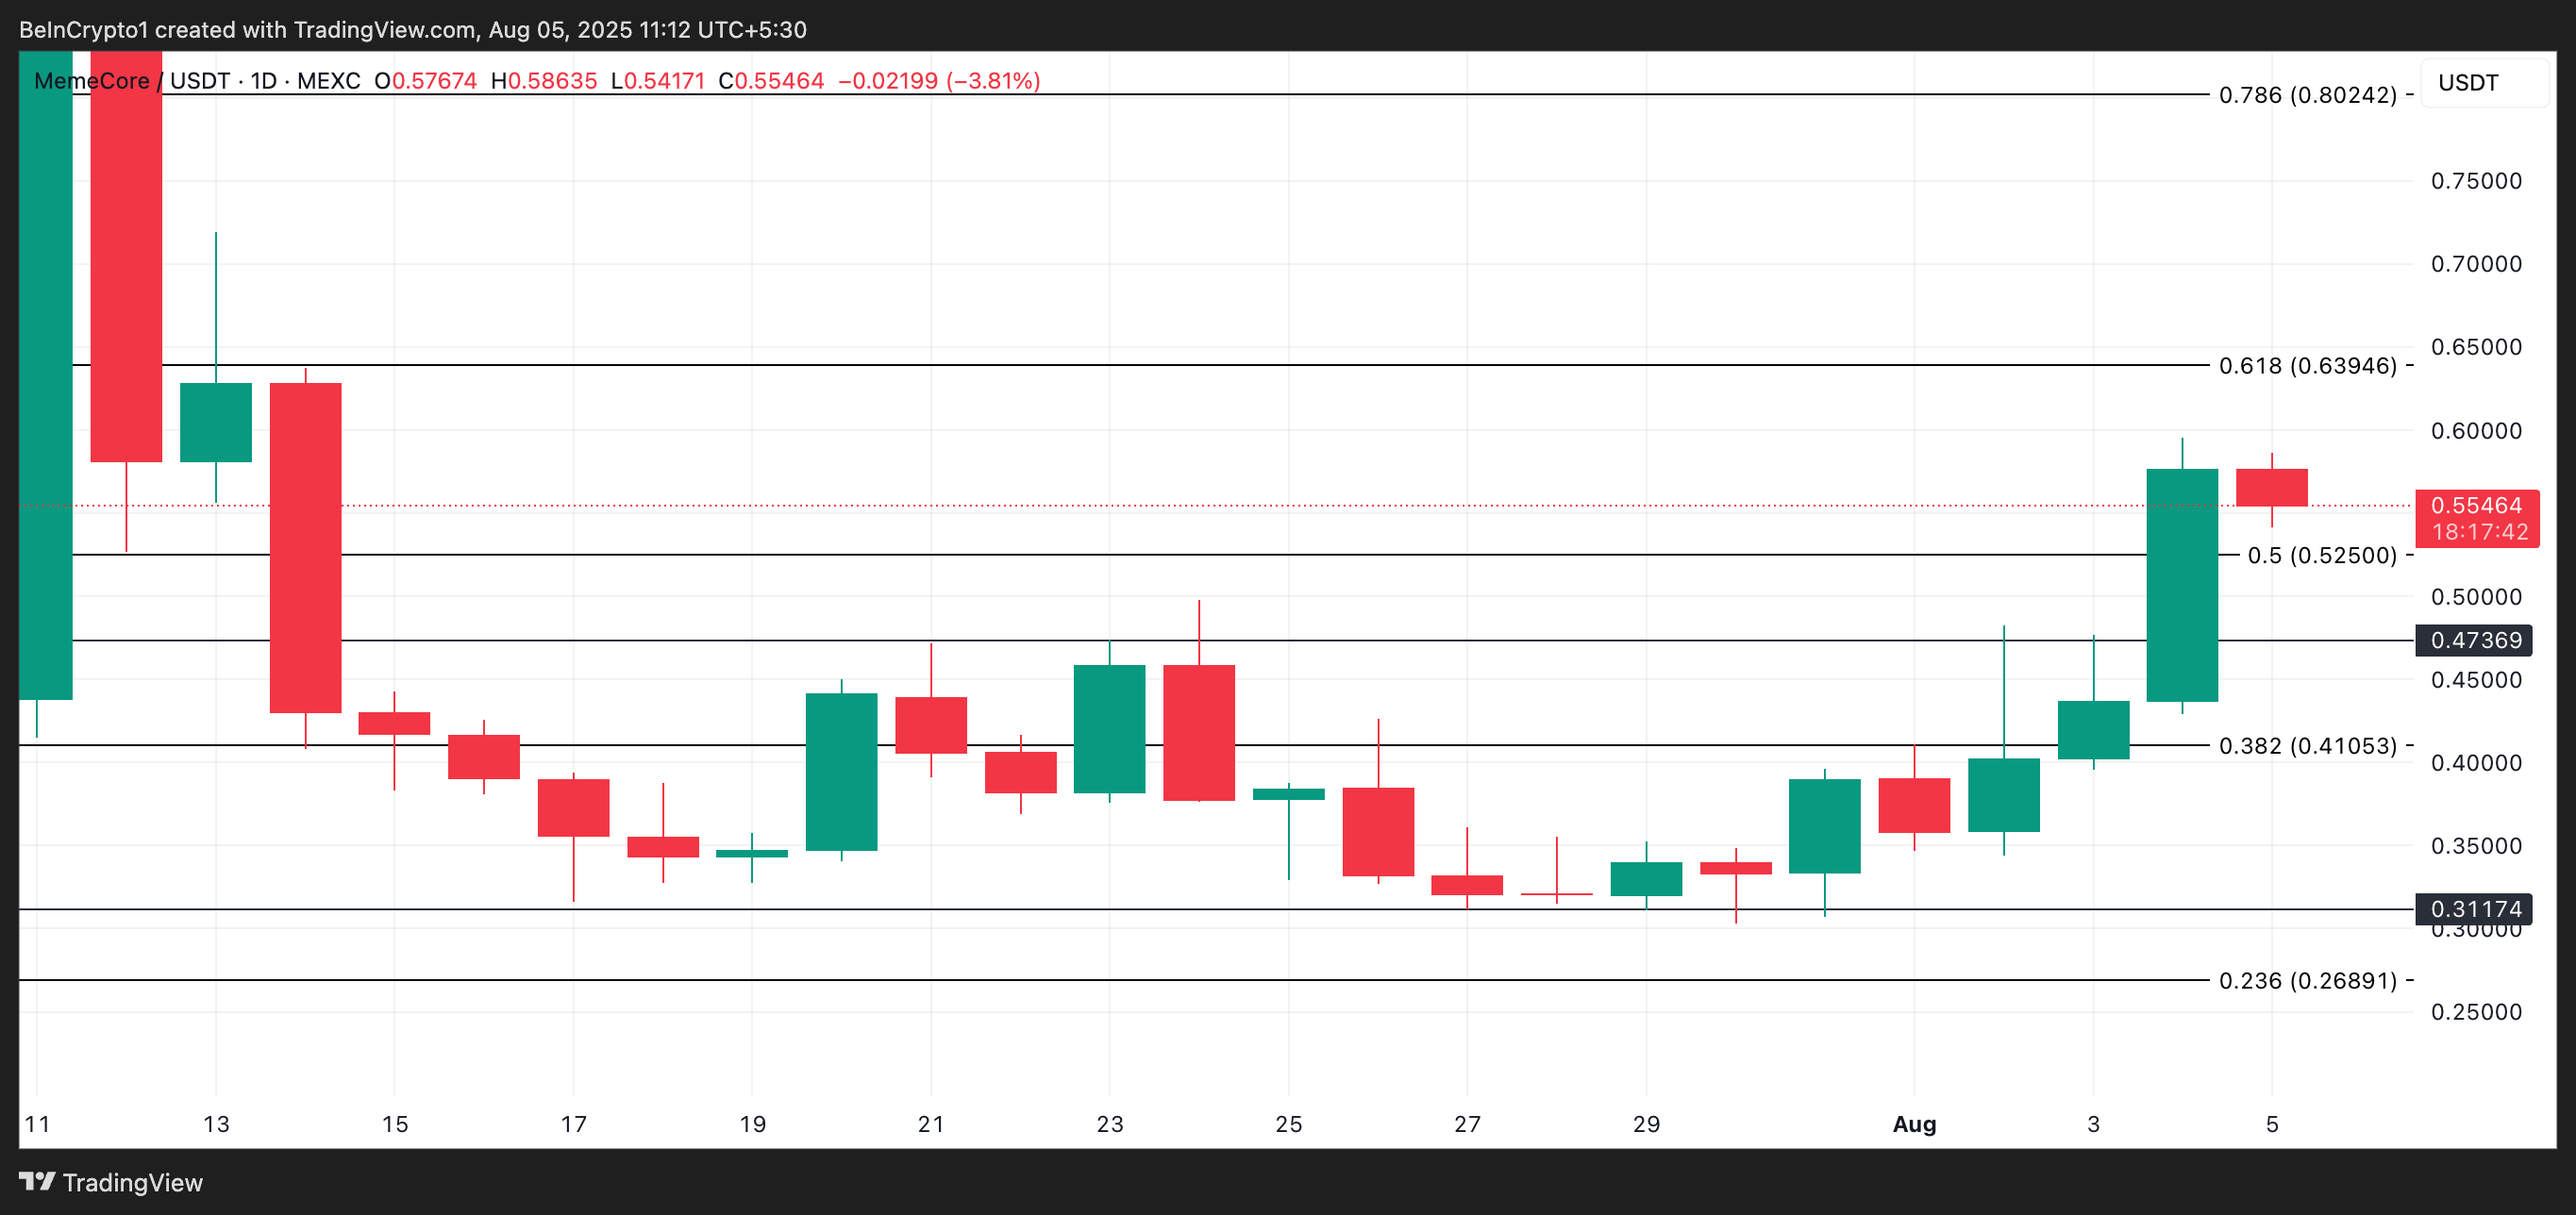
However, if profit-taking activity resumes, this bullish outlook would be invalidated. In that scenario, the M’s price could shed some of its recent gains, break below $0.52, and attempt to fall back within the narrow range.
