


Be[in]Crypto takes a look at the Mayer Multiple (MM) and its components. This is done with the aim of determining whether the long-term Bitcoin (BTC) bias is bullish or bearish.
200-day BTC moving average
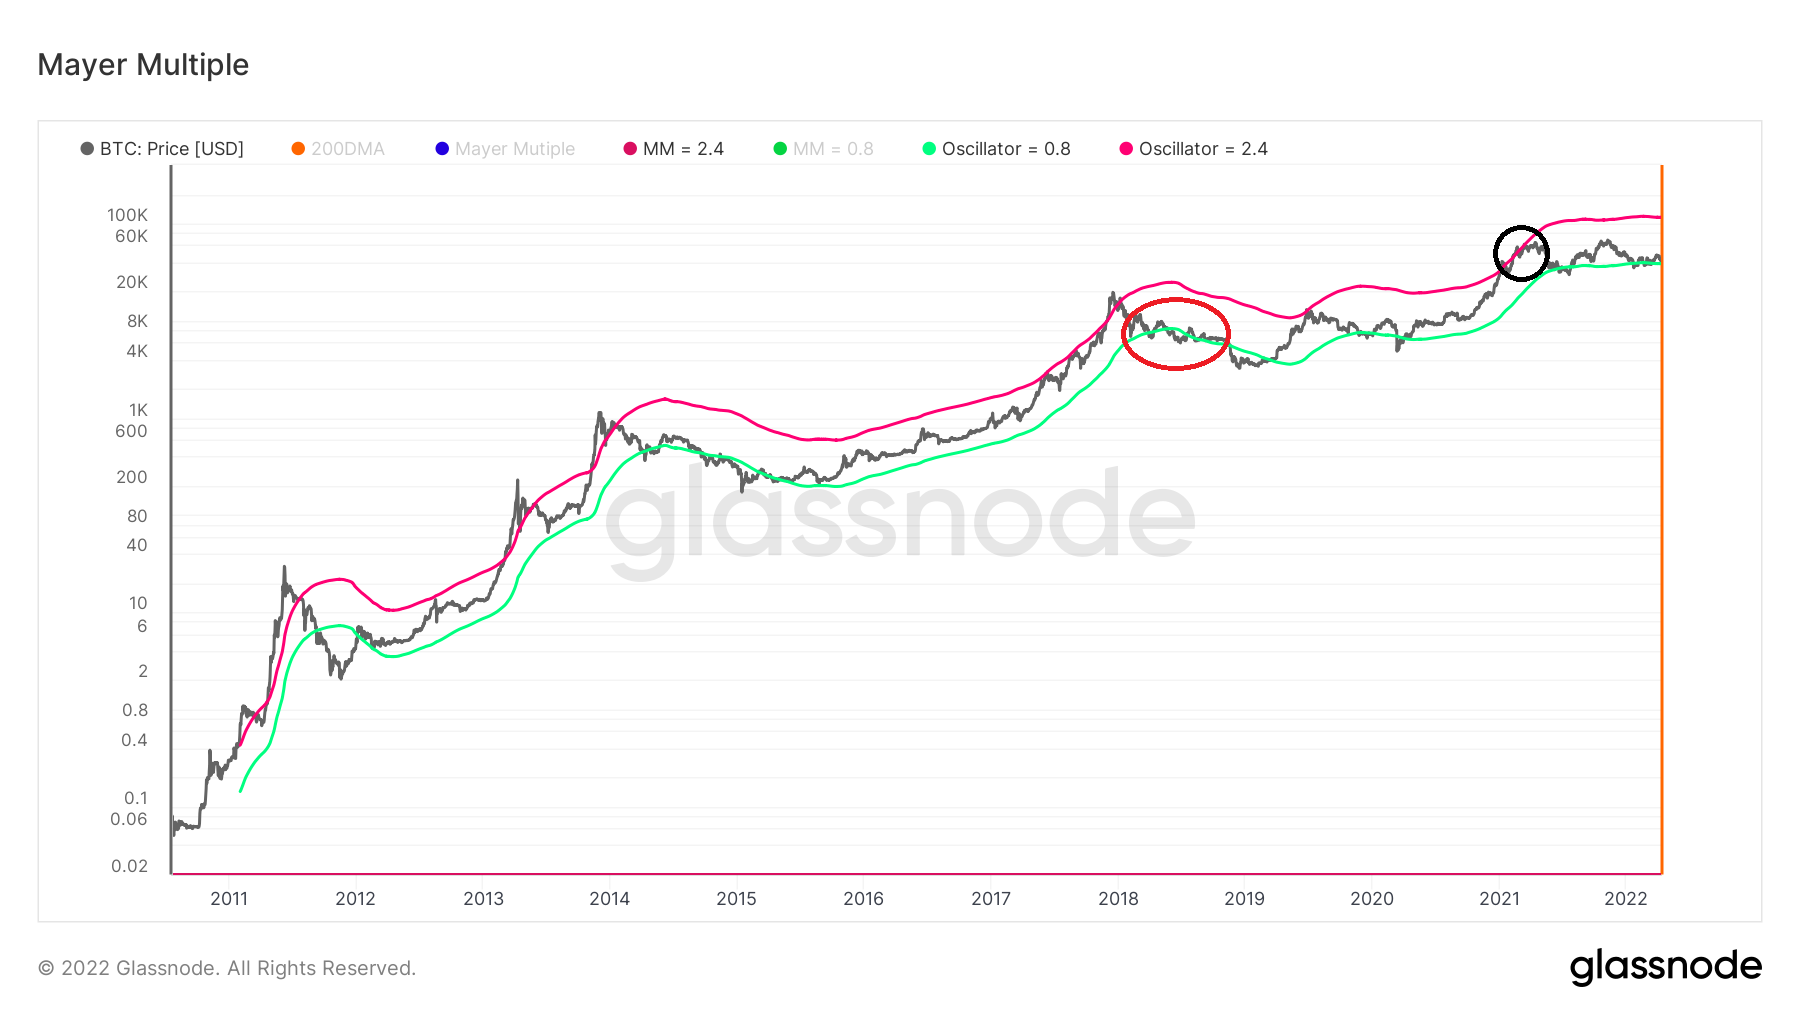
The Mayer Multiple is a BTC on-chain indicator. It uses the ratio between the price of BTC and its 200-day moving average (MA), in order to determine the trend.
In order to determine cycle tops, the 2.4 multiplication of this MA (purple) is used. Conversely, the 0.8 multiplication (green) is used to determine cycle tops.
So far, the price has moved above this MA during every cycle top. However, it sometimes does so just prior to the top, as was the case in Feb last year (black circle). At the time, BTC just moved above $50,000. However, the actual top was reached closer to $60,000.
Conversely, BTC bottoms are not as accurately determined as tops. While in each bottom BTC has indeed moved below the 0.8 multiplication line, it sometimes hovers below it for a long time prior to reaching a bottom. This was the case in 2018 (red circle) when the price hovered above and below the line several times.
Mayer Multiple
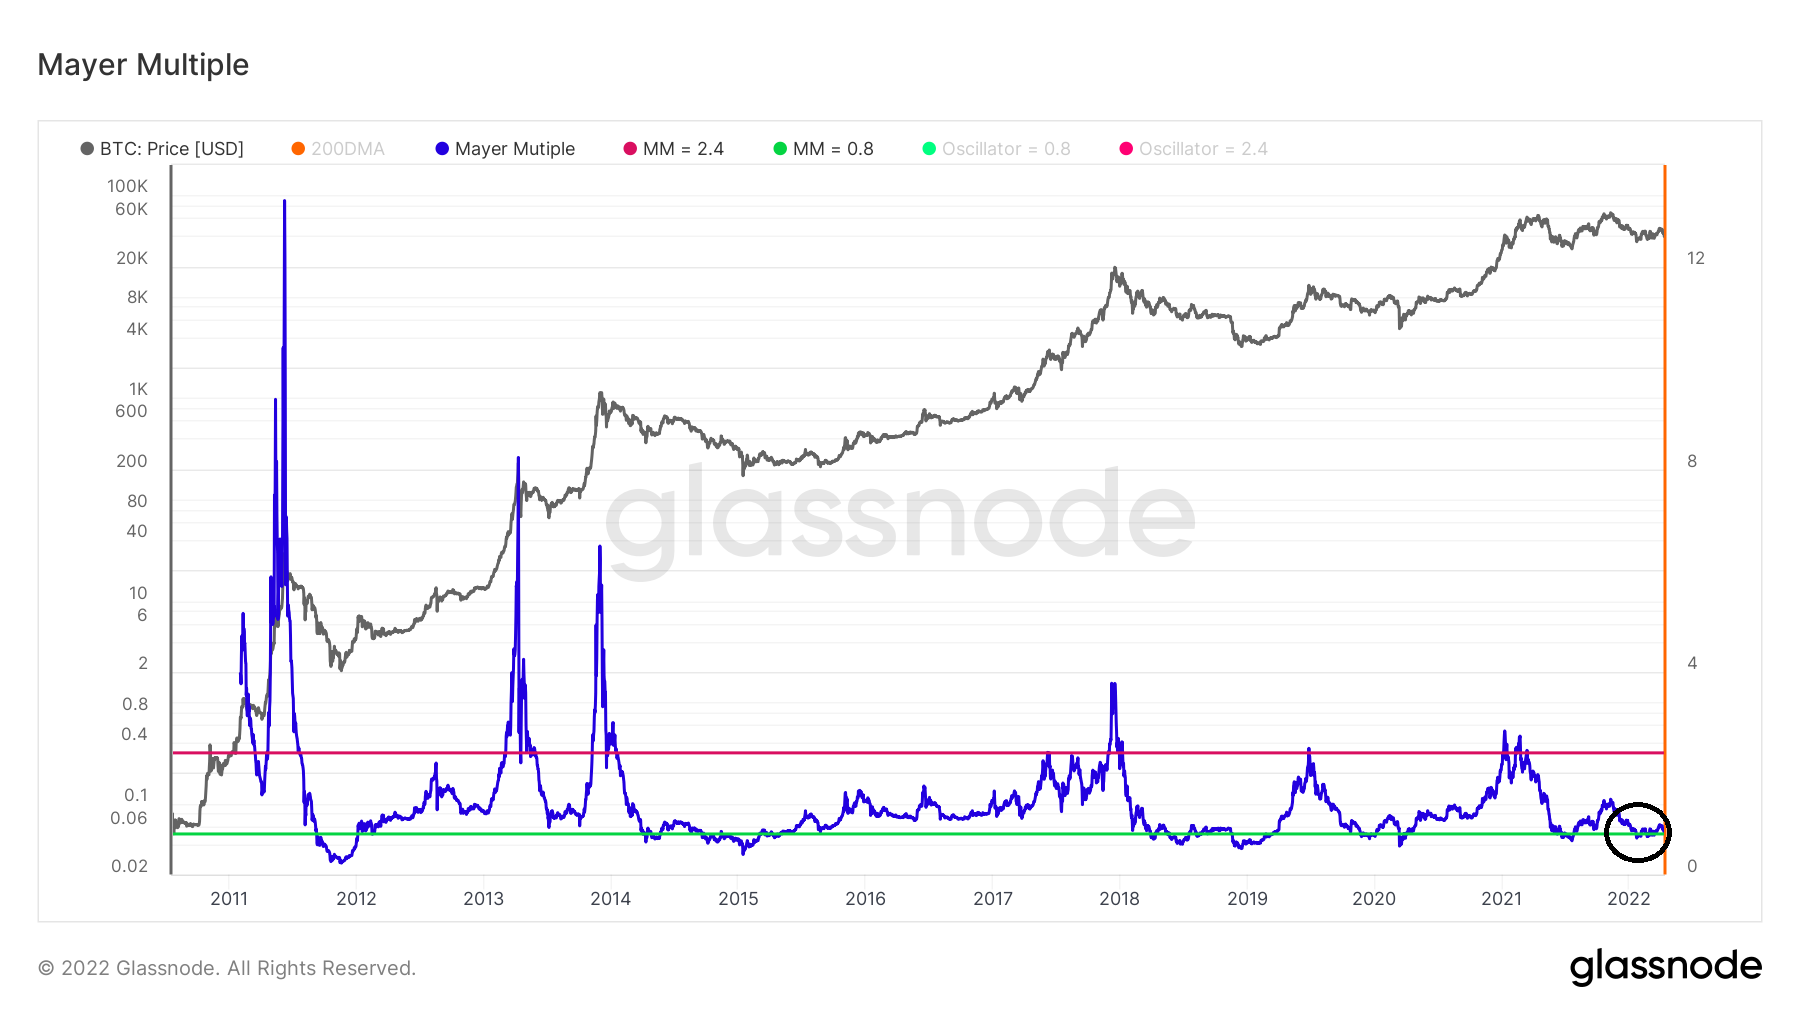
Afterward, the actual Mayer Multiple MM reading is plotted as a line (blue), with horizontal multiples of 0.8 (green) and 2.4 (red) acting as the lower and upper bounds.
The relationship between MM and its 0.8 oscillator is similar to the BTC price and its oscillator. Therefore, market bottoms have coincided with a MM decrease below its 0.8 oscillator.
This occurred this month (black circle).
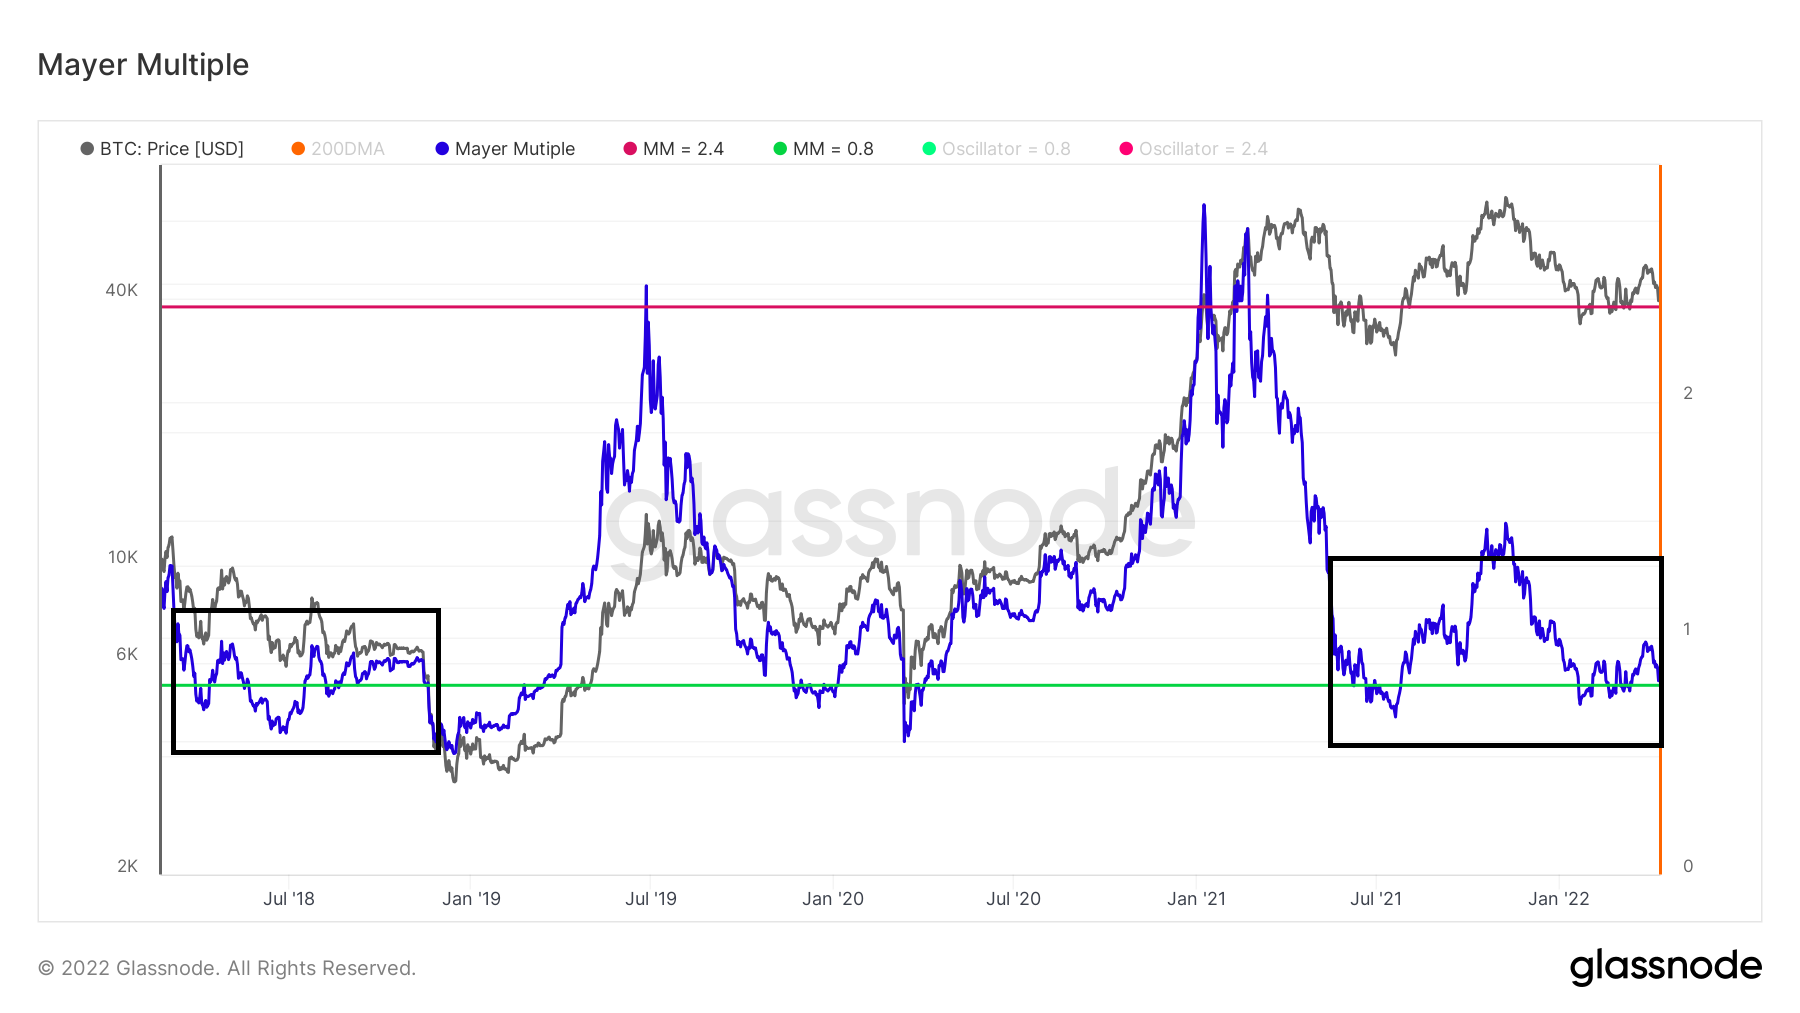
There are similarities between the current movement and that of July 2018 (black rectangle). In both cases, MM hovered just above its 0.8 multiple for an extended period of time.
However, in 2018, the BTC price eventually broke down and led to the Dec 2018 bottom. Therefore, if MM fails to hold on above the 0.8 oscillator, it could lead to another descent.
Conclusion
To conclude, MM reclaimed the 0.8 oscillator after initially falling below it. This has historically been a sign of market bottoms.
However, if MM falls below it again, it could mean that BTC is in a bear market instead.
For Be[in]Crypto’s latest Bitcoin (BTC) analysis, click here


