
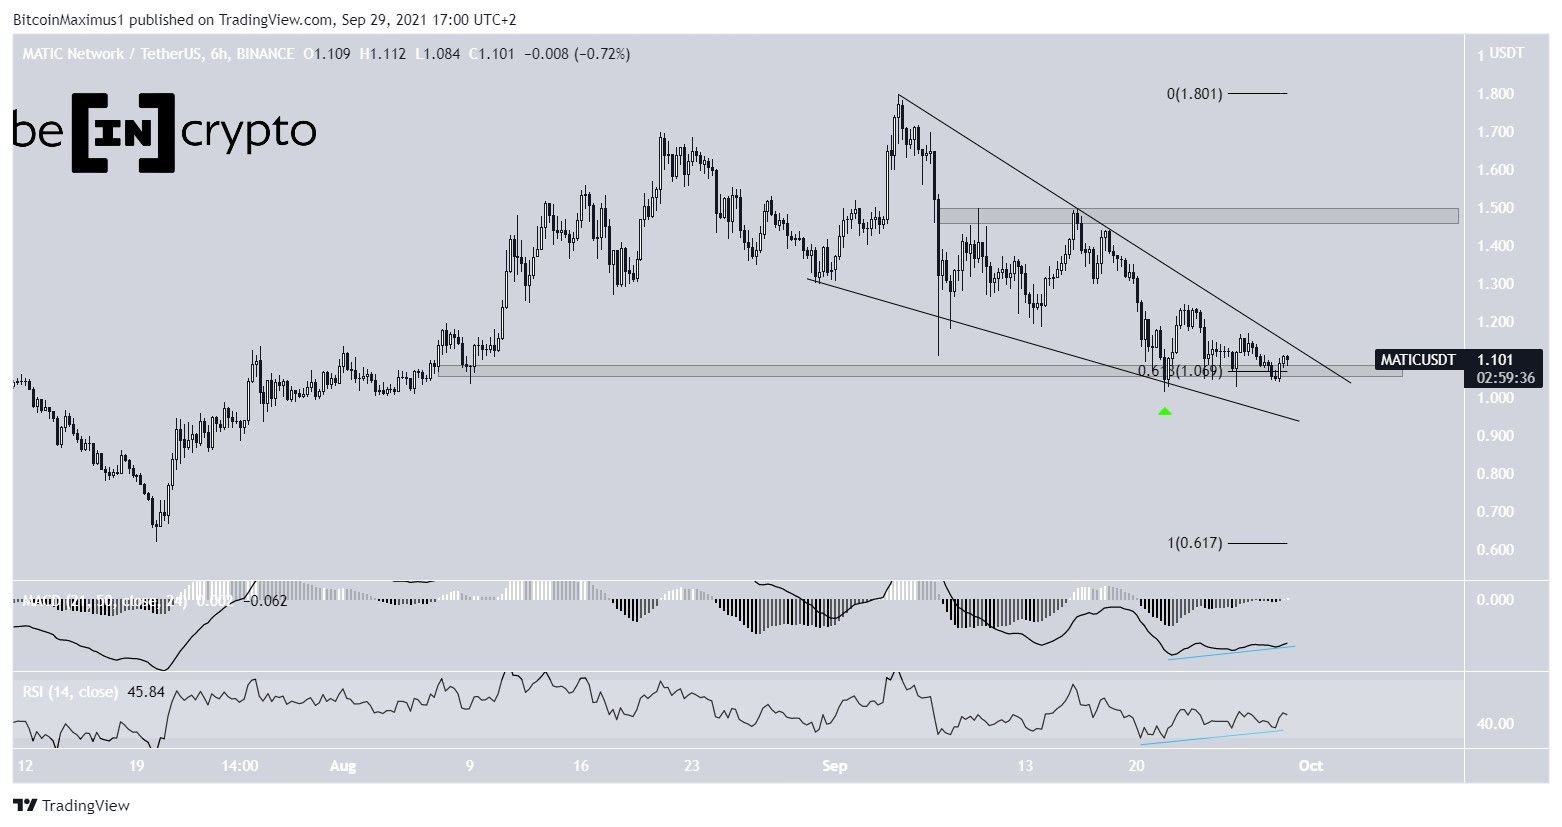
Polygon (MATIC) is trading inside a descending wedge and has bounced at the $1.07 support area.
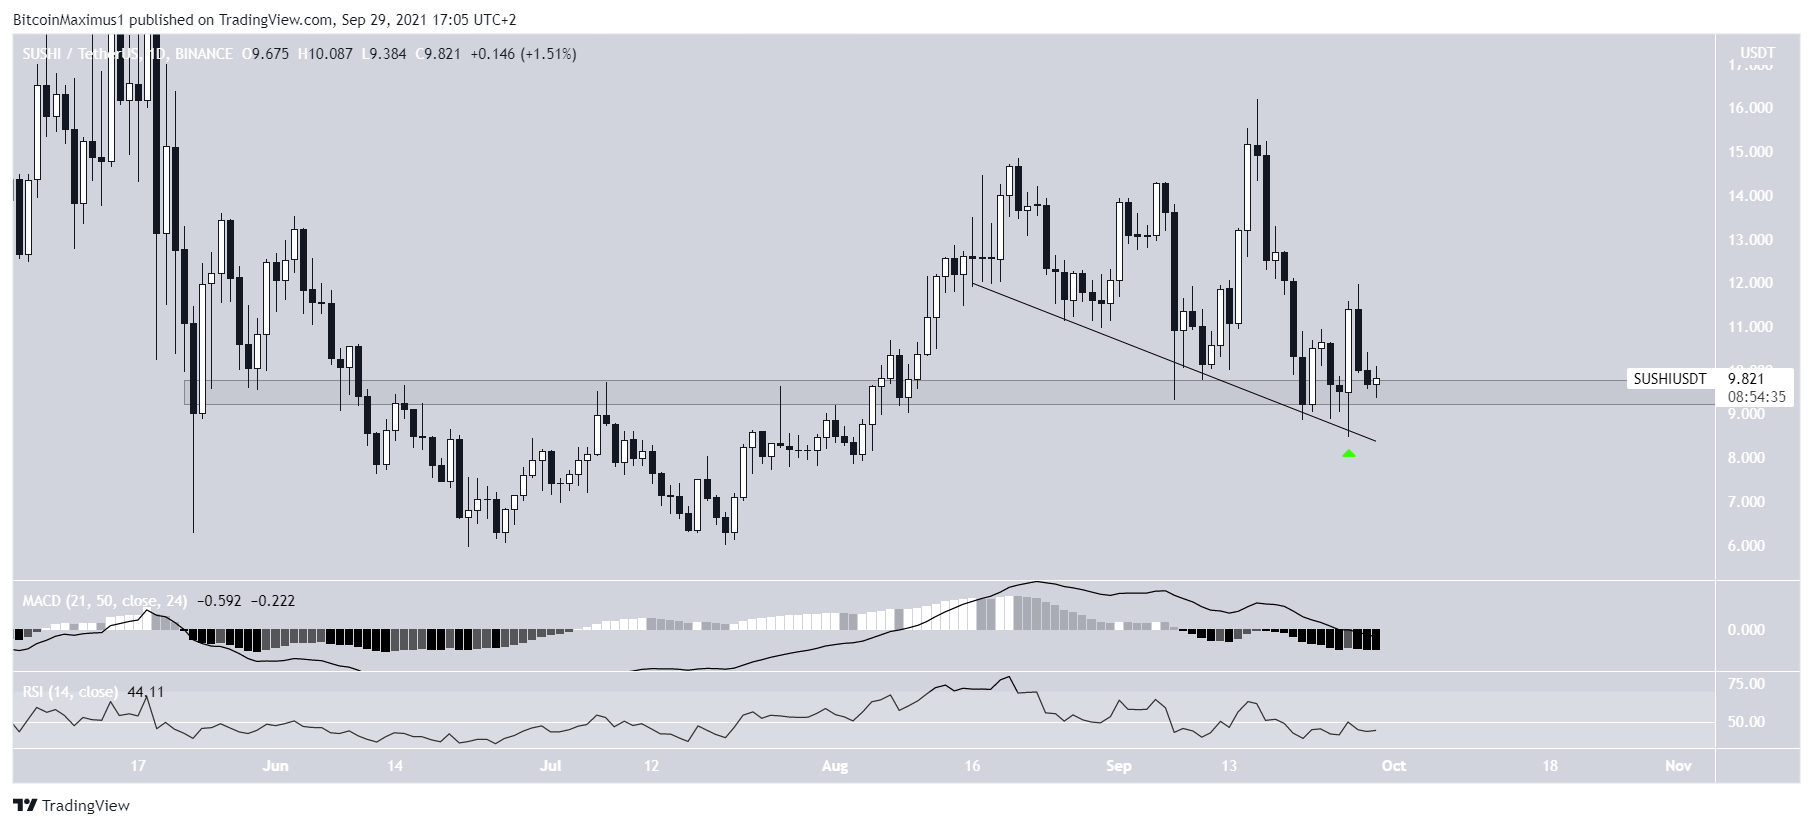
SushiSwap (SUSHI) is following a descending support line and has bounced at the $9.50 horizontal support area.
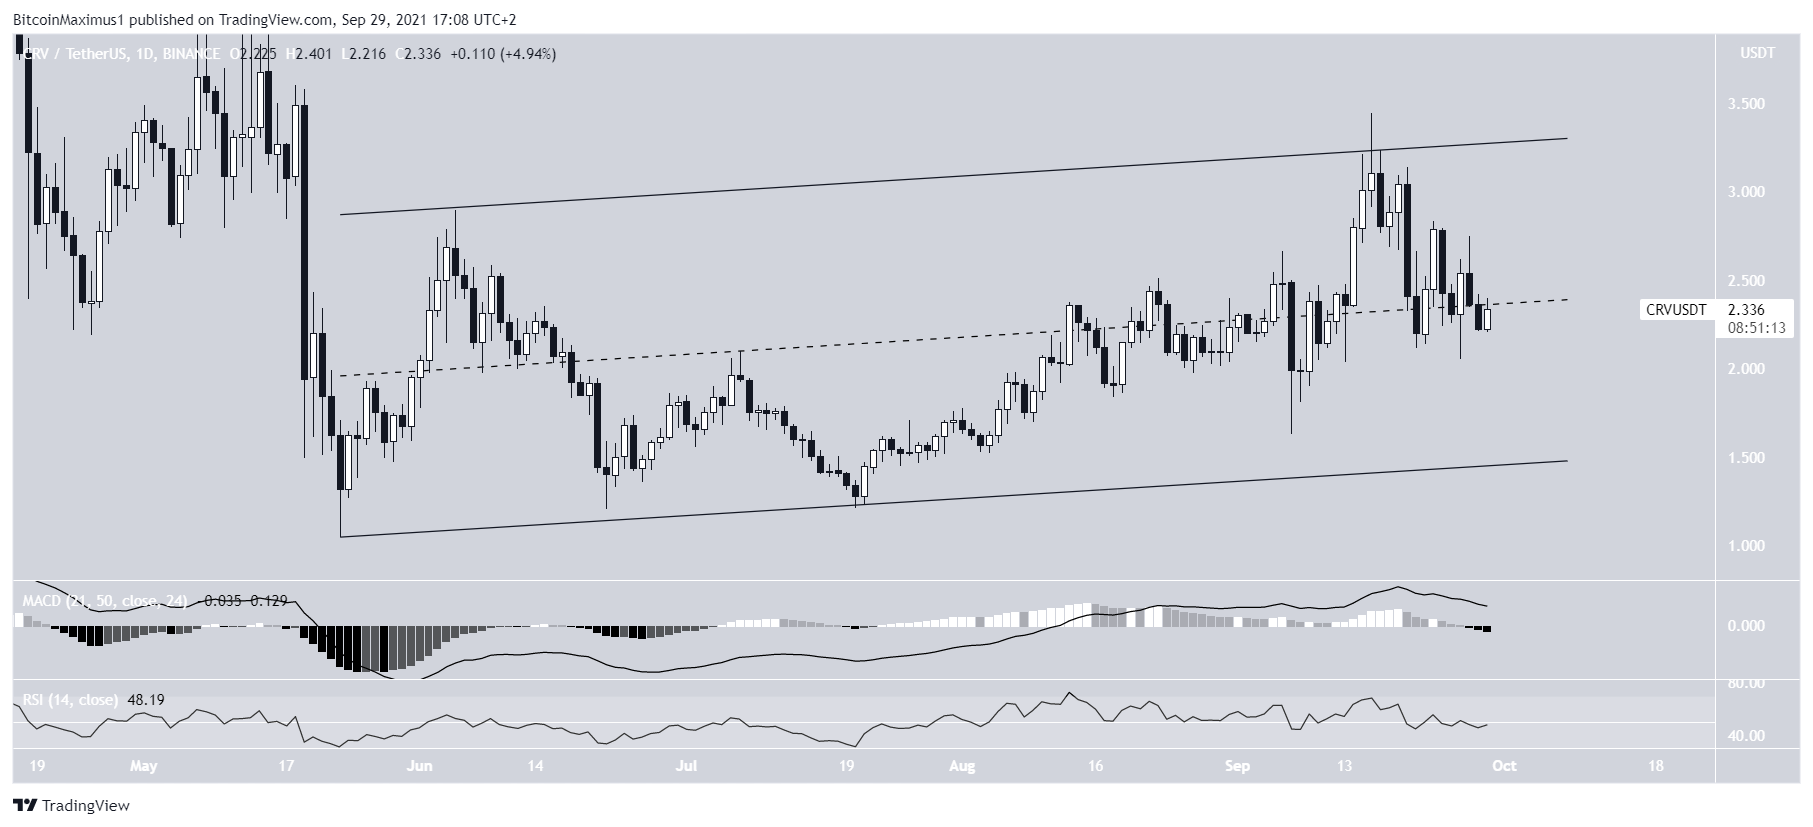
Curve DAO Token (CRV) is trading inside a long-term ascending parallel channel.
MATIC
MATIC increased in the period from July 20 to Sept 5, reaching a high of $1.8. However, it has been moving downwards since.
Nevertheless, the decrease has taken the shape of a descending wedge, which is considered a bullish pattern.
Furthermore, the token has bounced at a confluence of support levels (green icon), created by the 0.618 Fib retracement support level, the support line of the wedge and a horizontal support area.
In this area, both the RSI and MACD have generated bullish divergences. Therefore, a breakout would be likely.
If one occurs, the closest resistance would be at $1.48.
Highlights
- MATIC is trading inside a descending wedge.
- There is support at $1.07.
SUSHI
SUSHI has been moving downwards since Sept 16, when it had reached a high of $16.20. The ensuing drop took it to a low of $8.50.
On Sept 26, it bounced (green icon) at both the support line and $9.50 horizontal support area, creating a bullish engulfing candlestick in the process.
However, despite the bounce, technical indicators are neutral.
Therefore, while the price action resembles a bullish re-test, indicators fail to confirm this possibility.
Highlights
- SUSHI is following a descending support line.
- There is horizontal support at $9.50.
CRV
CRV has been increasing in a long-term ascending parallel channel since May 23. Most recently, it was rejected by its resistance line on Sept 16. It has been moving downwards since.
Currently, it is trading in the middle of the channel. Whether it reclaims this line or gets rejected from it will be a major determinant in the direction of the future trend.
However, the MACD and RSI are decreasing, indicating that the trend is bearish.
Therefore, the most likely scenario would be a drop to the middle of the channel and potential breakdown.
Highlights
- CRV is trading inside a long-term ascending parallel channel.
- Daily time-frame indicators are bearish.
For BeInCrypto’s latest Bitcoin (BTC) analysis, click here.
What do you think about this subject? Write to us and tell us!
