


Polygon (MATIC) has been following a descending resistance line since reaching an all-time high price on May 18.
While the token has bounced at a horizontal support area, the trend cannot be considered bullish until a breakout from the resistance line occurs.
Ongoing MATIC descent
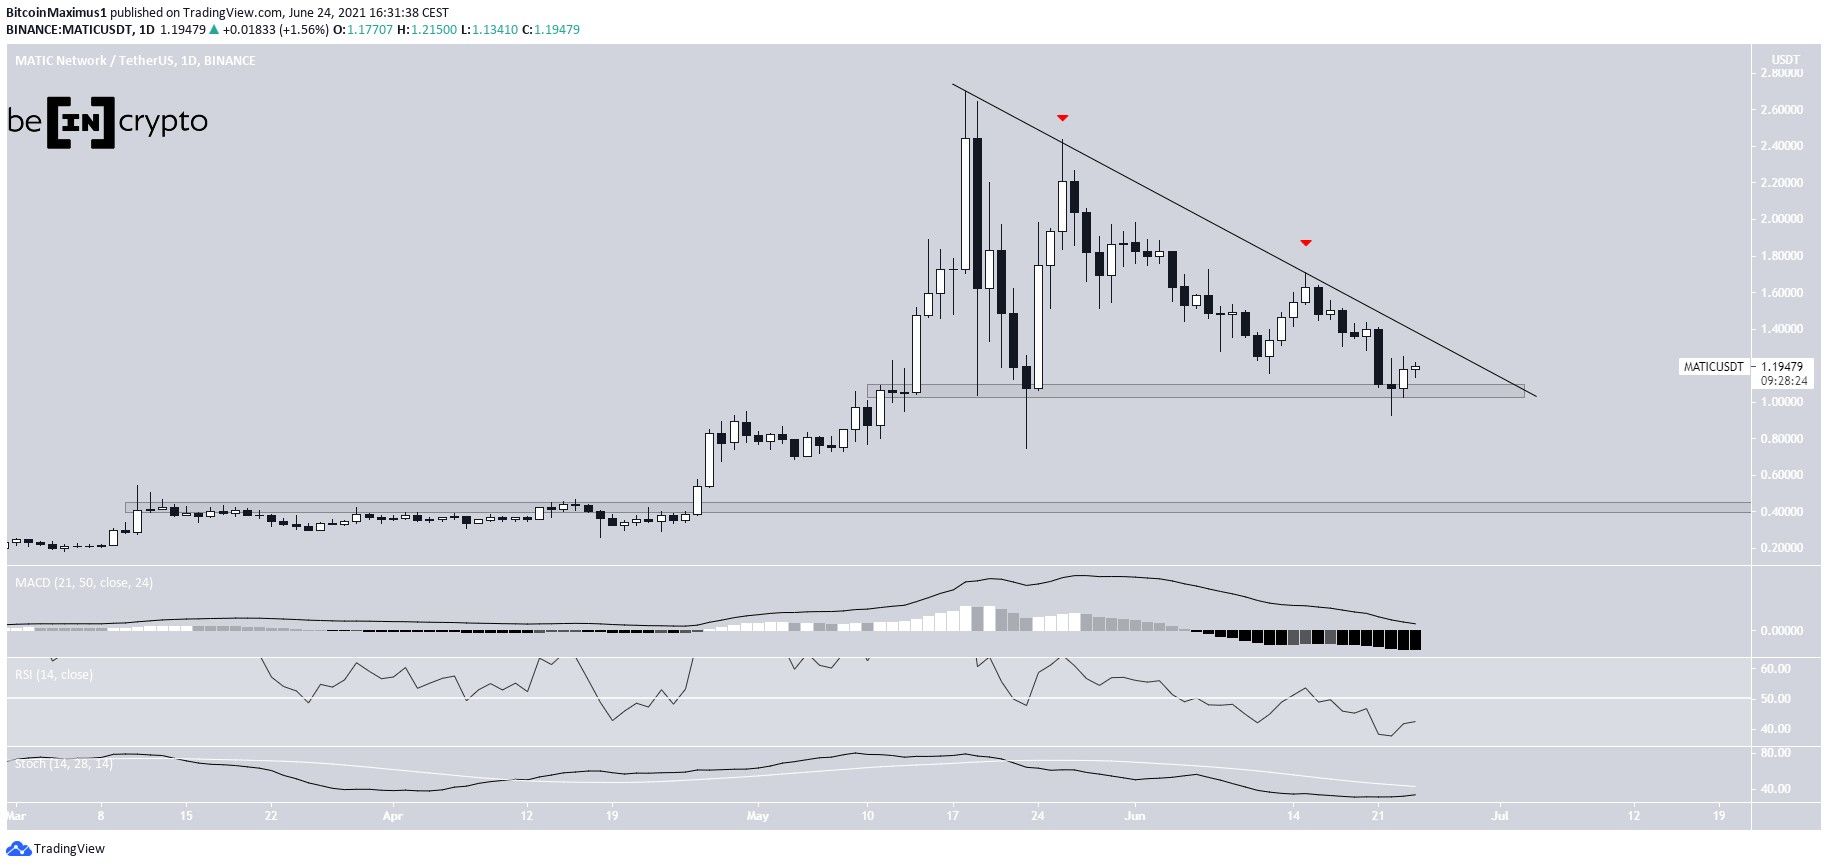
MATIC has been decreasing alongside a descending resistance line since May 18, when it reached an all-time high price of $2.70. So farm, it as reached a low of $0.74, doing so on May 23.
While it bounced afterwards, it failed to break out from the descending resistance line. It created two higher lows (red icons) and has fallen back to the $1.05 support area once more.
When combined with the previously outlined descending resistance line, this creates a descending triangle, which is considered a bearish pattern.
In addition to this, technical indicators are bearish. The MACD & RSI are decreasing while the Stochastic oscillator has yet to make a bullish cross.
A breakdown could take MATIC all the way down to the $0.45 support area.
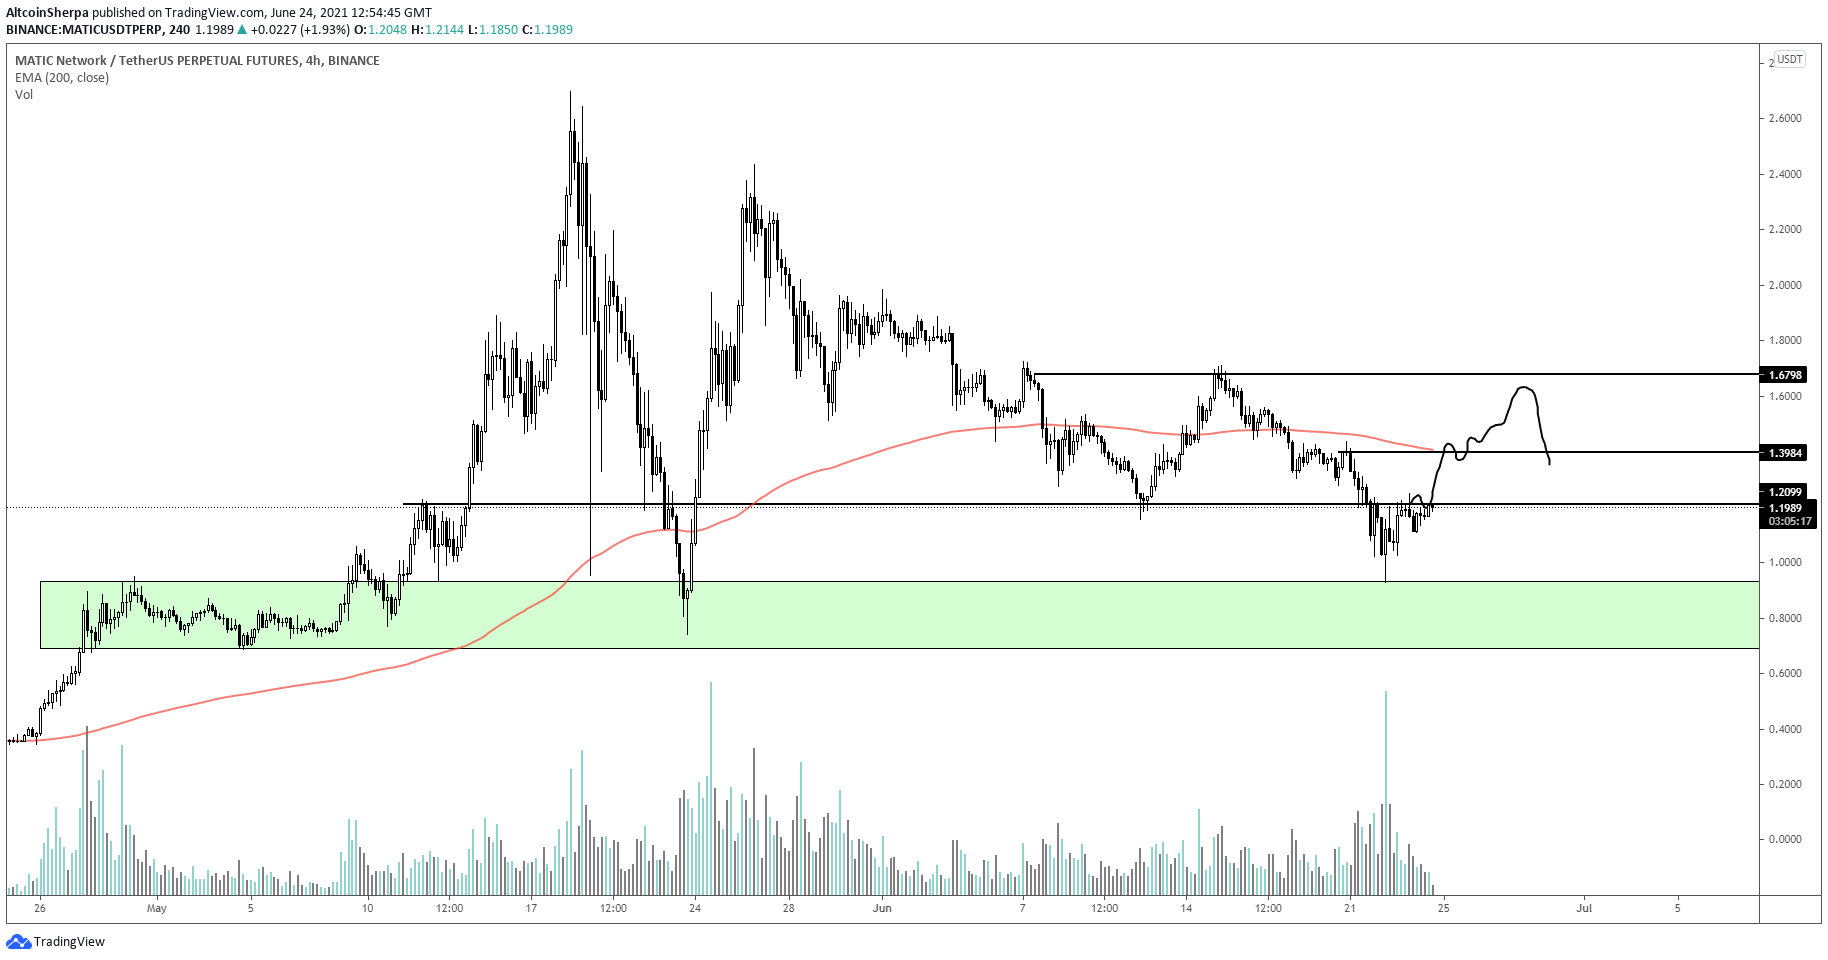
Cryptocurrency trader @Altcoinsherpa outlined a MATIC chart, stating that the token has to break the $1.70 resistance in order to head higher. The area coincides with the descending resistance line. Therefore, until the token clears it, the trend cannot be considered bullish.
Potential wedge
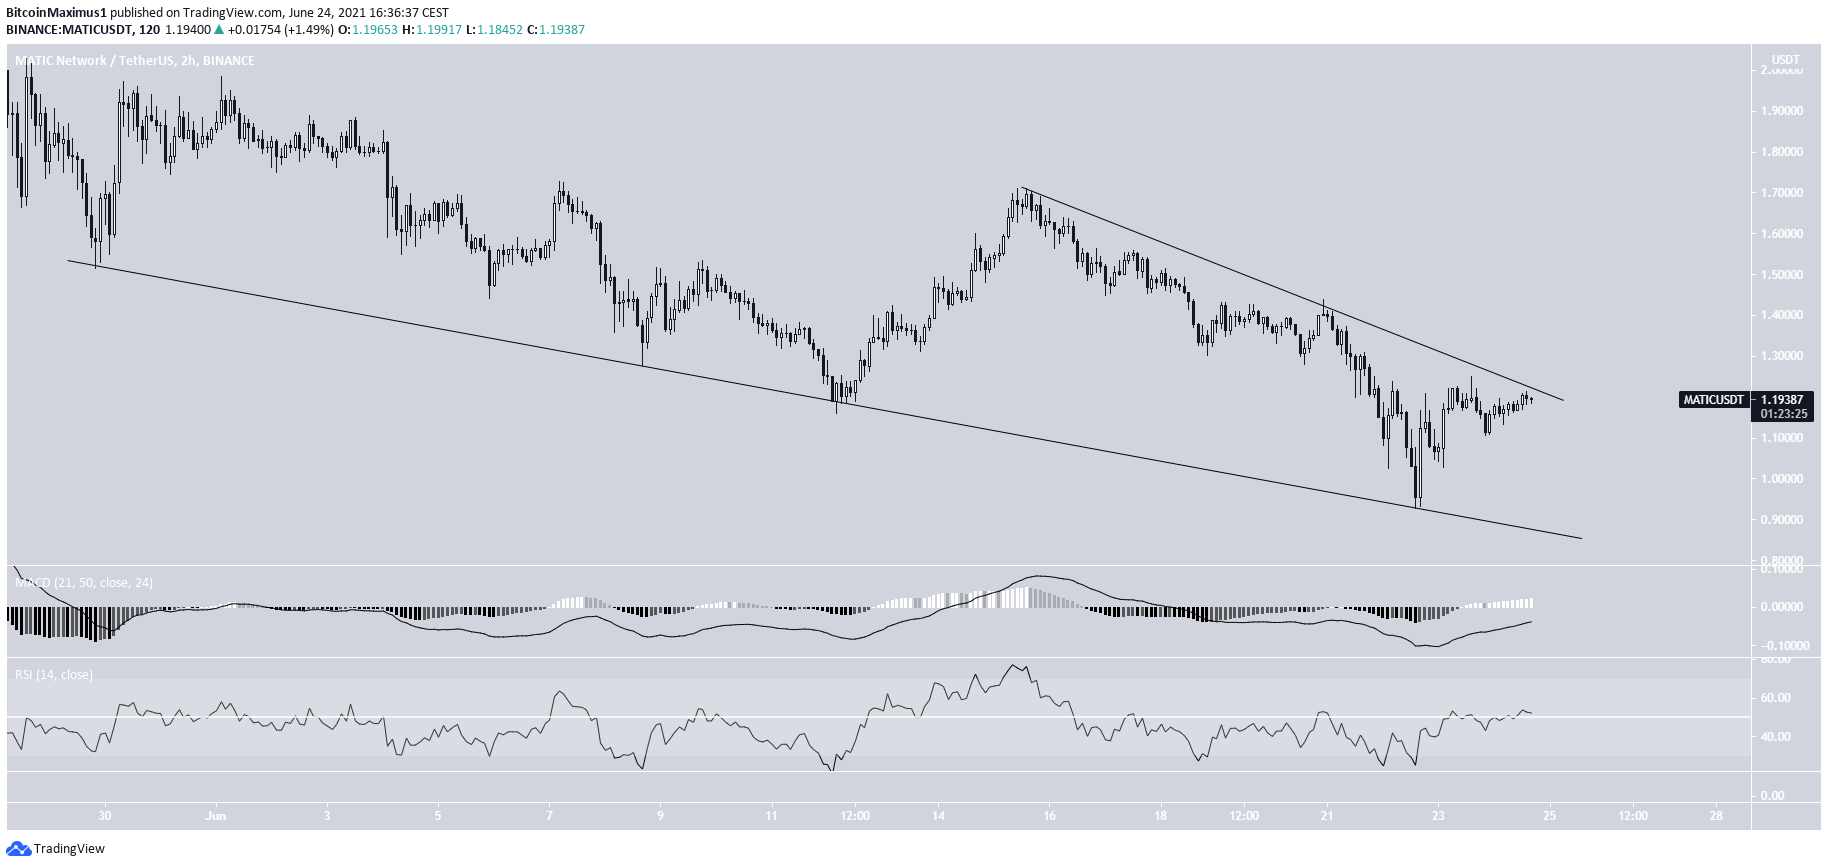
The shorter-term two-hour chart shows a descending wedge, which has been in place since June 15. The descending wedge is considered a bullish reversal pattern.
Both the two-hour MACD & RSI are moving upwards, supporting the possibility of a breakout.
If MATIC manages to break out from the wedge, it would also confirm the bullish reversal with a movement above the long-term descending resistance line.
MATIC/BTC
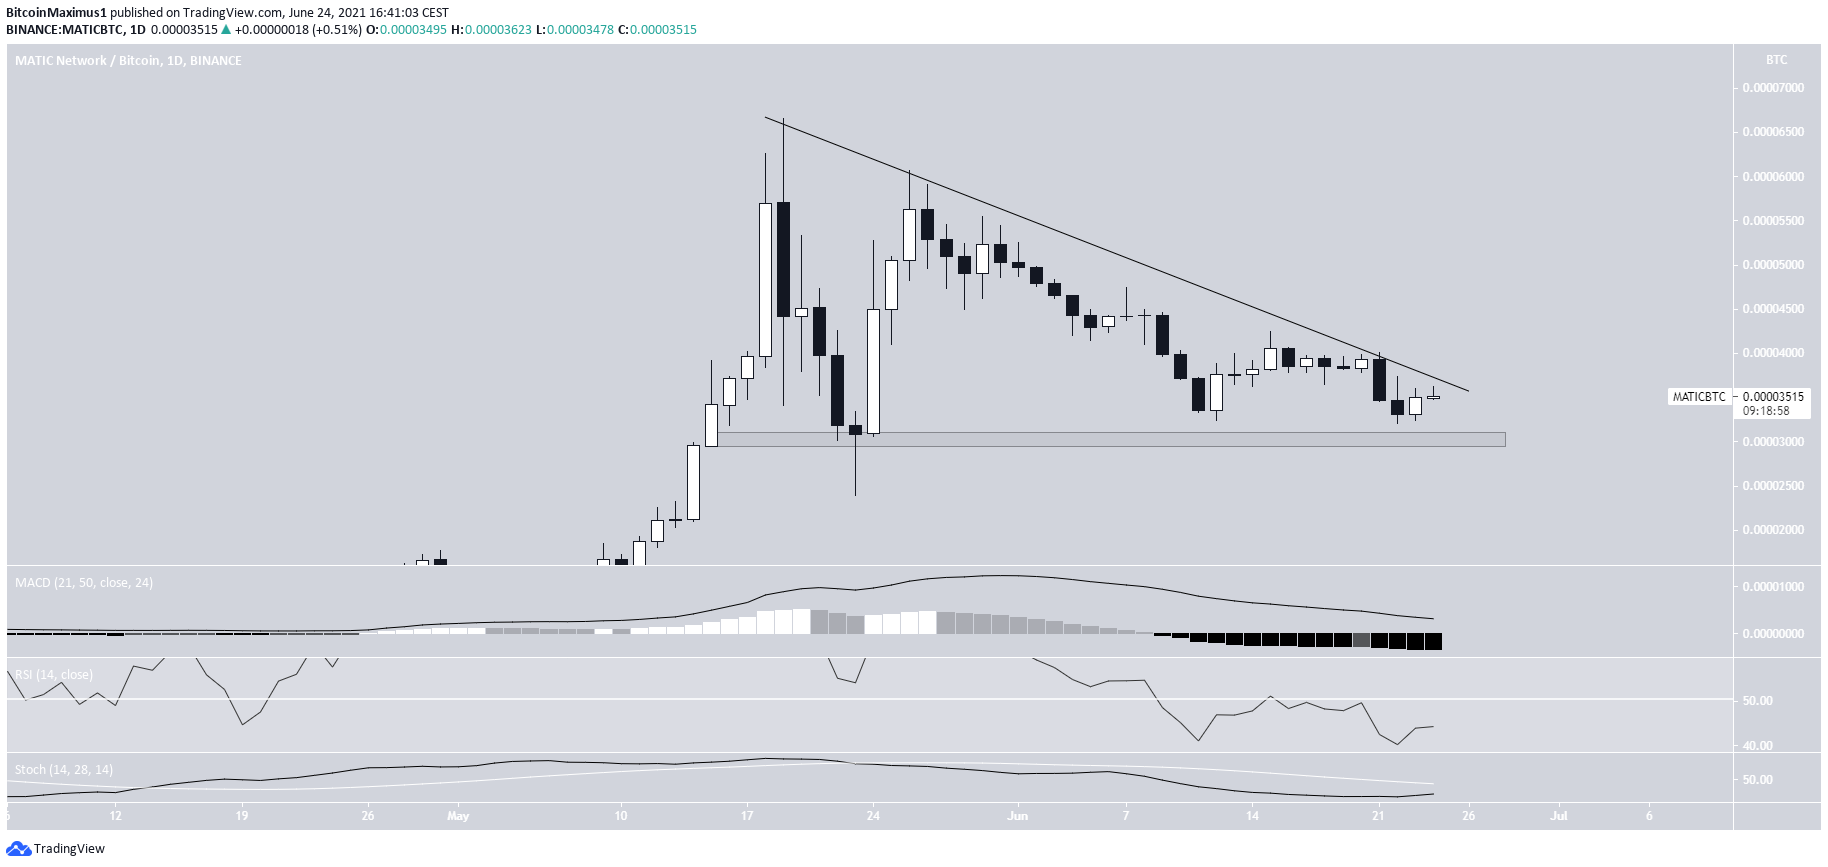
The MATIC/BTC pair has an almost identical chart.
It has been following a descending resistance line since reaching an all-time high price on May 19.
It reached its low on May 19, bounced, but failed to break the resistance line.
Similarly, technical indicators are bearish.
Until the token manages to break out from this line, the trend cannot be considered bullish.
A breakdown below the 3,050 satoshi support area could cause a sharp drop.
For BeInCrypto’s latest bitcoin (BTC) analysis, click here.
