
On September 6, 2019, the Maker (MKR) price reached a low of ₿0.038. It immediately began an upward move that lasted until September 11. After a brief decrease, MKR resumed its upward movement and reached a high of ₿0.055 on September 21.
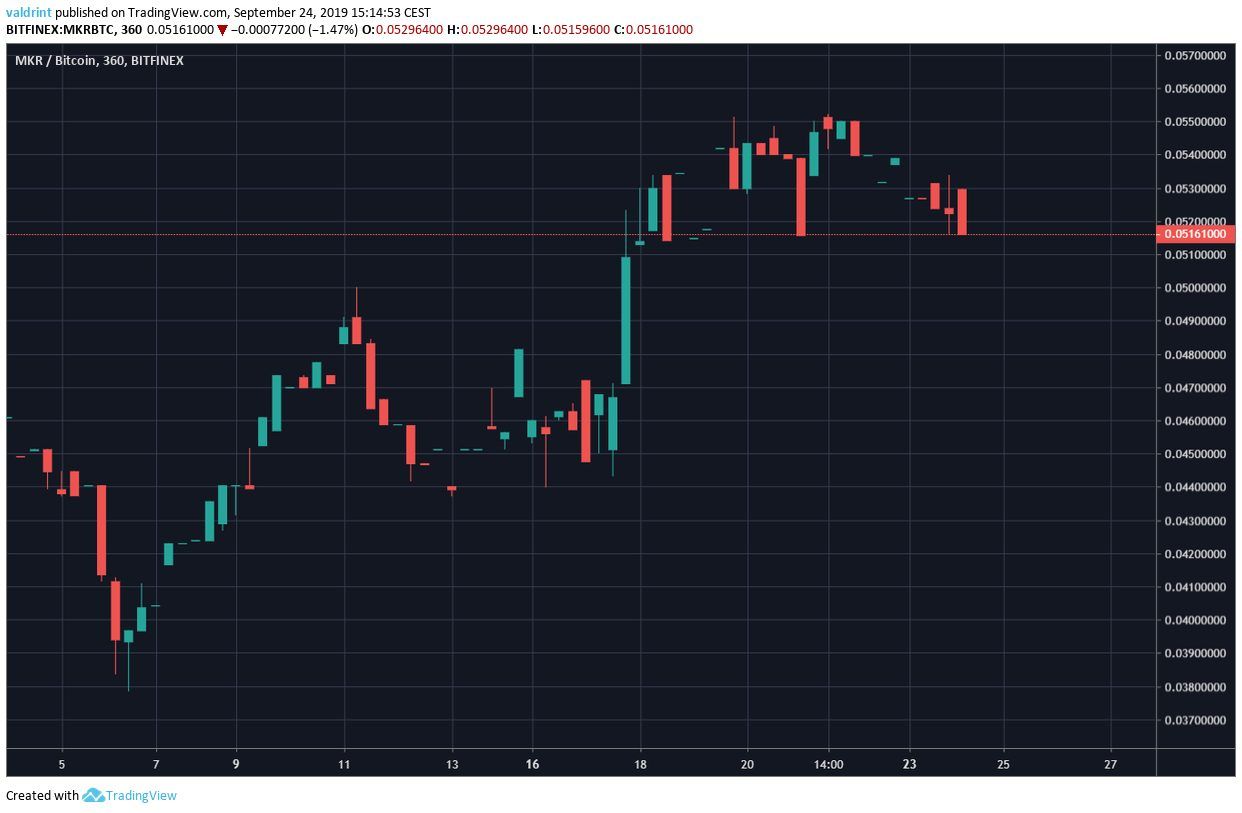
How long will MKR continue to increase? Keep reading below in order to find out.
Maker Price Trends And Highlights For September 24
- MKR/BTC has made a double bottom pattern
- The double bottom was combined with bullish divergence.
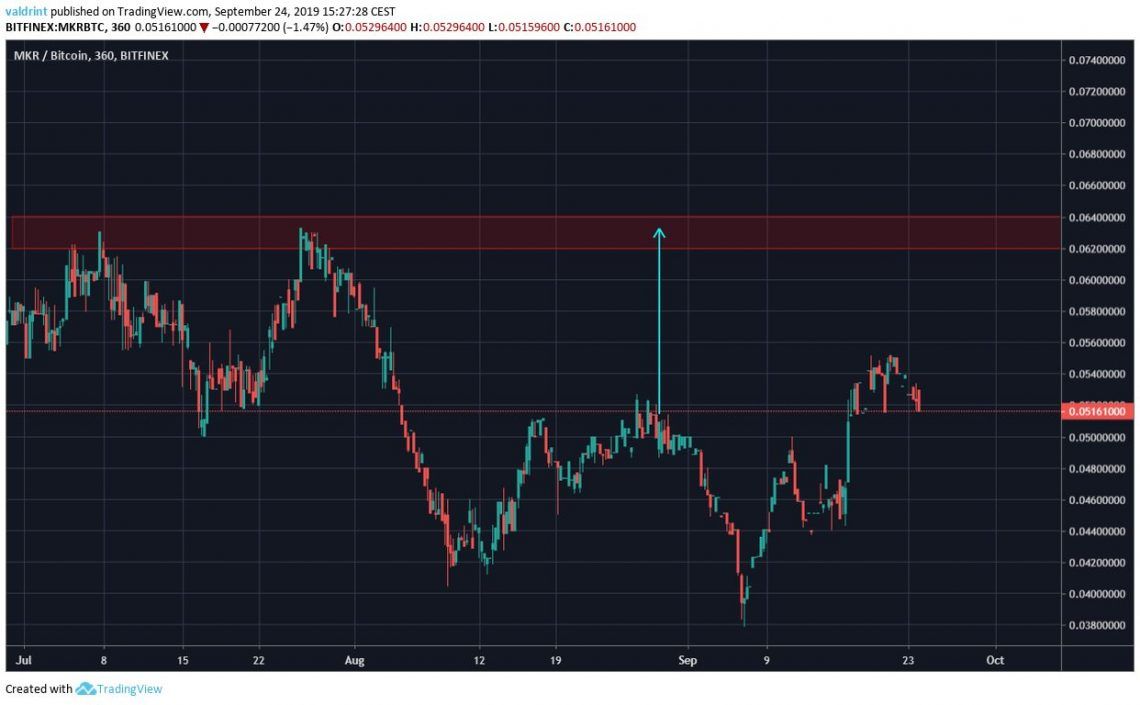
- One resistance area is found at ₿0.063.
- The weekly MACD has made a bullish cross.
Current Pattern
On August 9 and September 6, the MKR price reached similar price closes around ₿0.04.
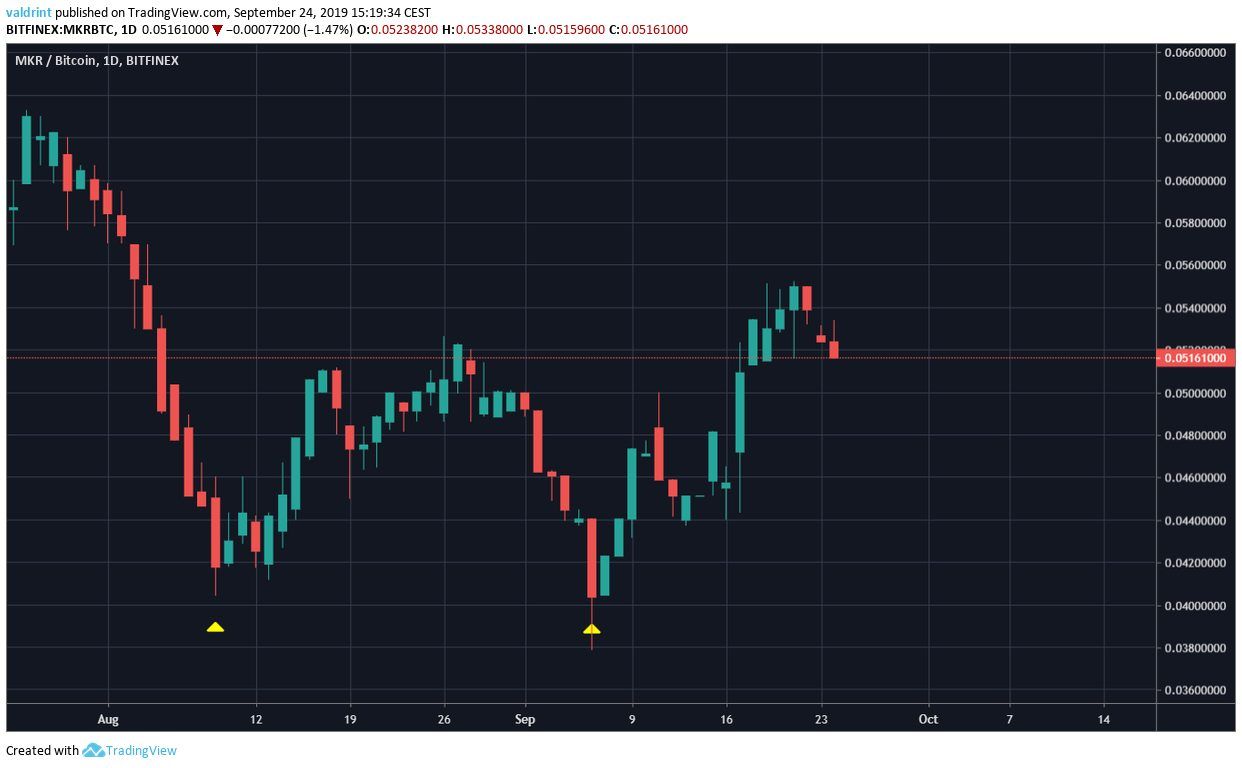
Projecting the height of the pattern to the breakout point gives us a target of ₿0.063.
This coincides with the closest resistance area.
Let’s take a look at technical indicators to see how likely that is.
Technical Indicators
Looking at the RSI & MACD we can see that the double bottom was accompanied by bullish divergence in both indicators.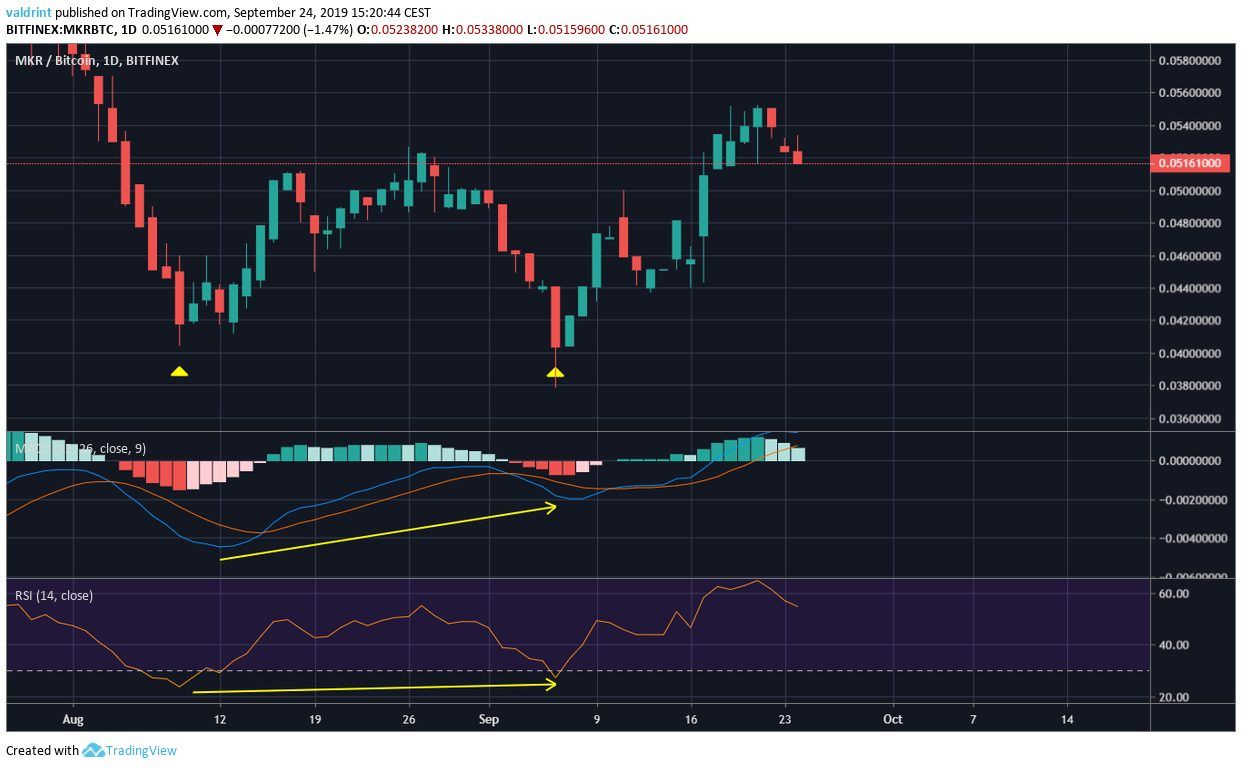
Another bullish sign is given once we look at the weekly time-frame.
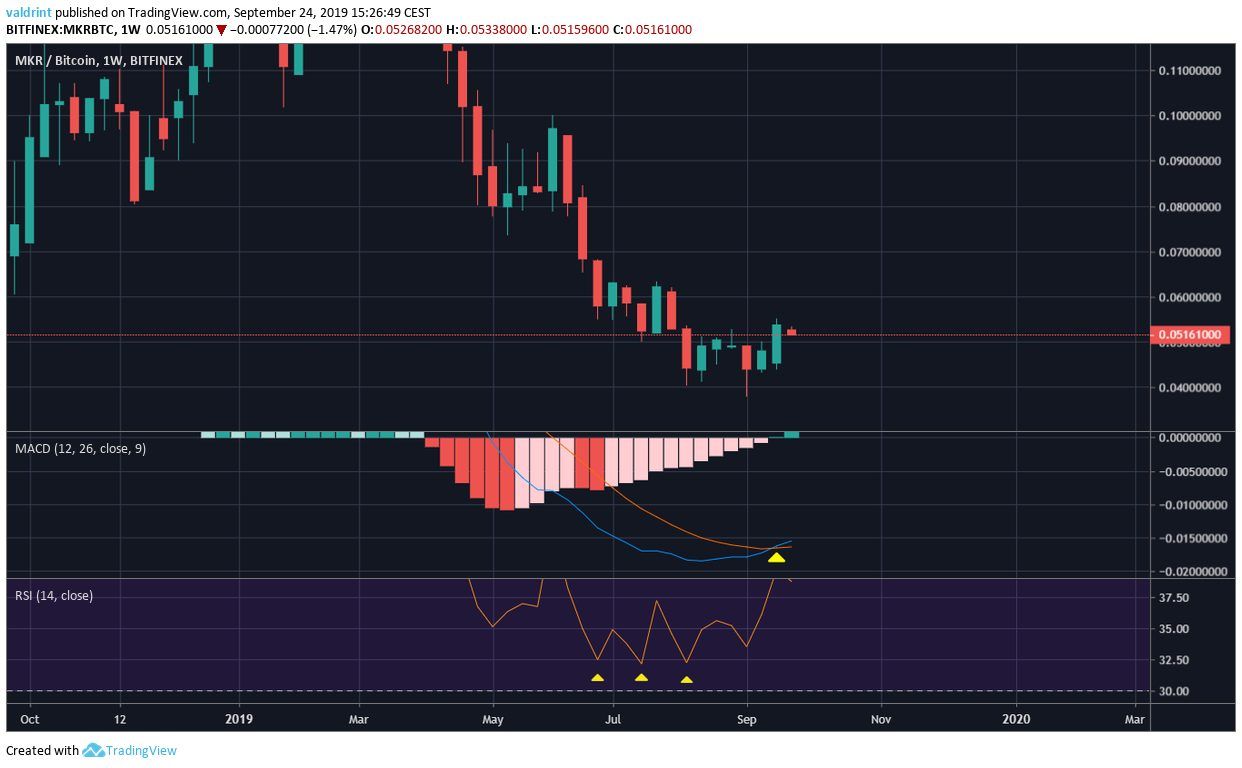
First, we can see that the RSI made a triple bottom at 31, while the price created three lower lows.
Bullish divergence in a weekly time-frame is uncommon.
Additionally, the weekly MACD made a bullish cross.
The tracking data goes back to May 2018, and this is the first such cross in this time-frame.
The combination of these indicator signs in different time-frames makes us believe that MKR has just begun an uptrend.
Future Movement
An outline of possible future price movement is given below
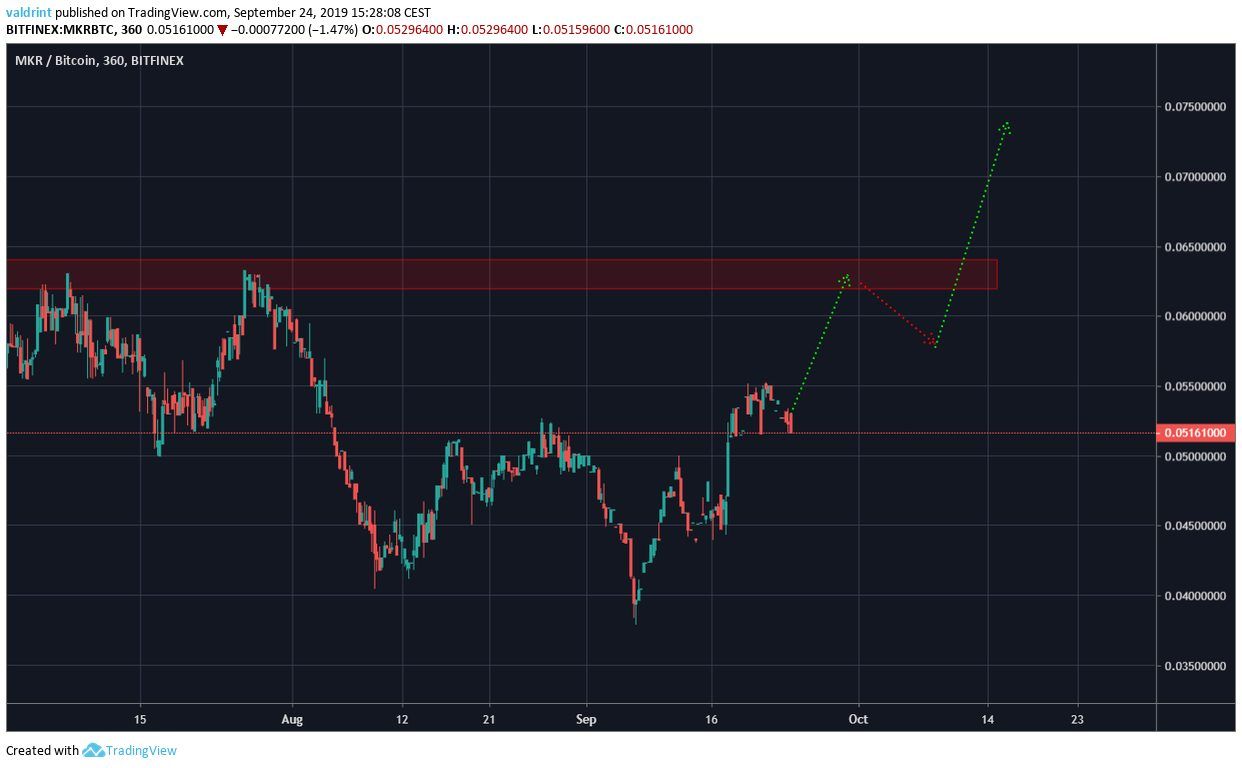
MKR is likely to increase and reach the resistance area at ₿0.063.
Afterward, it is possible that it retraces slightly, creating a bullish pattern before resuming its upward movement.
Maker Price Summary
The MKR price recently made a double bottom and began to increase.
According to our analysis, it is likely to increase and reach the resistance area outlined above.
The current price position does not allow for the initiation of a profitable trade.
Do you think that MKR will reach the resistance area? Let us know in the comments below.
Disclaimer: This article is not trading advice and should not be construed as such. Always consult a trained financial professional before investing in cryptocurrencies, as the market is particularly volatile.
Images are courtesy of Shutterstock, TradingView.
