


Maker (MKR) has been increasing since Jan 22 and is currently making an attempt at breaking out above a long-term resistance level.
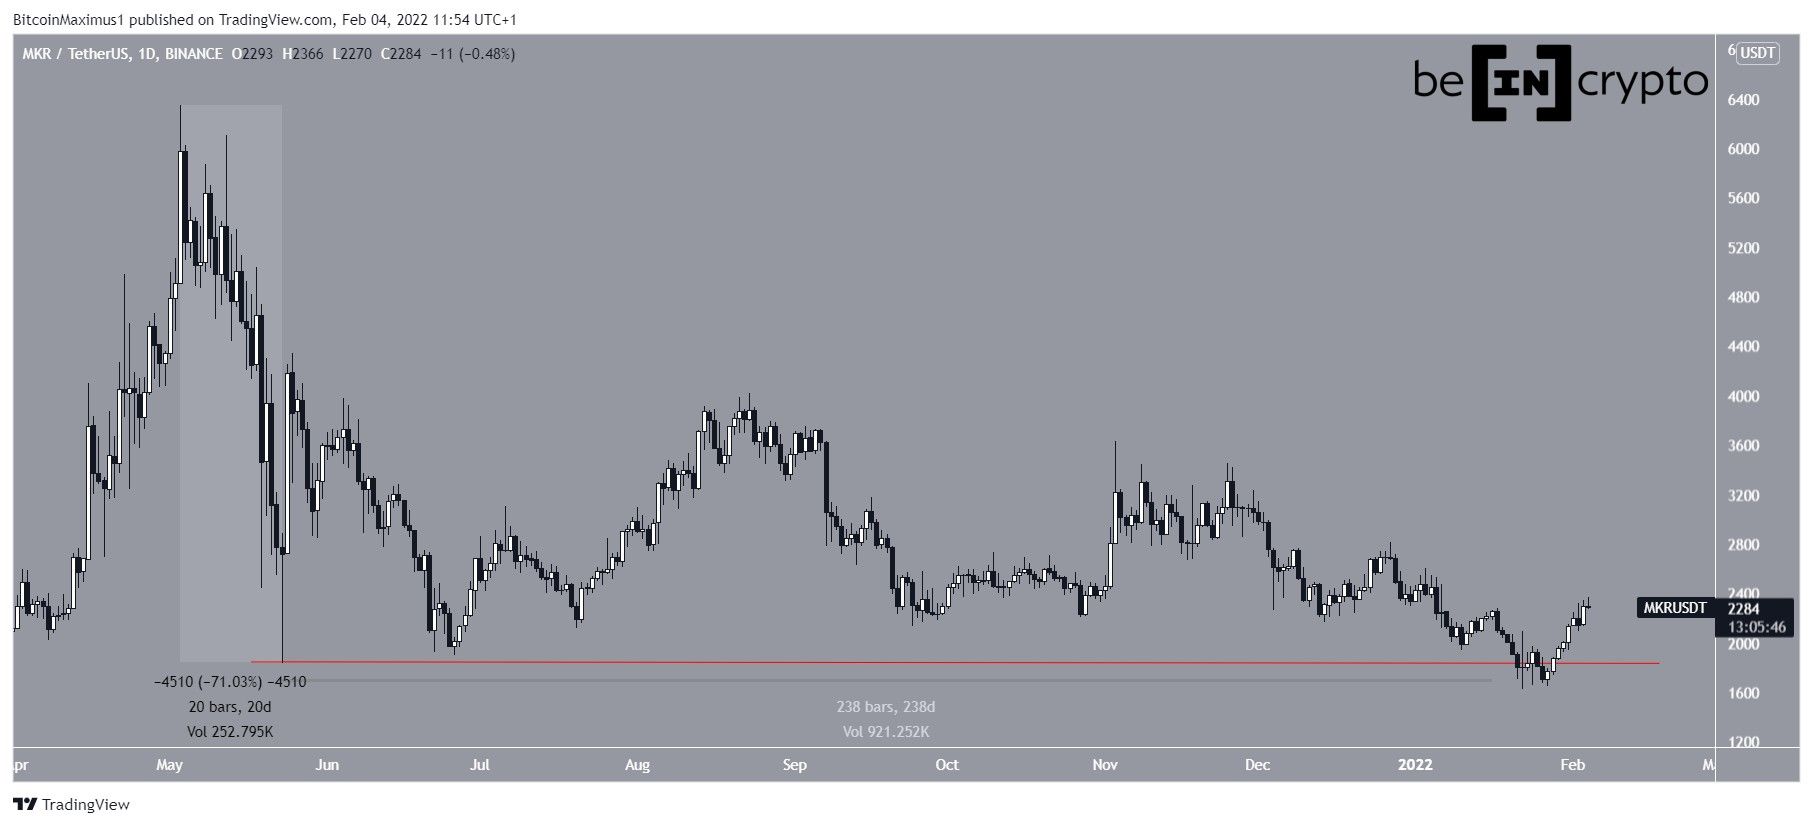
Maker has been falling since reaching an all-time high price of $6,348 on May 3, 2021. The initial decrease was sharp, amounting to 71% in only 20 days. This dip led to a local low of $1,829 on May 23.
After bottoming out, MKR rebounded and consolidated for 238 days. On Jan 22, it appeared to have broken down below the May 23 lows (red line). However, it reclaimed the line shortly after, rendering the previous breakout just a deviation.
Such deviations are normally considered bullish developments that often lead to sustained movements in the other direction.
Current trading pattern
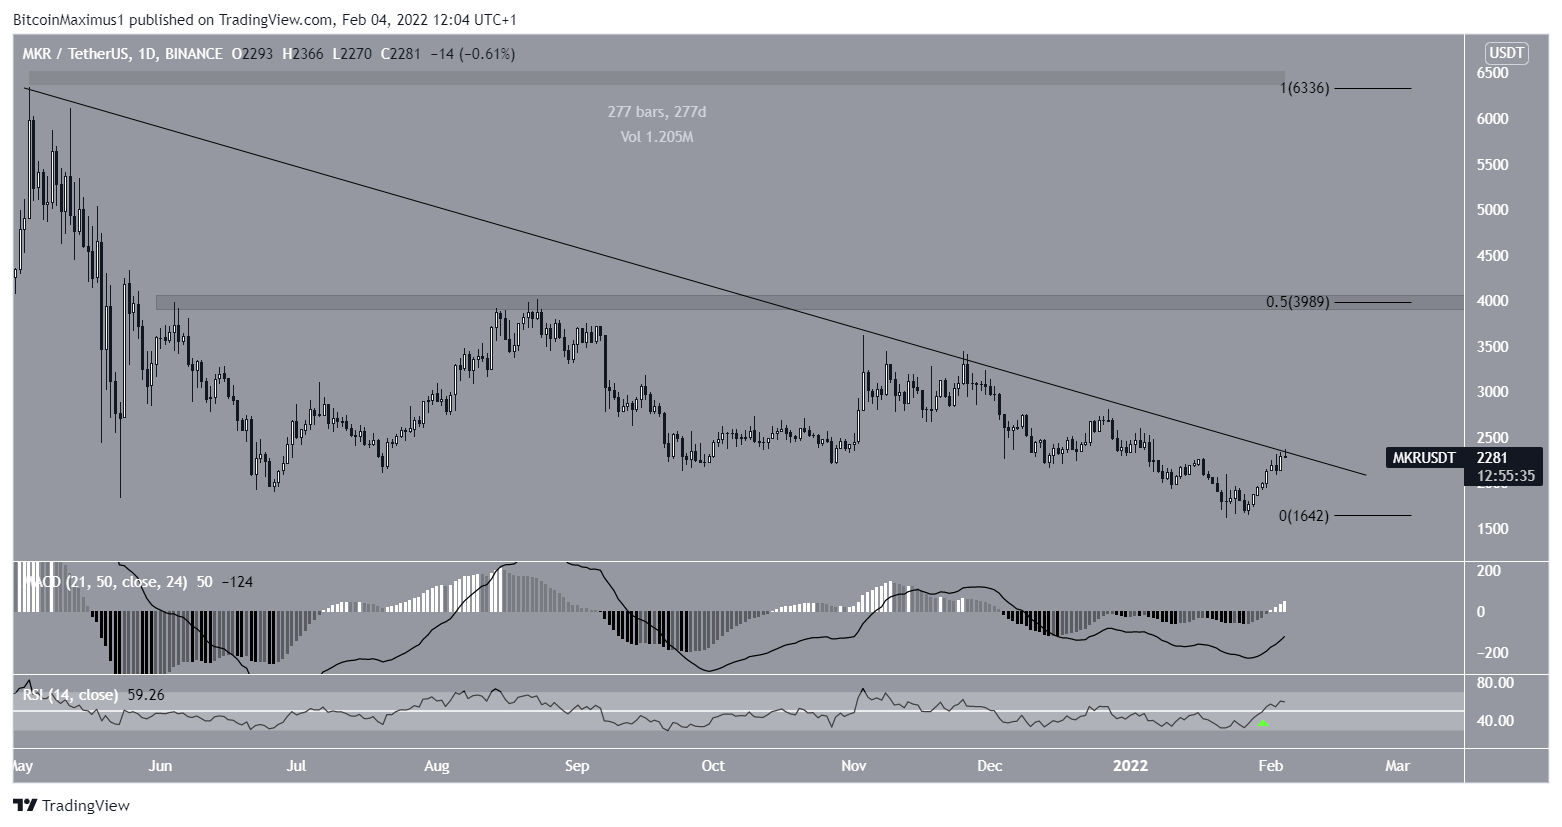
Technical indicators in the daily time-frame are bullish. This is especially evident by the fact that the RSI has moved above 50 (green icon). The RSI is a momentum indicator and readings above 50 are considered bullish.
In addition to this, the MACD is also moving upwards, even though it’s not yet positive.
MKR has been following underneath a descending resistance line since the aforementioned 2021 all-time high price. Currently, MKR is making its third breakout attempt. If successful, the next closest resistance area would be found at $4,000. This is the 0.5 Fib retracement resistance level and a horizontal resistance area.
MKR wave count analysis
Cryptocurrency trader @ewfib tweeted a MKR chart, stating that it looks to have potentially completed its correction and will continue moving upwards.
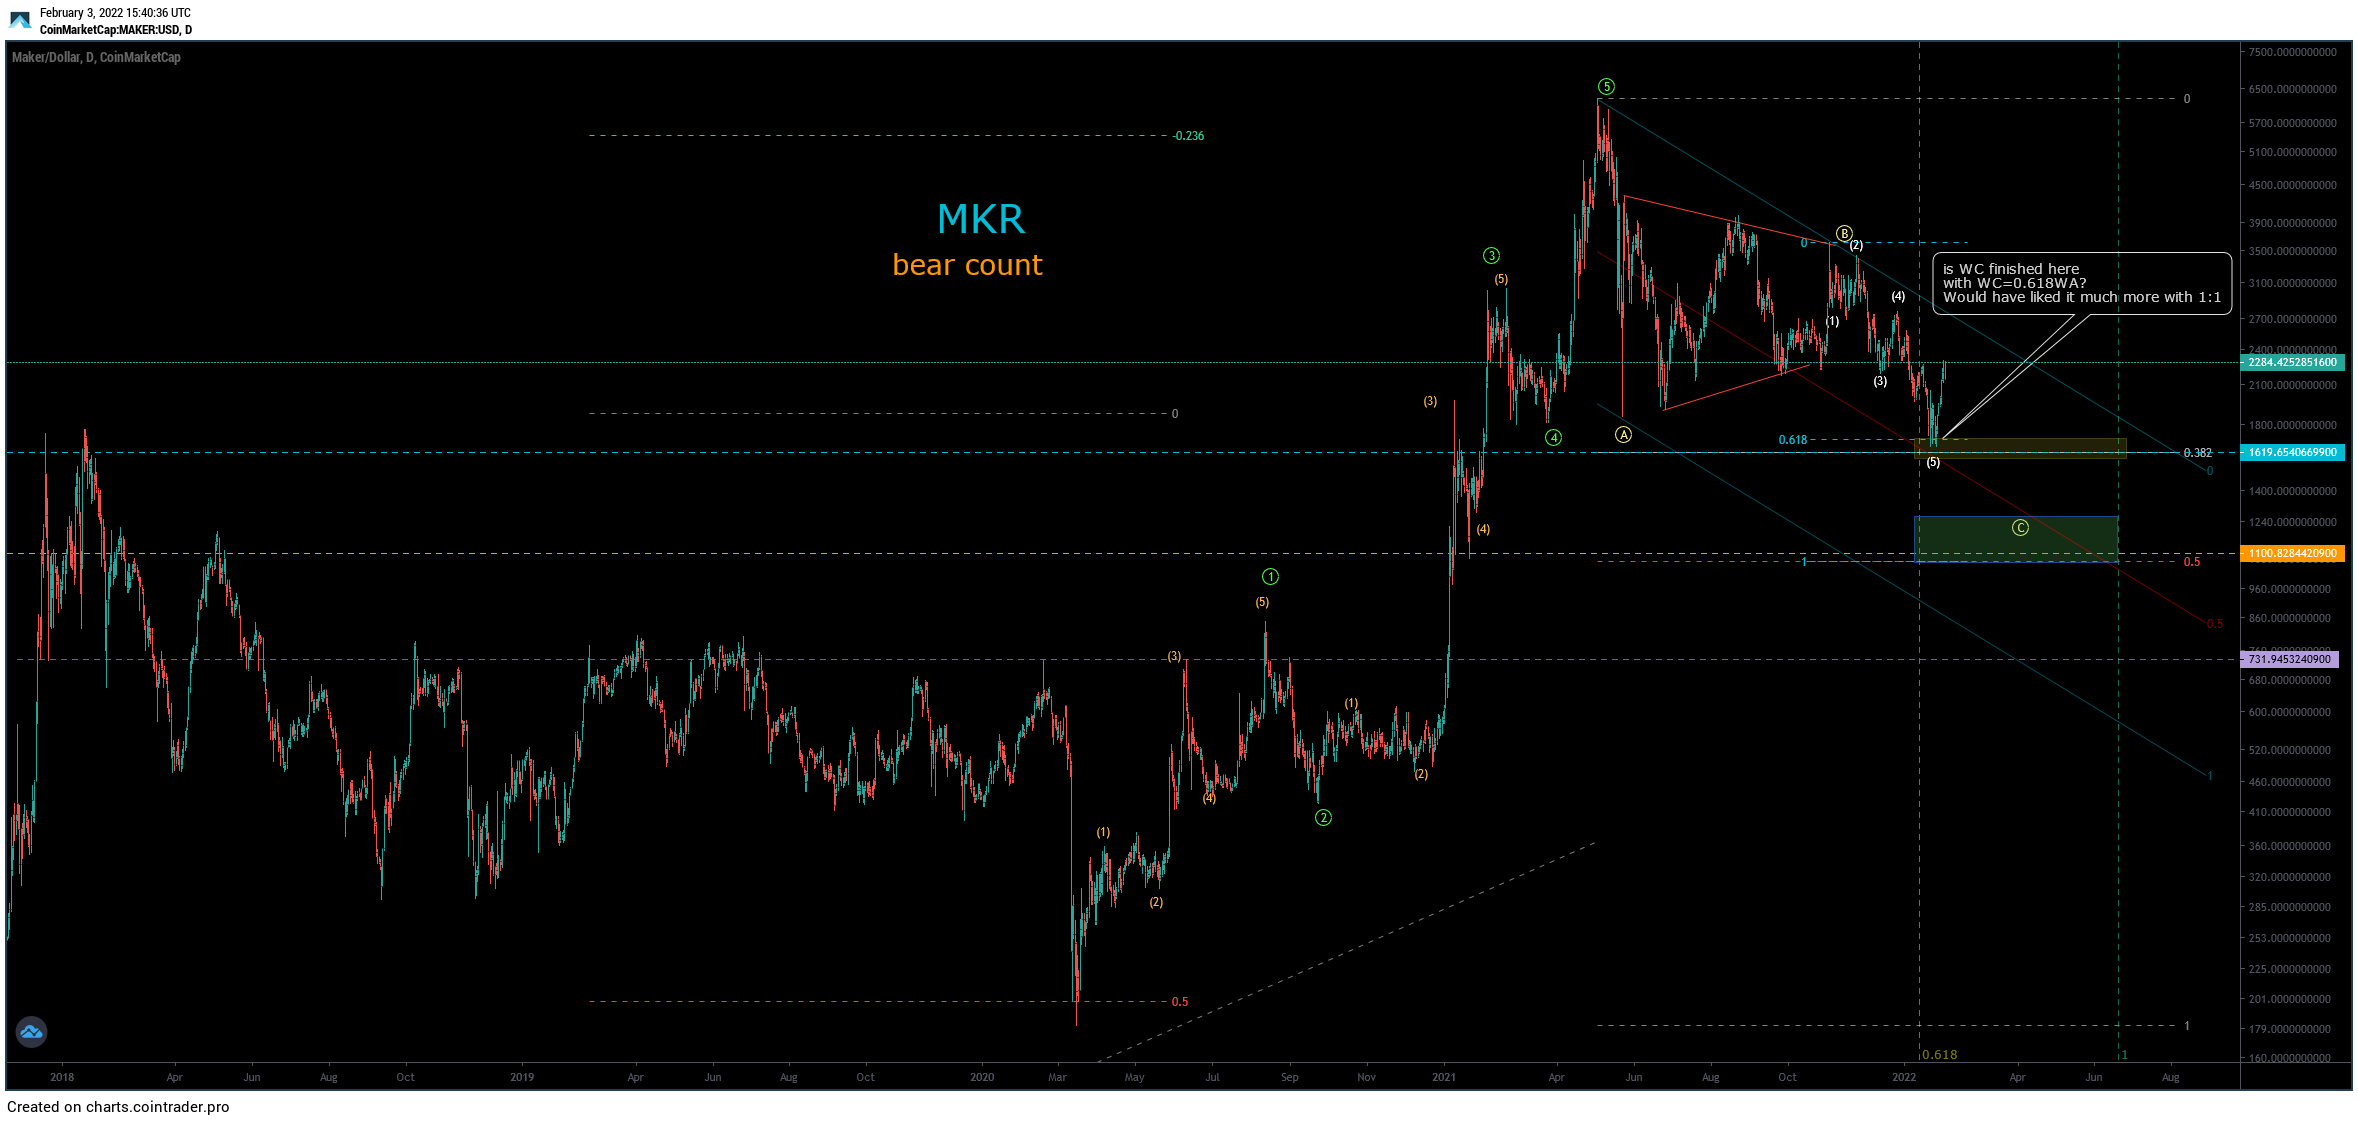
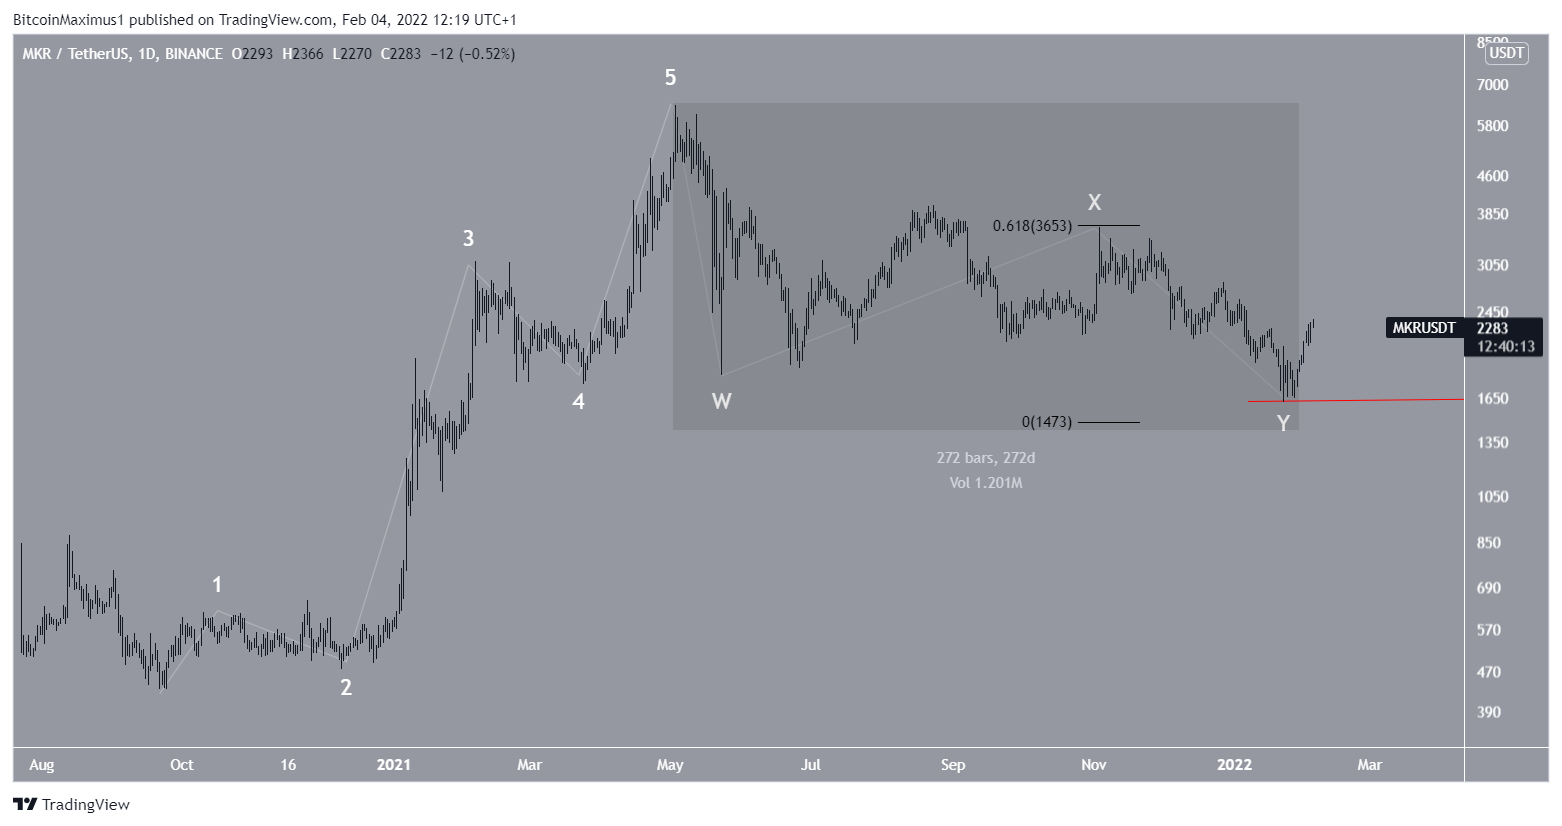
The most likely wave count suggests that since September 2020, MKR has completed a five-wave upward movement and correction.
In the correction, waves W and Y had a 1:0.618 ratio, which is the second most common in such structures, after the 1:1 ratio.
If the structure is correct, it would mean that MKR has begun a new upward trend that could take it to a new all-time high price and beyond.
A decrease below the wave Y low of $1,616 (red line) would invalidate this structure.
For BeInCrypto’s previous Bitcoin (BTC) analysis, click here


