
The Maker (MKR) price has been decreasing since it reached a local high on June 11. It seems that the correction is not yet finished, and another drop will transpire before MKR resumes its upward movement.
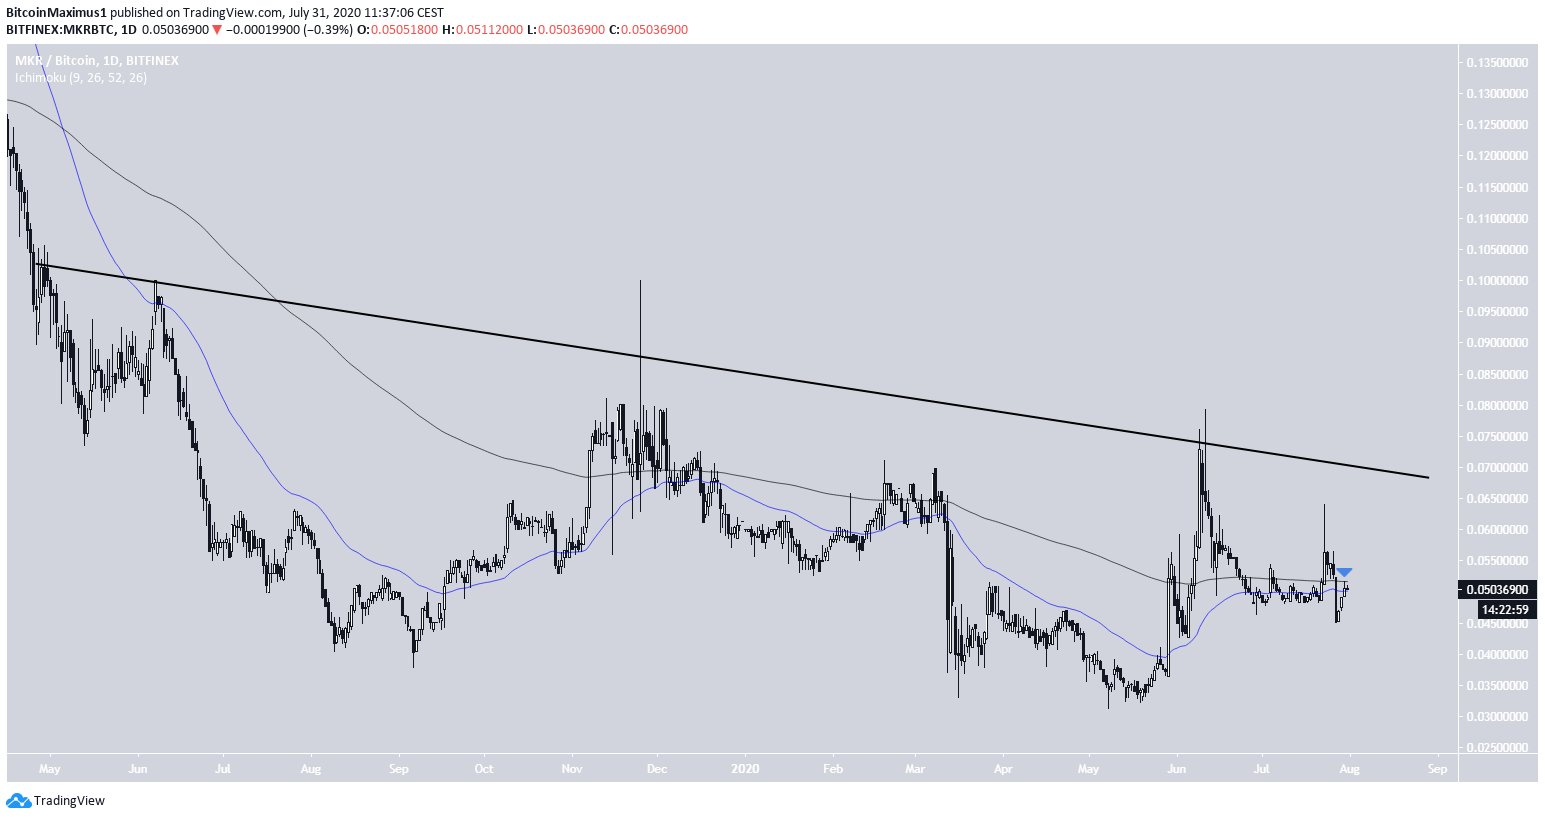
The MKR price has been following a descending resistance line that began on April 29, when the price was rejected at ₿0.105. Up to this point, the price has made three unsuccessful attempts at breaking out, the most recent occurring in the second week of June.
MKR Stuck Under Resistance
Currently, the price is trading below both the 50 and 200-day moving averages (MA), and is facing resistance from both.
In order for MKR to make another attempt at breaking out, the price has to reclaim these two MAs, which ideally would then make a bullish cross. While the price has moved above them several times, they have yet to make a bullish cross throughout the entirety of the descending pattern.
If a cross were to occur, a movement towards the resistance line and possible breakout would be likely. If successful in breaking out, MKR would likely take off back towards the ₿0.105 high.
Short-Term Breakout
Cryptocurrency trader @Cryptokaleo outlined a MKR chart that shows a shorter-term descending resistance line that has yet to break, giving a target of ₿0.0620 if it does.
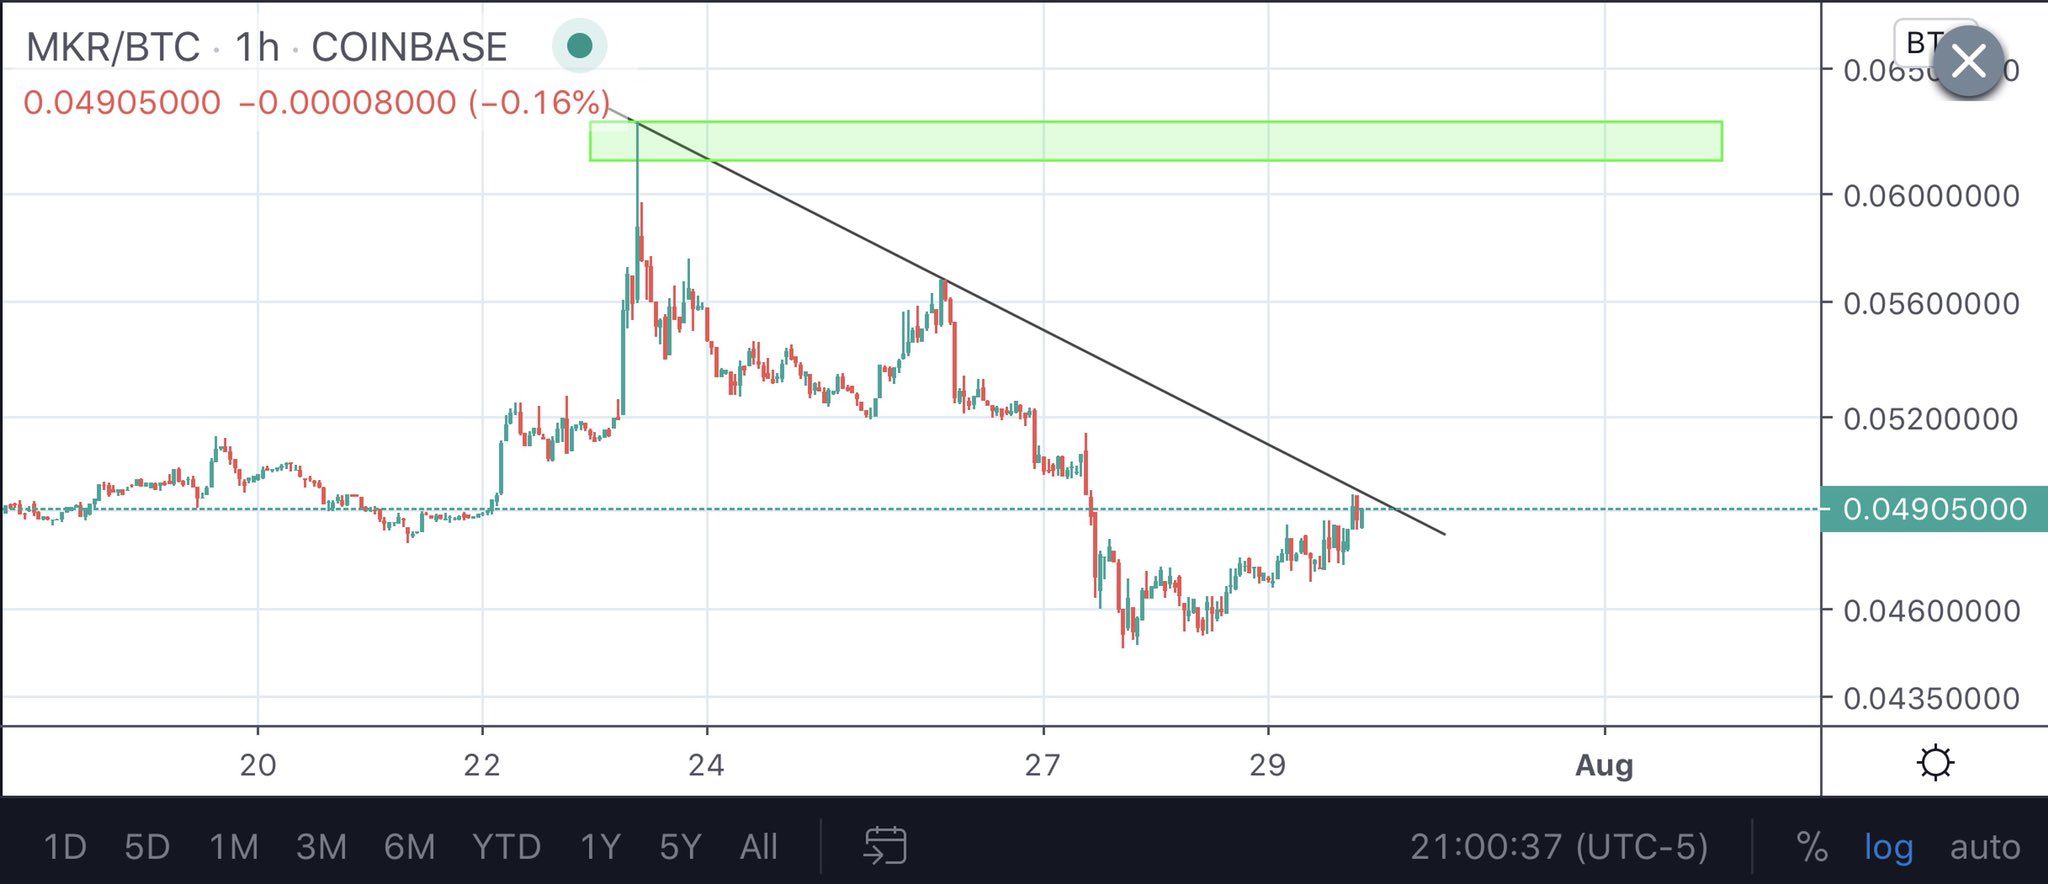
A closer look at the shorter-term chart suggests that it would be more likely for the price to be rejected from this line rather than breaking out.
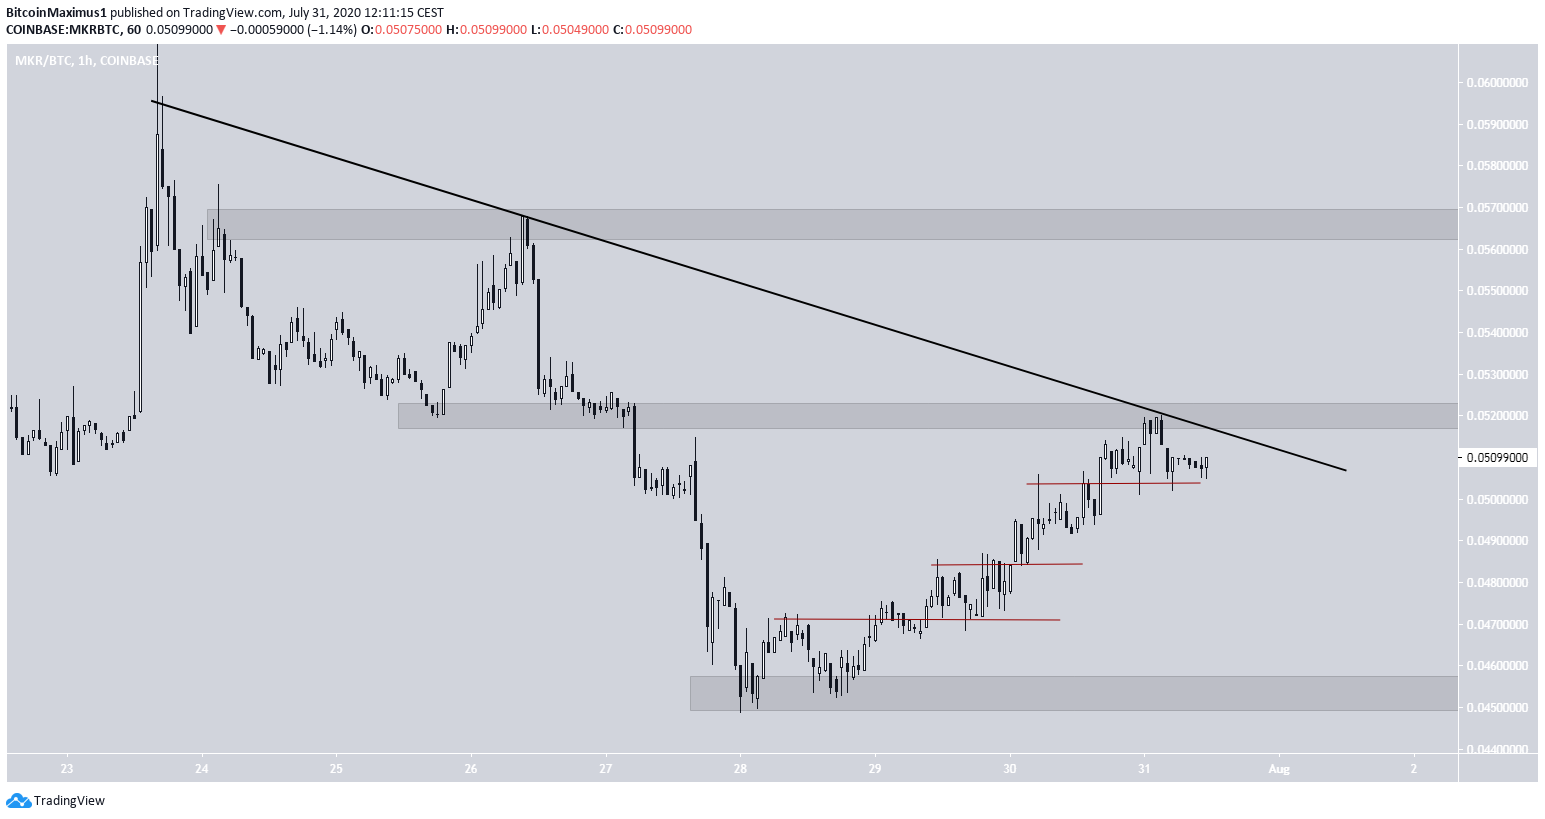
The resistance line also coincides with the previous support level at ₿0.0520. In addition, the recent upward move looks more like a correction than an impulse, due to the extensive overlap between the highs and lows.
A breakout could take the price towards ₿0.0575. However, a breakdown towards the support line at ₿0.0450 seems more likely.
Wave Count
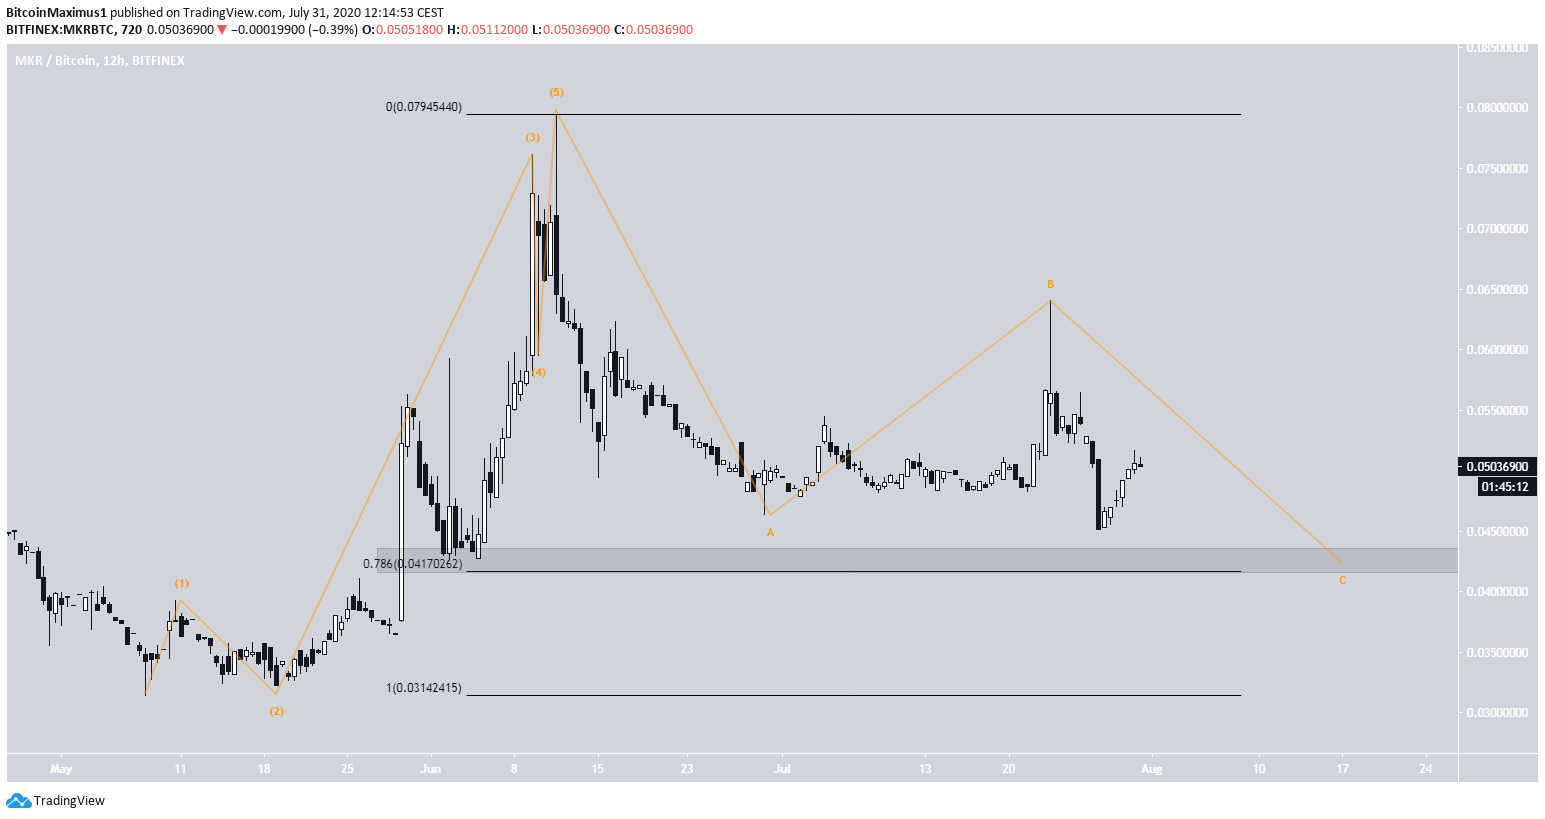
As for the wave count, we can draw a five-wave impulse that began on March 10 and ended on June 11. Since then, the price has been correcting inside an A-B-C formation, currently being in the third and final wave.
Therefore, the most likely reversal level would be the previous support and 0.786 Fib level at ₿0.0410, before the price makes another attempt at breaking out above the descending resistance line.
To conclude, the MKR price looks to be nearing the end of its correction. Further upward moves would be expected after a potential drop towards the range-low support areas.
