


Be[in]Crypto takes a look at the five cryptocurrencies that increased the most last week, more specifically, from Sept 2 to Sept 9.
These cryptocurrencies are:
- Terra Classic (LUNC): 127.97%
- Ravencoin (RVN): 54.49%
- Cosmos(ATOM): 23.92%
- Ethereum Classic (ETC): 18.26%
- Chainlink (LINK): 15.00%
LUNC
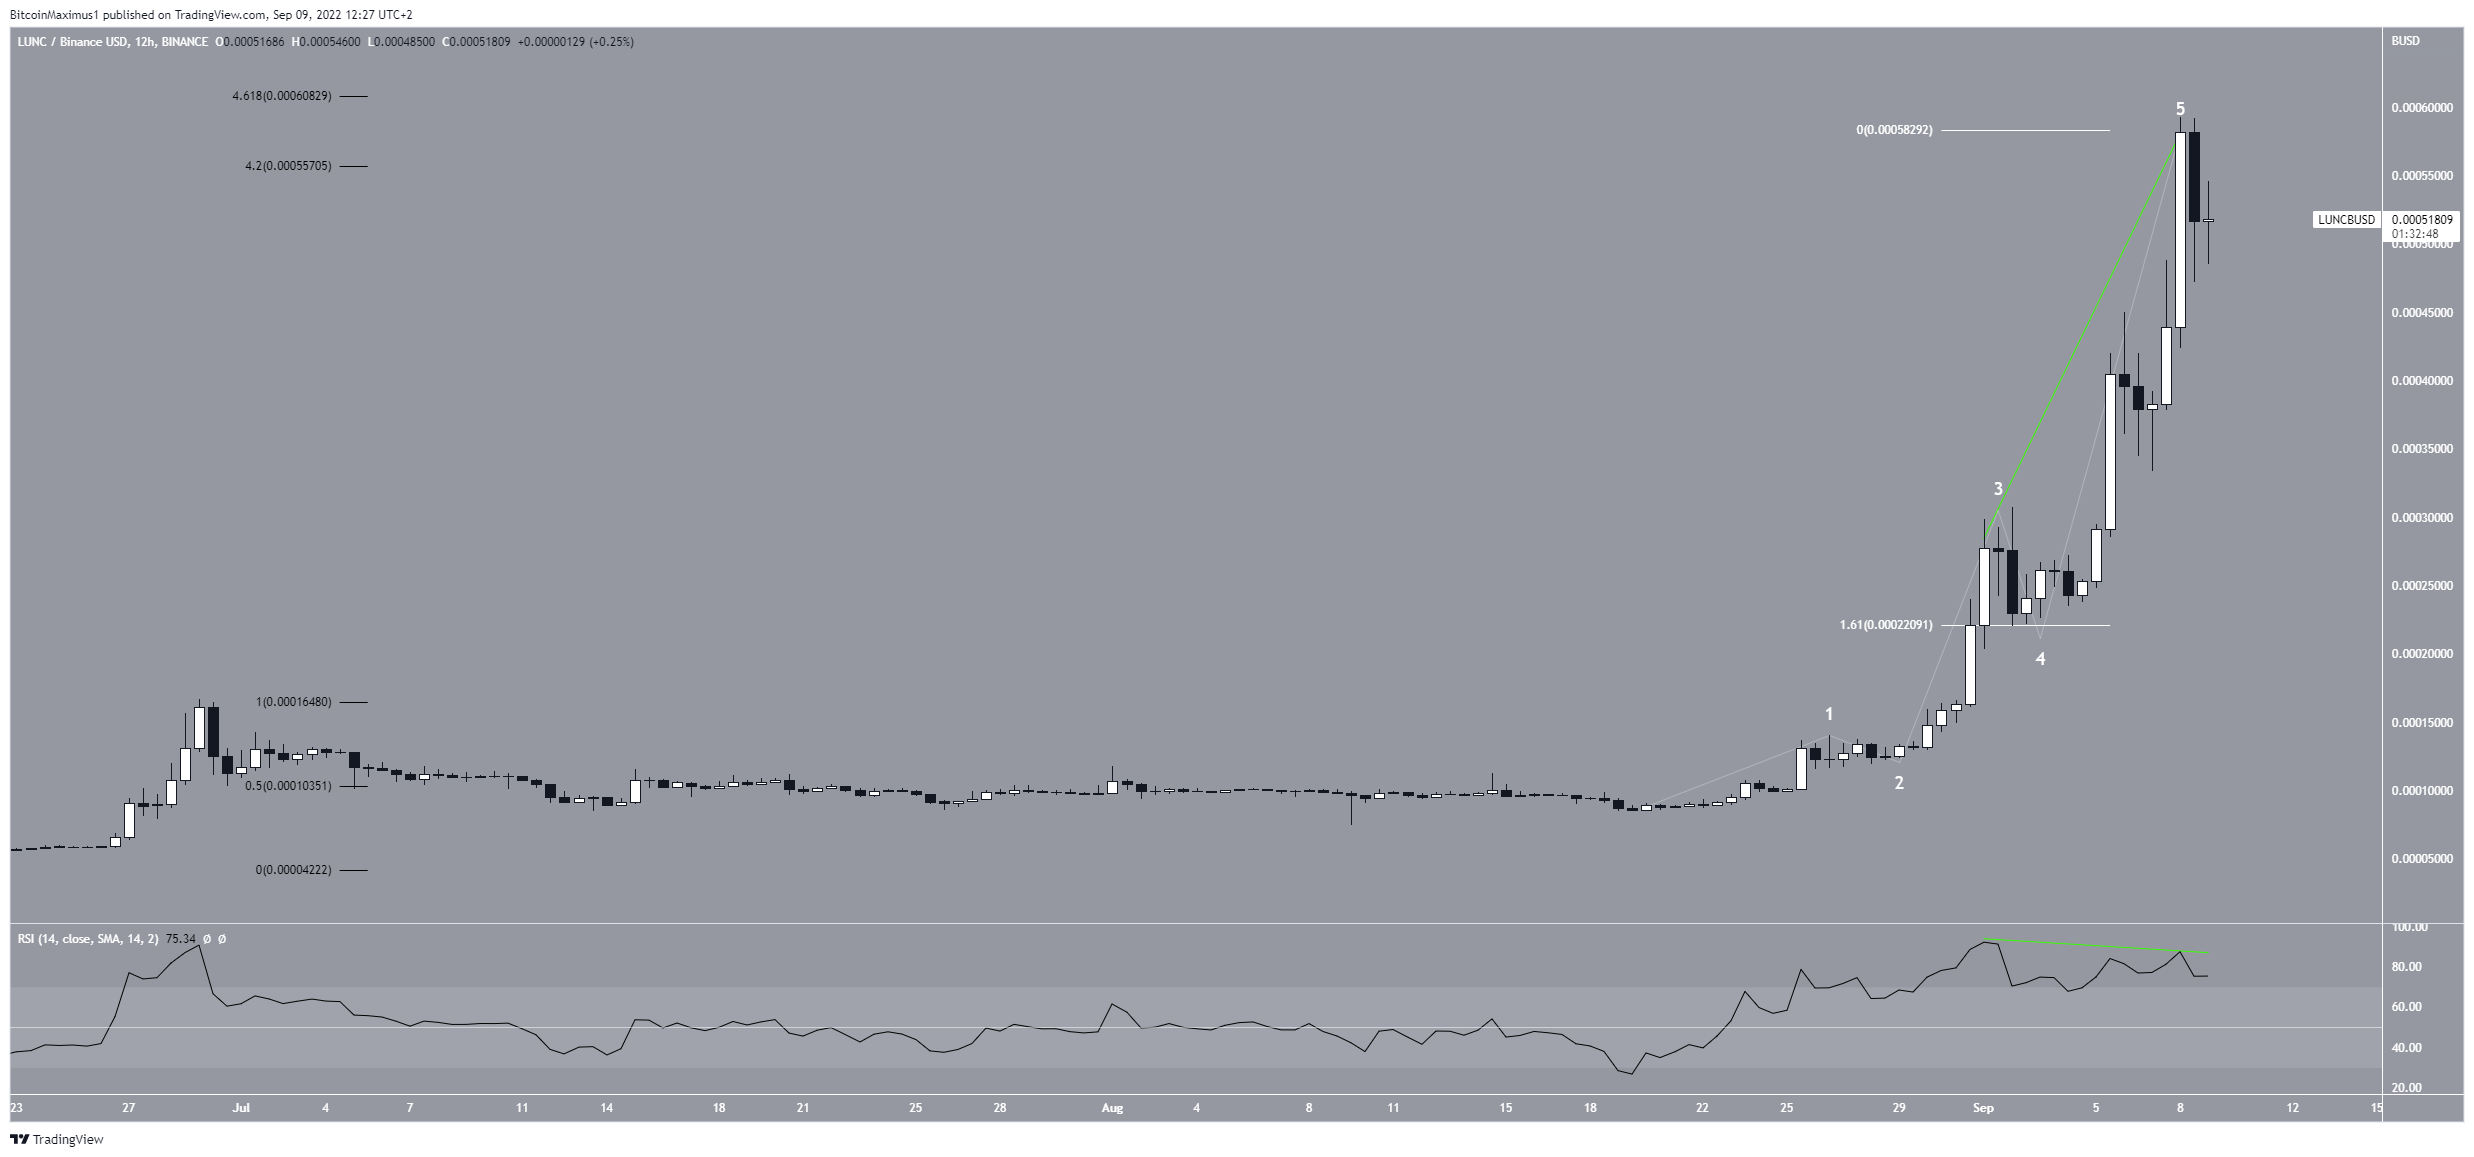
LUNC has increased considerably since Aug 25. The upward movement has so far led to a high of $0.00059 on Sept 8.
The high was made at two important Fib resistance levels. The 4.2-4.61 extension of the initial upward movement (black) and the 1.61 length of waves one and three (white). Therefore, it is possible that LUNC will soon reach or has already reached a top.
Furthermore, the RSI has generated bearish divergence (green line), indicating that a downward movement could soon follow. If one occurs, LUNC could fall towards the 0.5 Fib retracement support level at $0.0035.
RVN
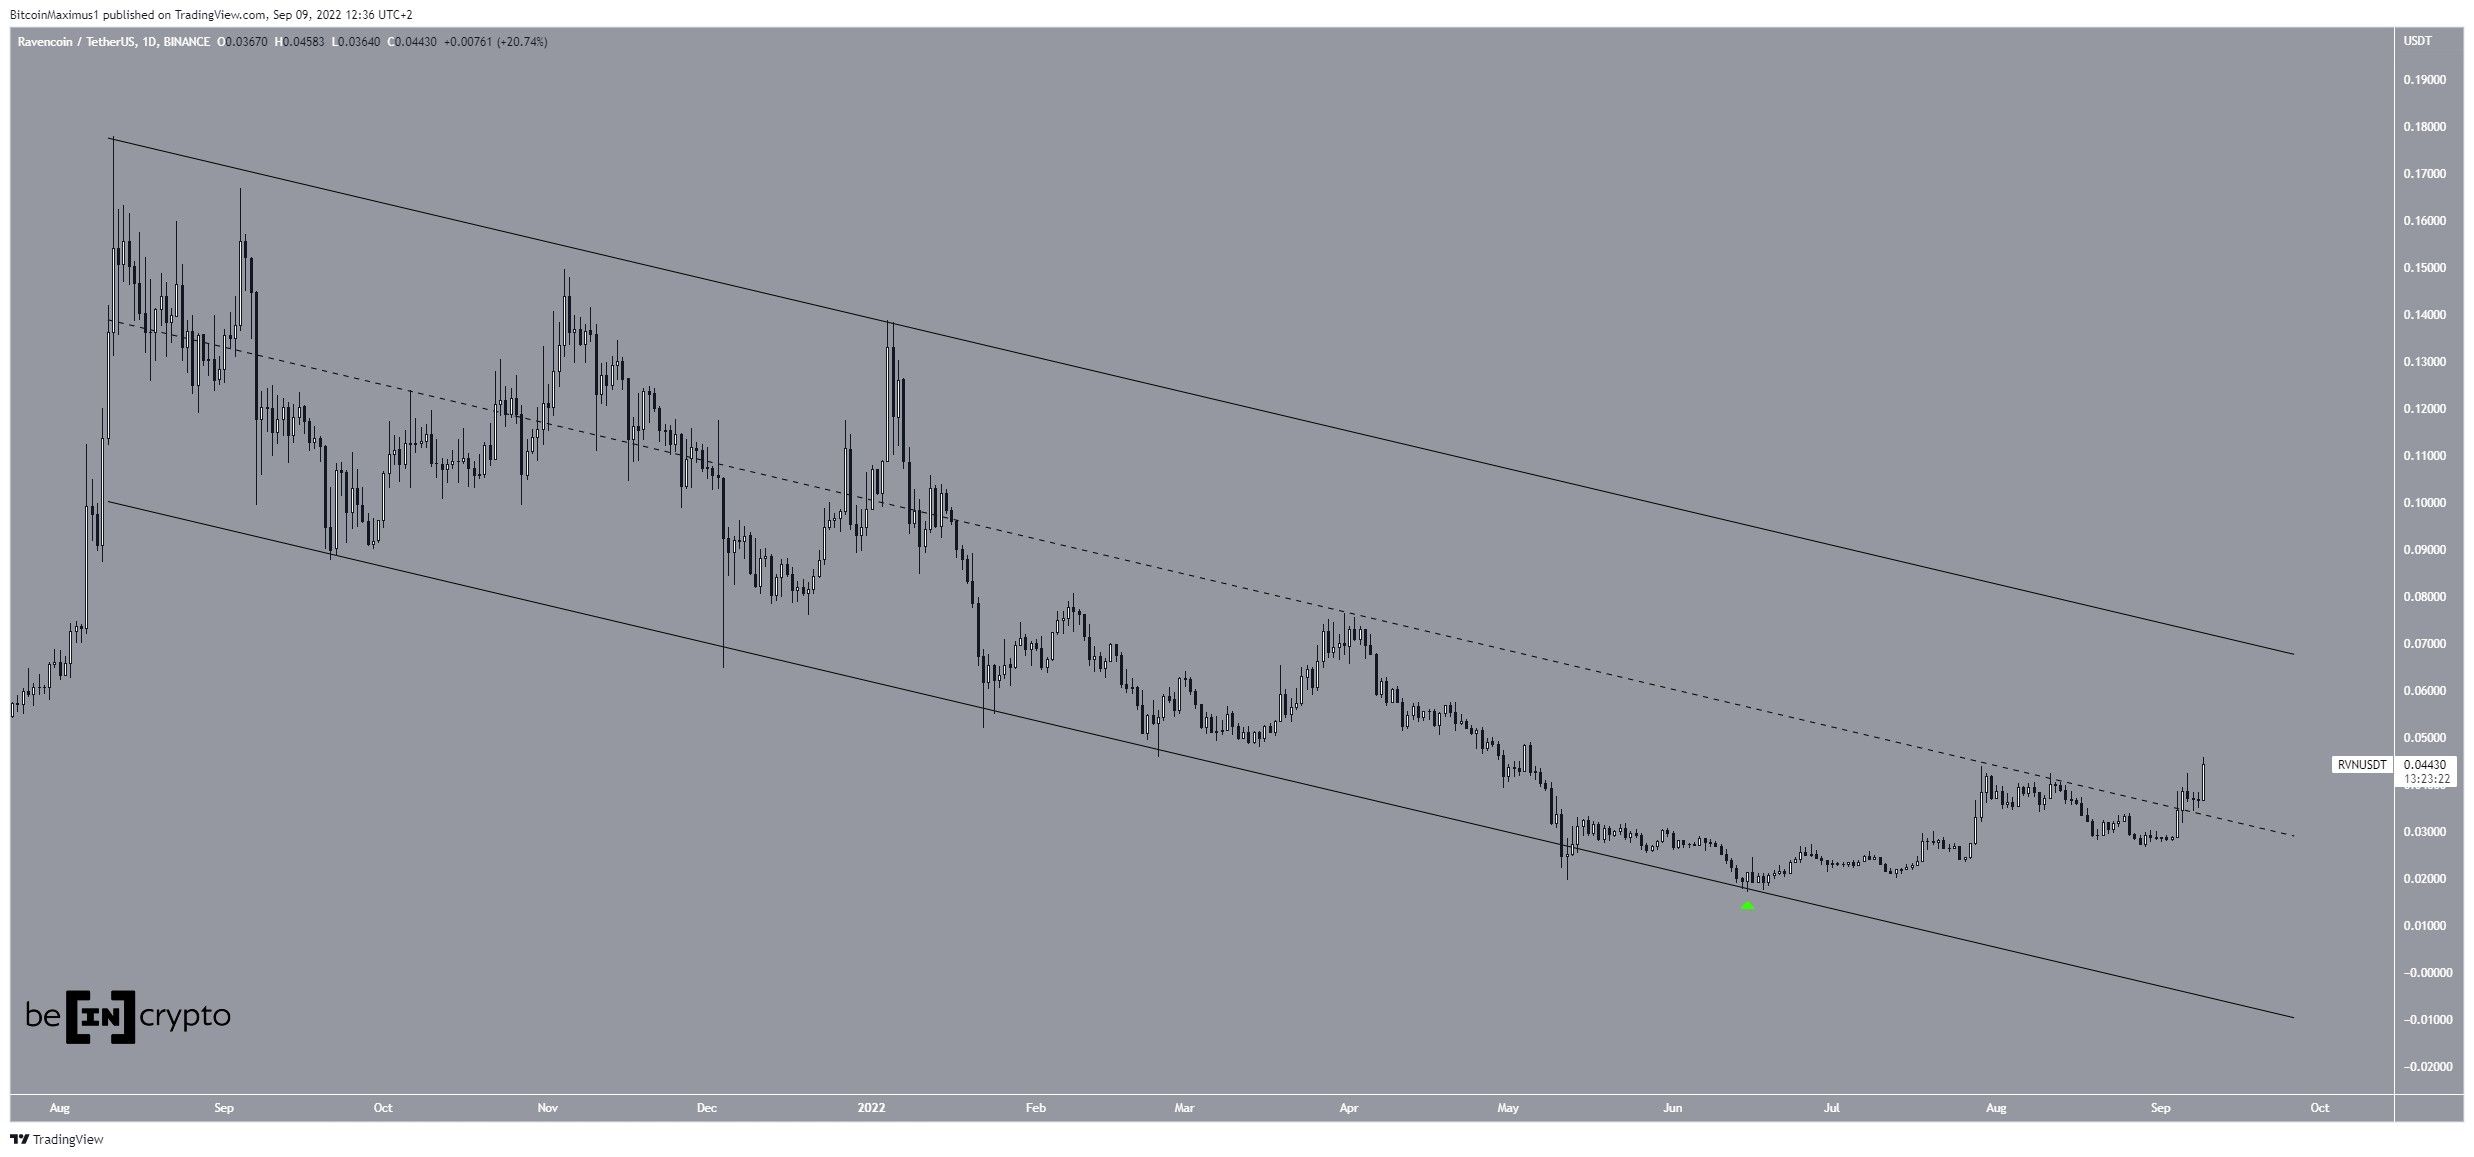
RVN has been decreasing inside a long-term descending parallel channel since Aug 2021. The downward movement has led to a low of $0.017 in June 2022. The price has been increasing since and managed to reclaim the middle of the channel on Aug 5.
The descending parallel channel is considered a bullish pattern, meaning that it is expected to lead to breakouts the majority of the time. When combined with the reclaim of the middle of the channel, this suggests that a movement towards the resistance line of the channel at $0.06 and potential breakout are likely.
ATOM
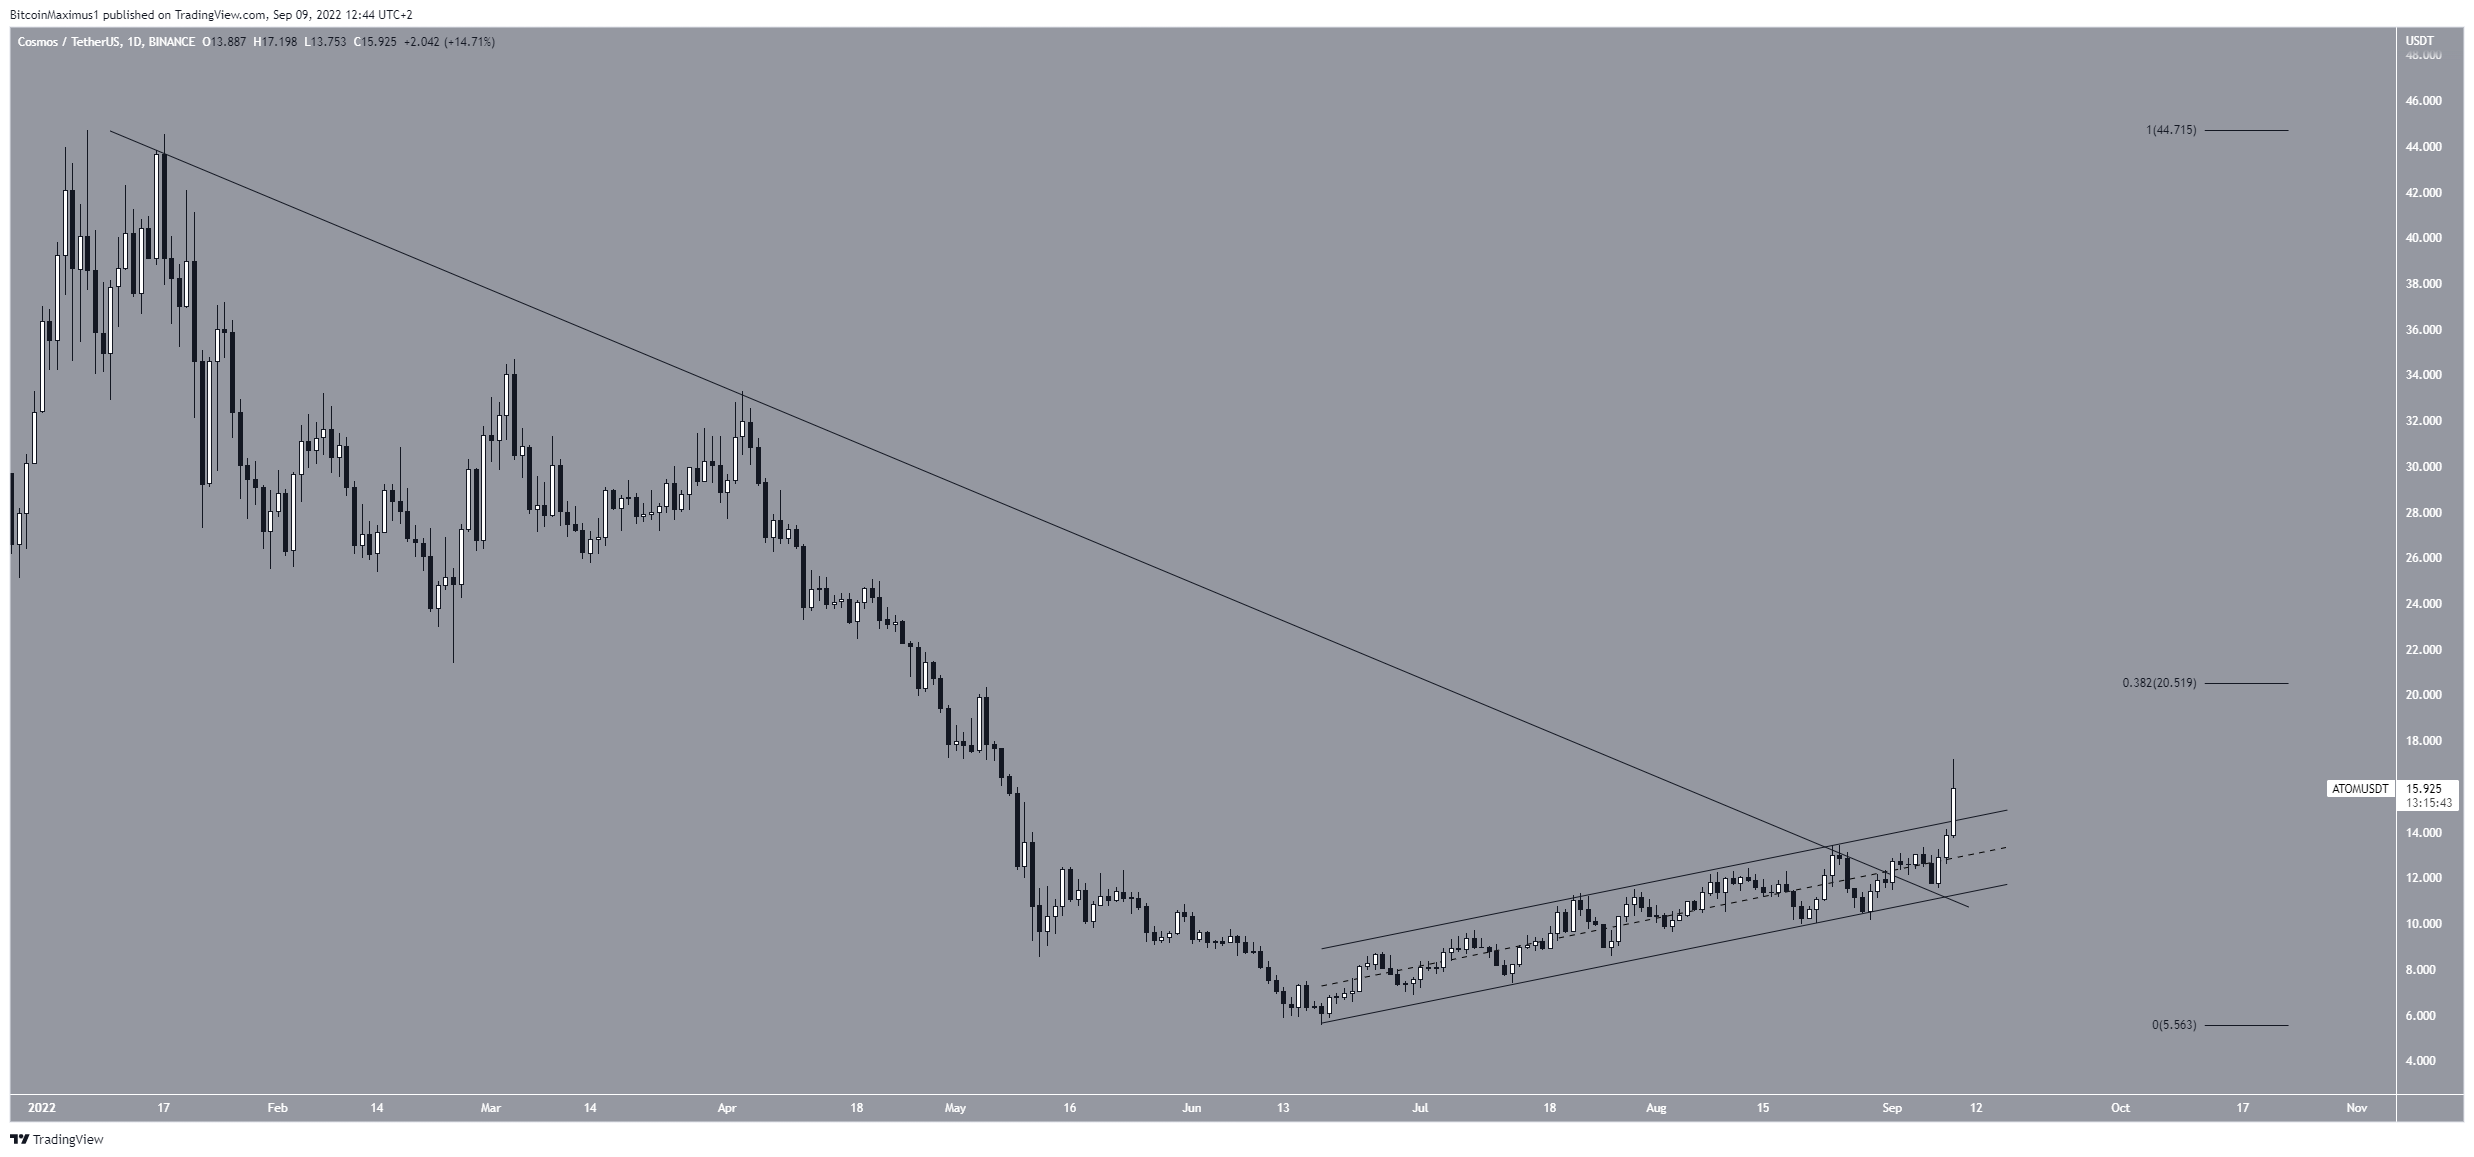
ATOM has been increasing inside an ascending parallel channel since June 18. While these channels usually contain corrective movements, ATOM managed to break out from it on Sept 9.
More importantly, this also caused a breakout from a long-term descending resistance line that had been in place since the Jan all-time high.
If the upward movement continues, the next closest resistance area would be at $20.50, created by the 0.382 Fib retracement resistance level of the entire downward movement since the all-time high.
ETC
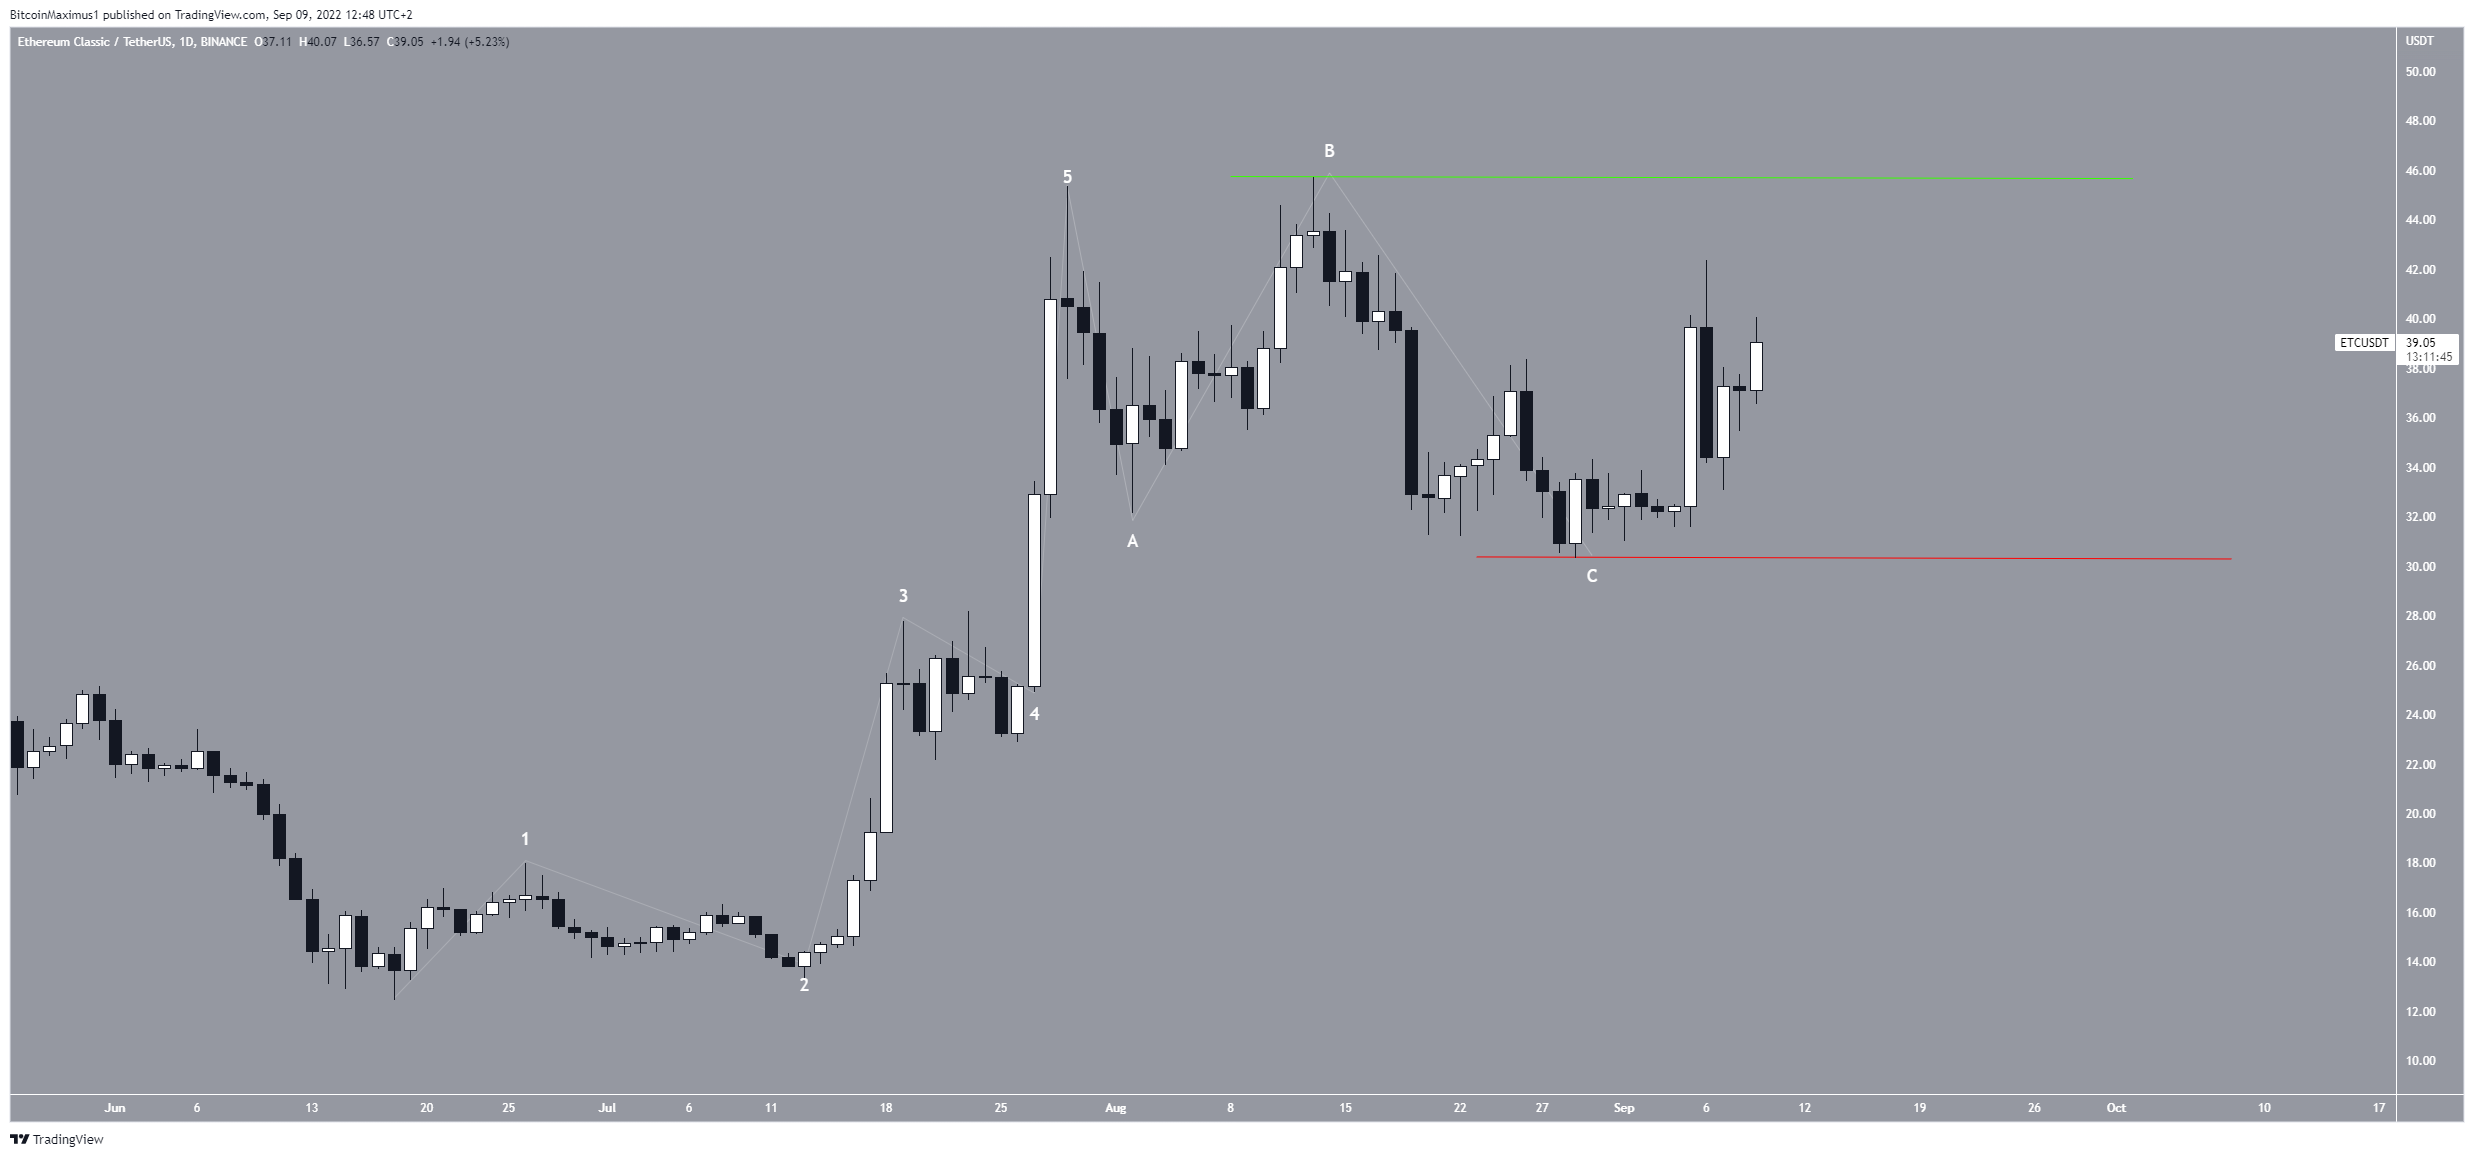
ETC has been moving upwards since reaching a low on June 18. The move led to a high of $45.36 on July 29. The price has been decreasing inside an A-B-C corrective structure since.
It is possible that the preceding increase is a five-wave upward movement. If so, ETC would be expected to increase towards new highs. A breakout above the $45.36 high (green line) would confirm this possibility while a drop below $30.34 (red line) would invalidate it.
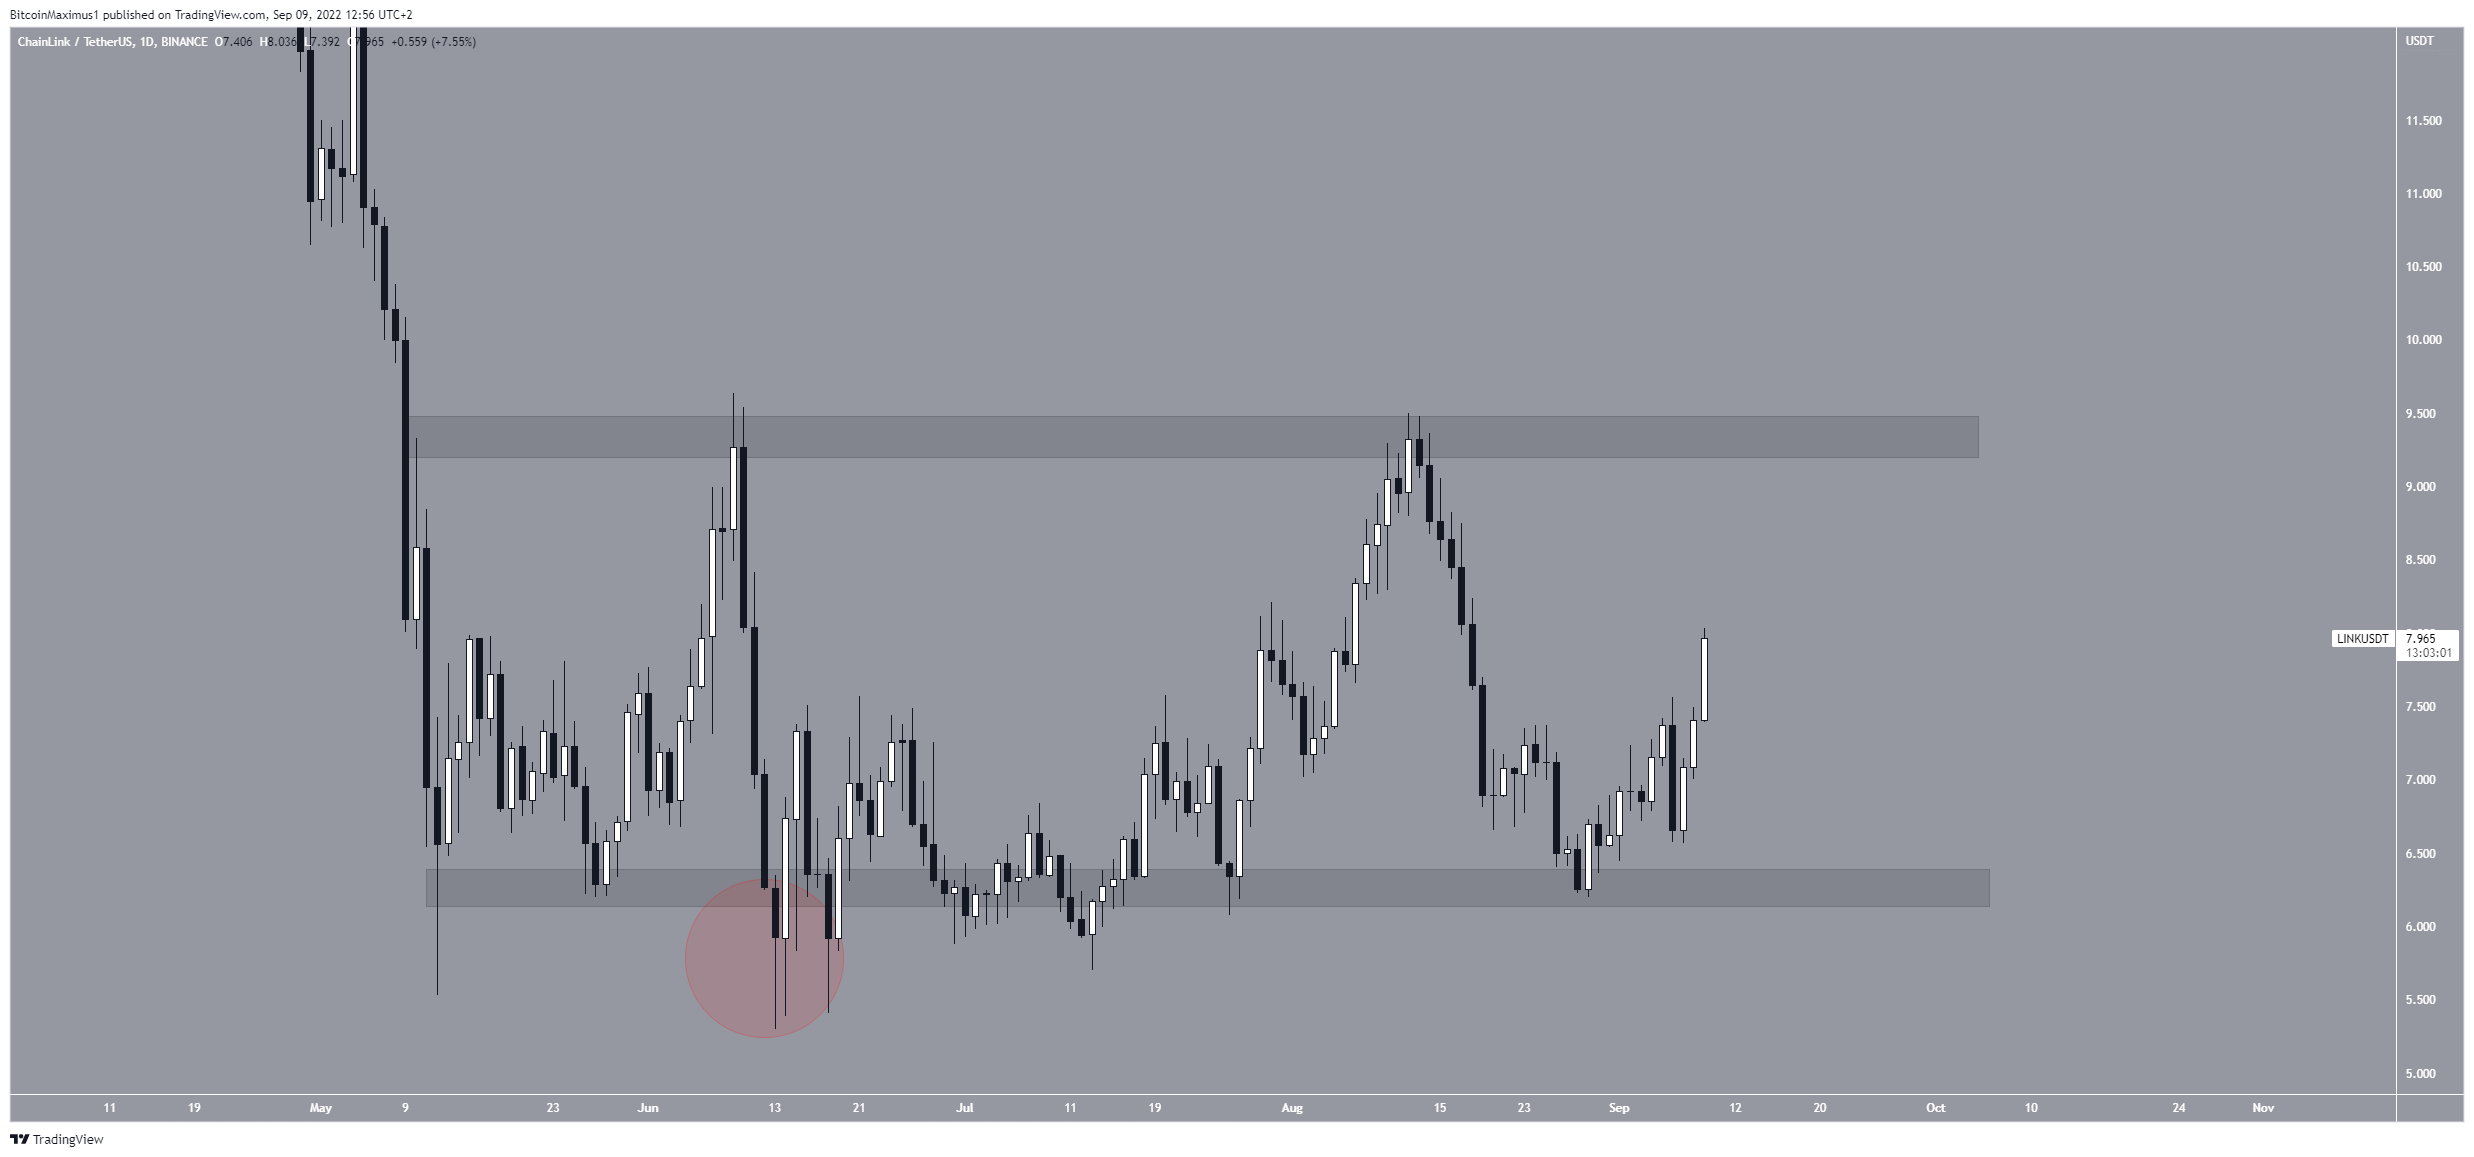
LINK
LINK has been trading close to the $6.20 horizontal support area since May 9. It deviated below this area (red circle) on June 13 before reclaiming the area.
This is a bullish development that often leads to significant price increases. LINK bounced at the $6.20 horizontal support area on Aug. 25 and has been increasing since.
A movement above the $9.30 resistance area would likely accelerate the rate of increase.
For Be[in]Crypto’s latest Bitcoin (BTC) analysis, click here


