
Terra (LUNA) has been decreasing since reaching an all-time high on March 21.
Algorand (ALGO) is trading inside an ascending parallel channel.
Kusama (KSM) is following a parabolic ascending support line.
Terra (LUNA)
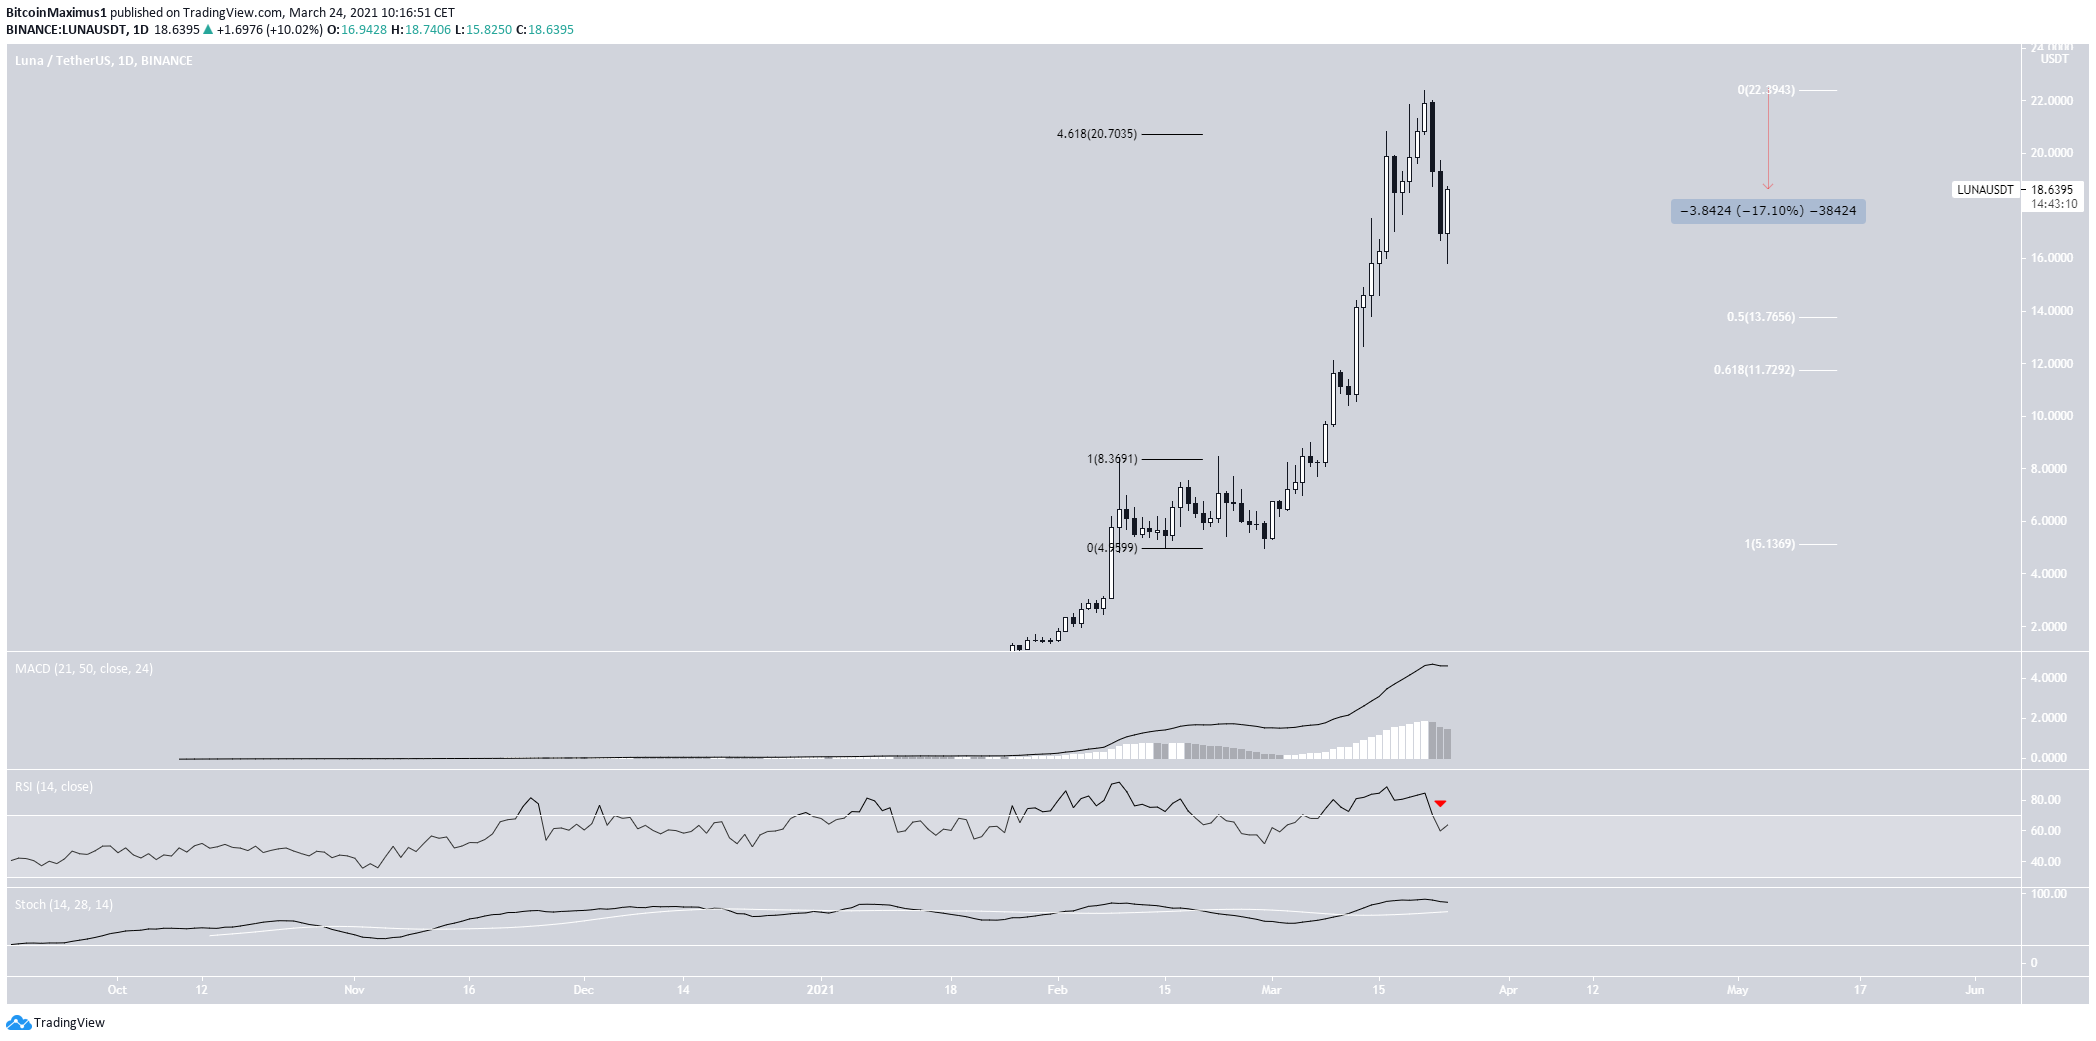
LUNA has been moving upwards since Feb. 28. On March 21, it managed to reach a new all-time high price of $22.40.
However, it has already moved above the 4.61 external Fib retracement of the most recent drop. This suggests a correction is likely in the short-term.
Since the high, LUNA has already decreased by 17%.
Technical indicators are bearish. The MACD has given a bearish reversal signal. The RSI has crossed below 70 but the Stochastic oscillator has not made a bearish cross. If this happens, it would likely confirm that the trend is bearish.
Therefore, it’s possible that LUNA continues to correct towards the 0.5-0.618 Fib retracement support area found between $11.72-$13.76.
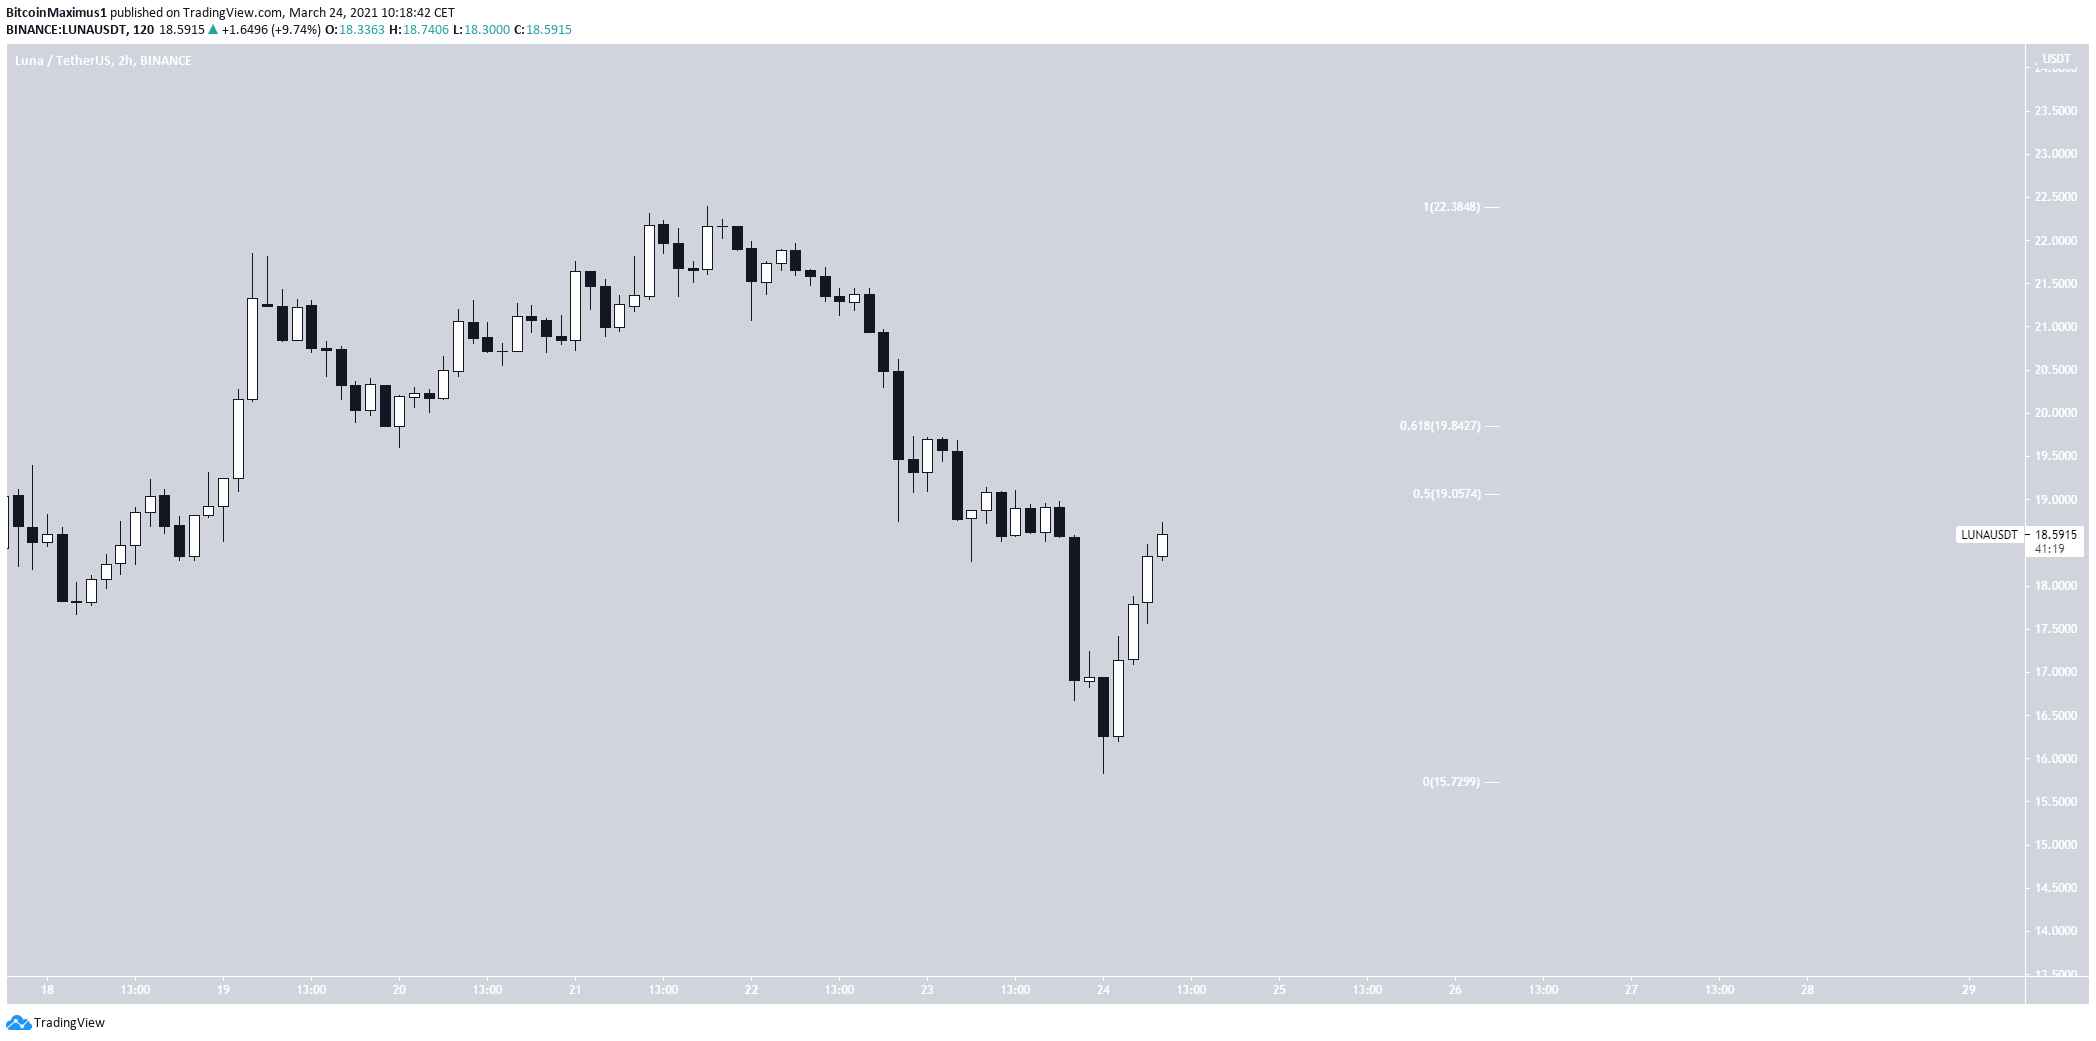
The two-hour chart shows an ongoing bounce. If the previously outlined scenario is to transpire, LUNA would probably get rejected between the 0.5-0.618 Fib retracement resistance area before dropping.
Highlights
- LUNA has decreased by 17% since its all-time high.
- Technical indicators in the daily time-frame are bearish.
Algorand (ALGO)
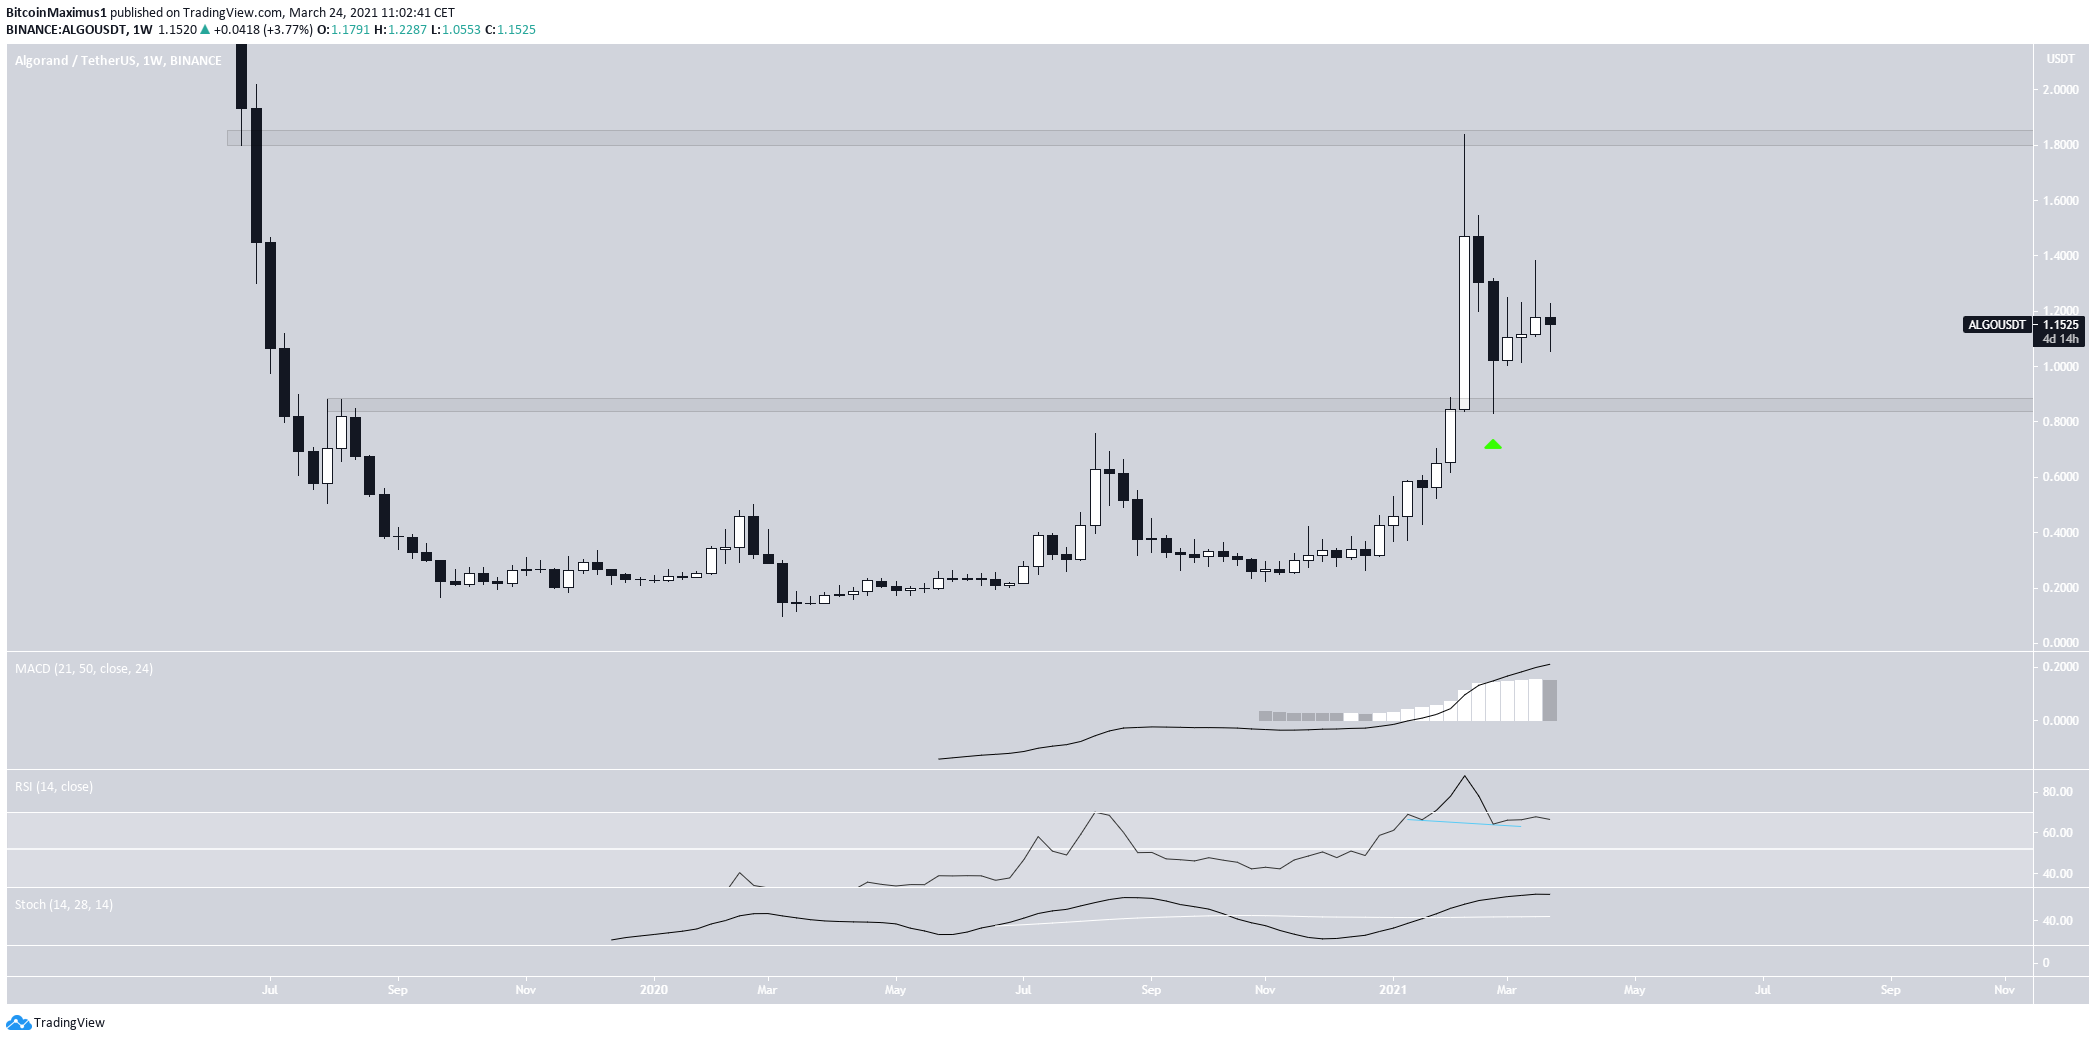
At the beginning of February, ALGO broke out above the long-term $0.86 resistance area. Afterwards, it returned to validate this area as support and has been moving upwards since.
The increase was preceded by hidden bullish divergence in the RSI. Also, both the MACD and Stochastic oscillator are moving upwards. Therefore, it is likely that the long-term trend is still bullish.
The closest resistance is located at $1.90.
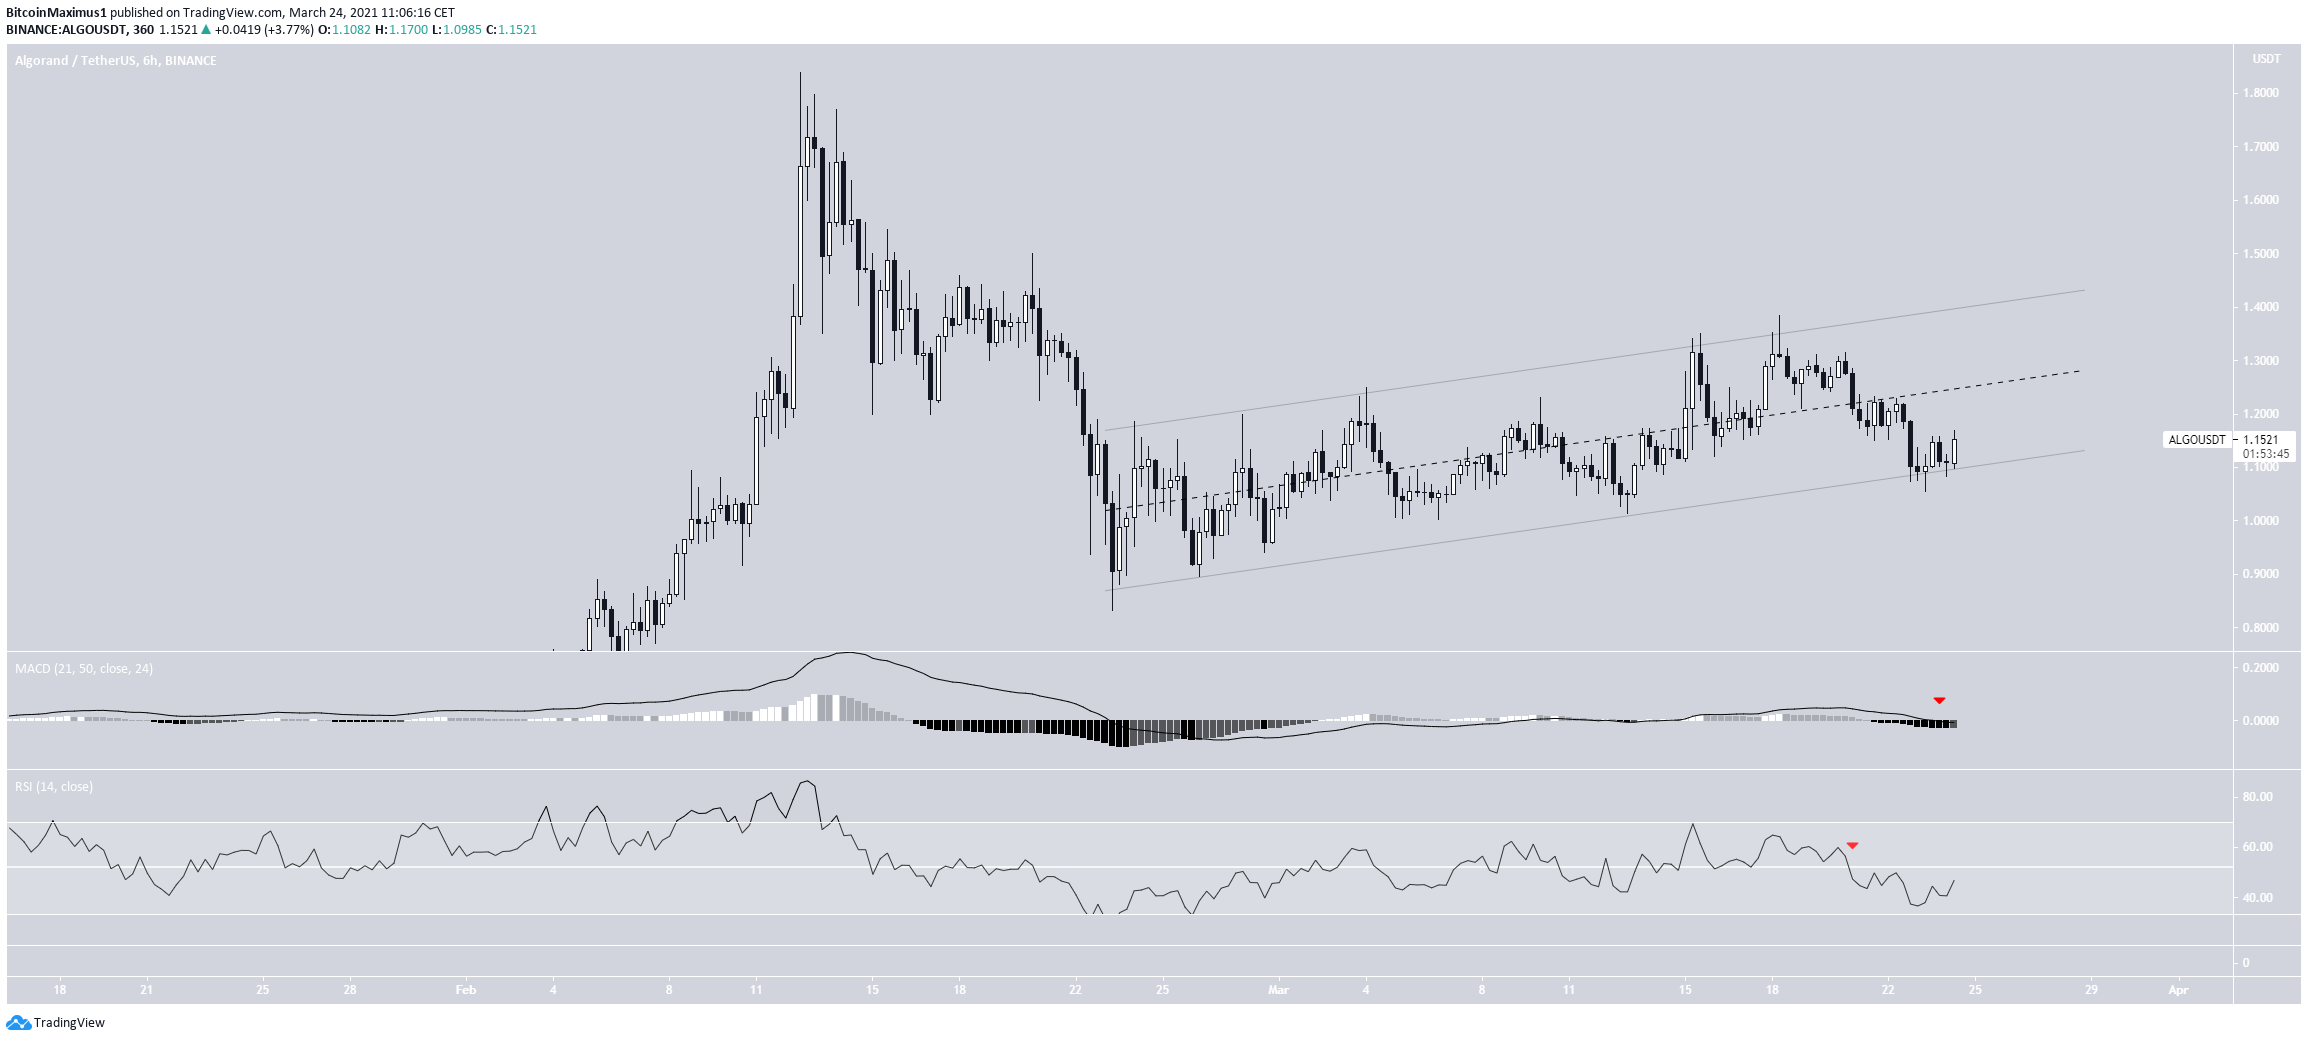
However, the six-hour chart is not as bullish. ALGO is trading inside an ascending parallel channel in what is likely a corrective movement.
Both the decreasing RSI and MACD support the possibility of a breakdown.
Therefore, it’s likely that ALGO drops towards the $0.86 level once more before potentially moving higher.
Highlights
- ALGO is trading inside an ascending parallel channel.
- There is long-term support and resistance at $0.85 and $1.90 respectively.
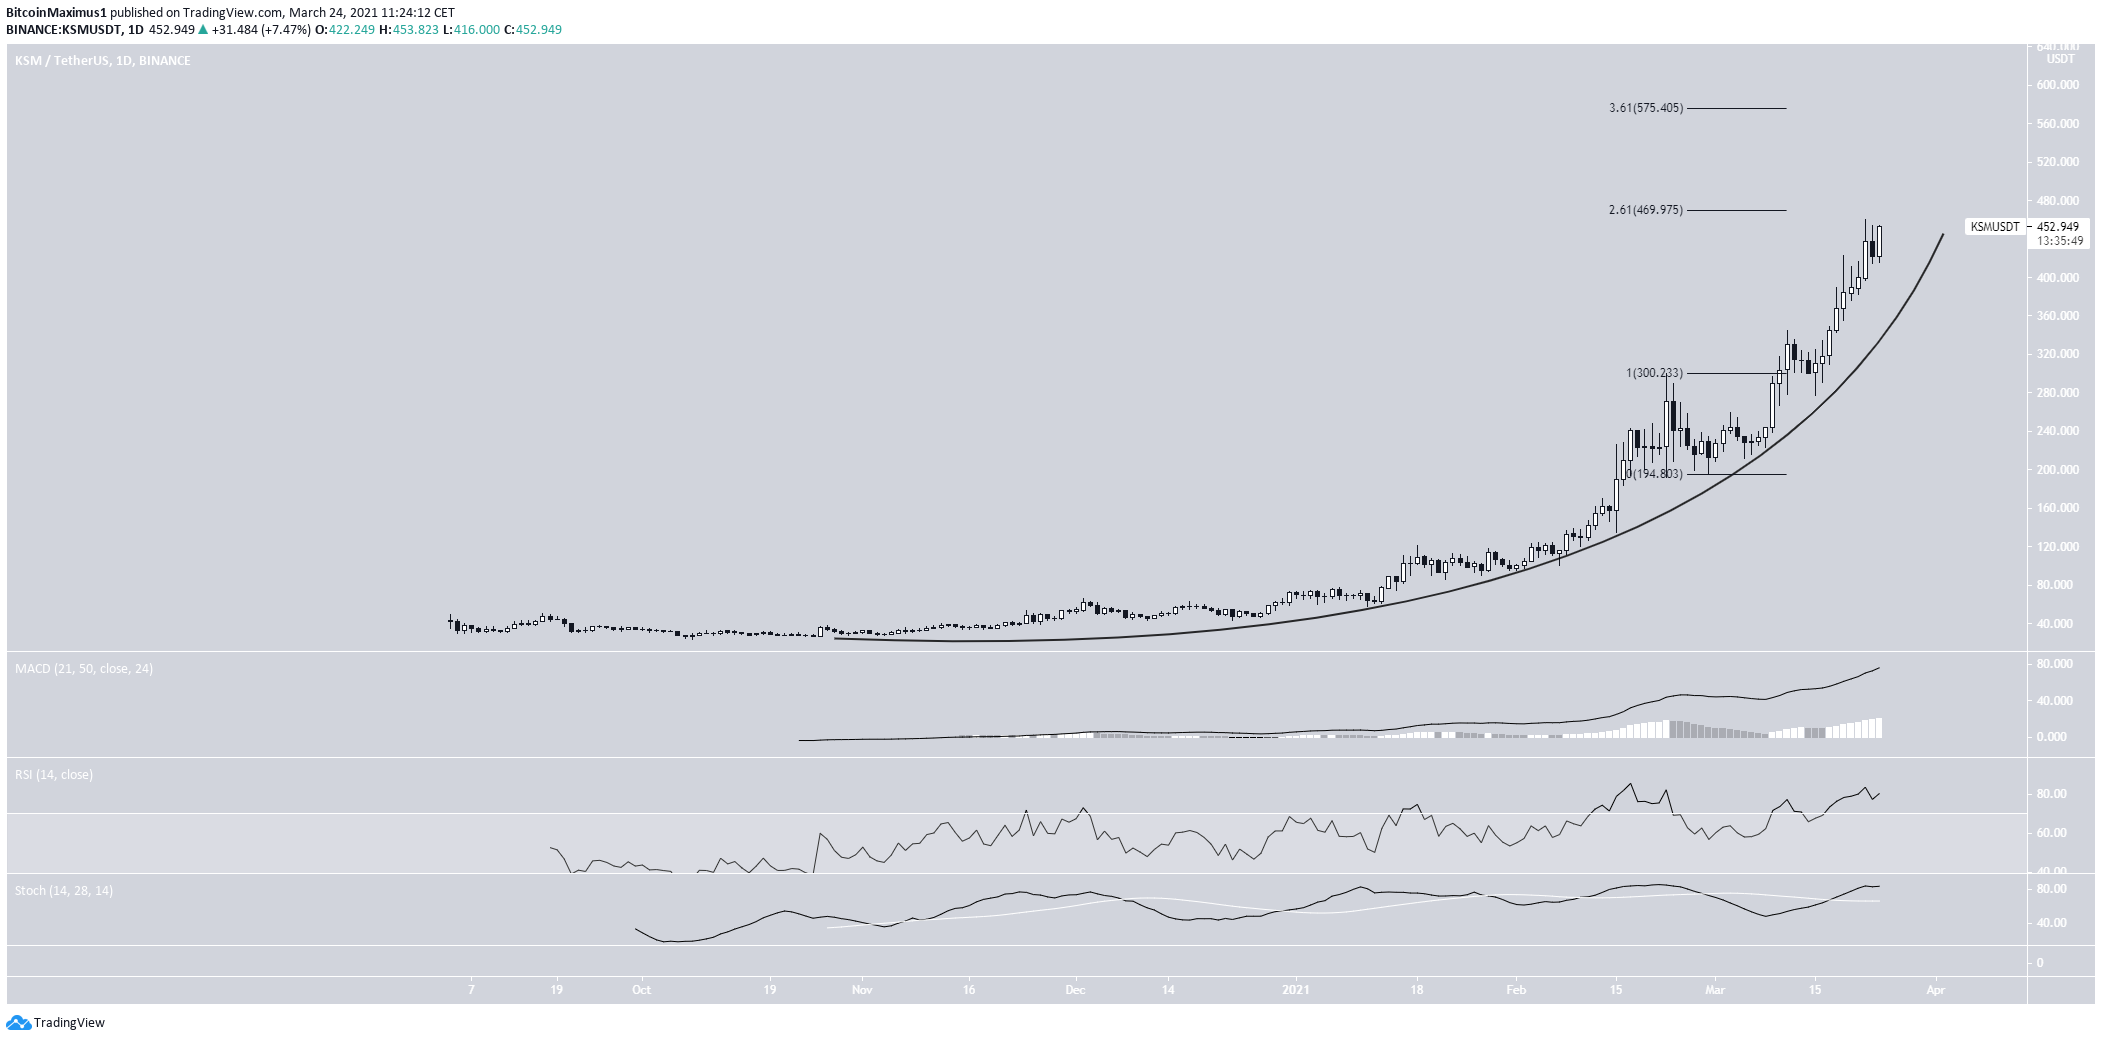
Kusama (KSM)
KSM has been following a parabolic ascending support line since October 2020. So far, it has reached a high of $460 on March 22, 2021.
The closest resistance levels are found at $470 and $575.
Technical indicators do not show any weakness yet. The MACD, RSI, and Stochastic oscillator are increasing.
Therefore, KSM is likely to increase towards the next resistance level at $575.
A daily close below the parabola would invalidate this possibility.
Highlights
- KSM is following a parabolic ascending support line.
- There is support at $470 and $575.
For BeInCrypto’s latest Bitcoin (BTC) analysis, click here.
