


Litecoin has seen steady price increases throughout 2019. On Apr 2, these accelerated as part of a market-wide spike.
By Apr 3, Litecoin nearly missed $100 when prices dropped from a high of $99.43.
A second attempt at $100 was made on Apr 6, when Litecoin a high of $98.80.
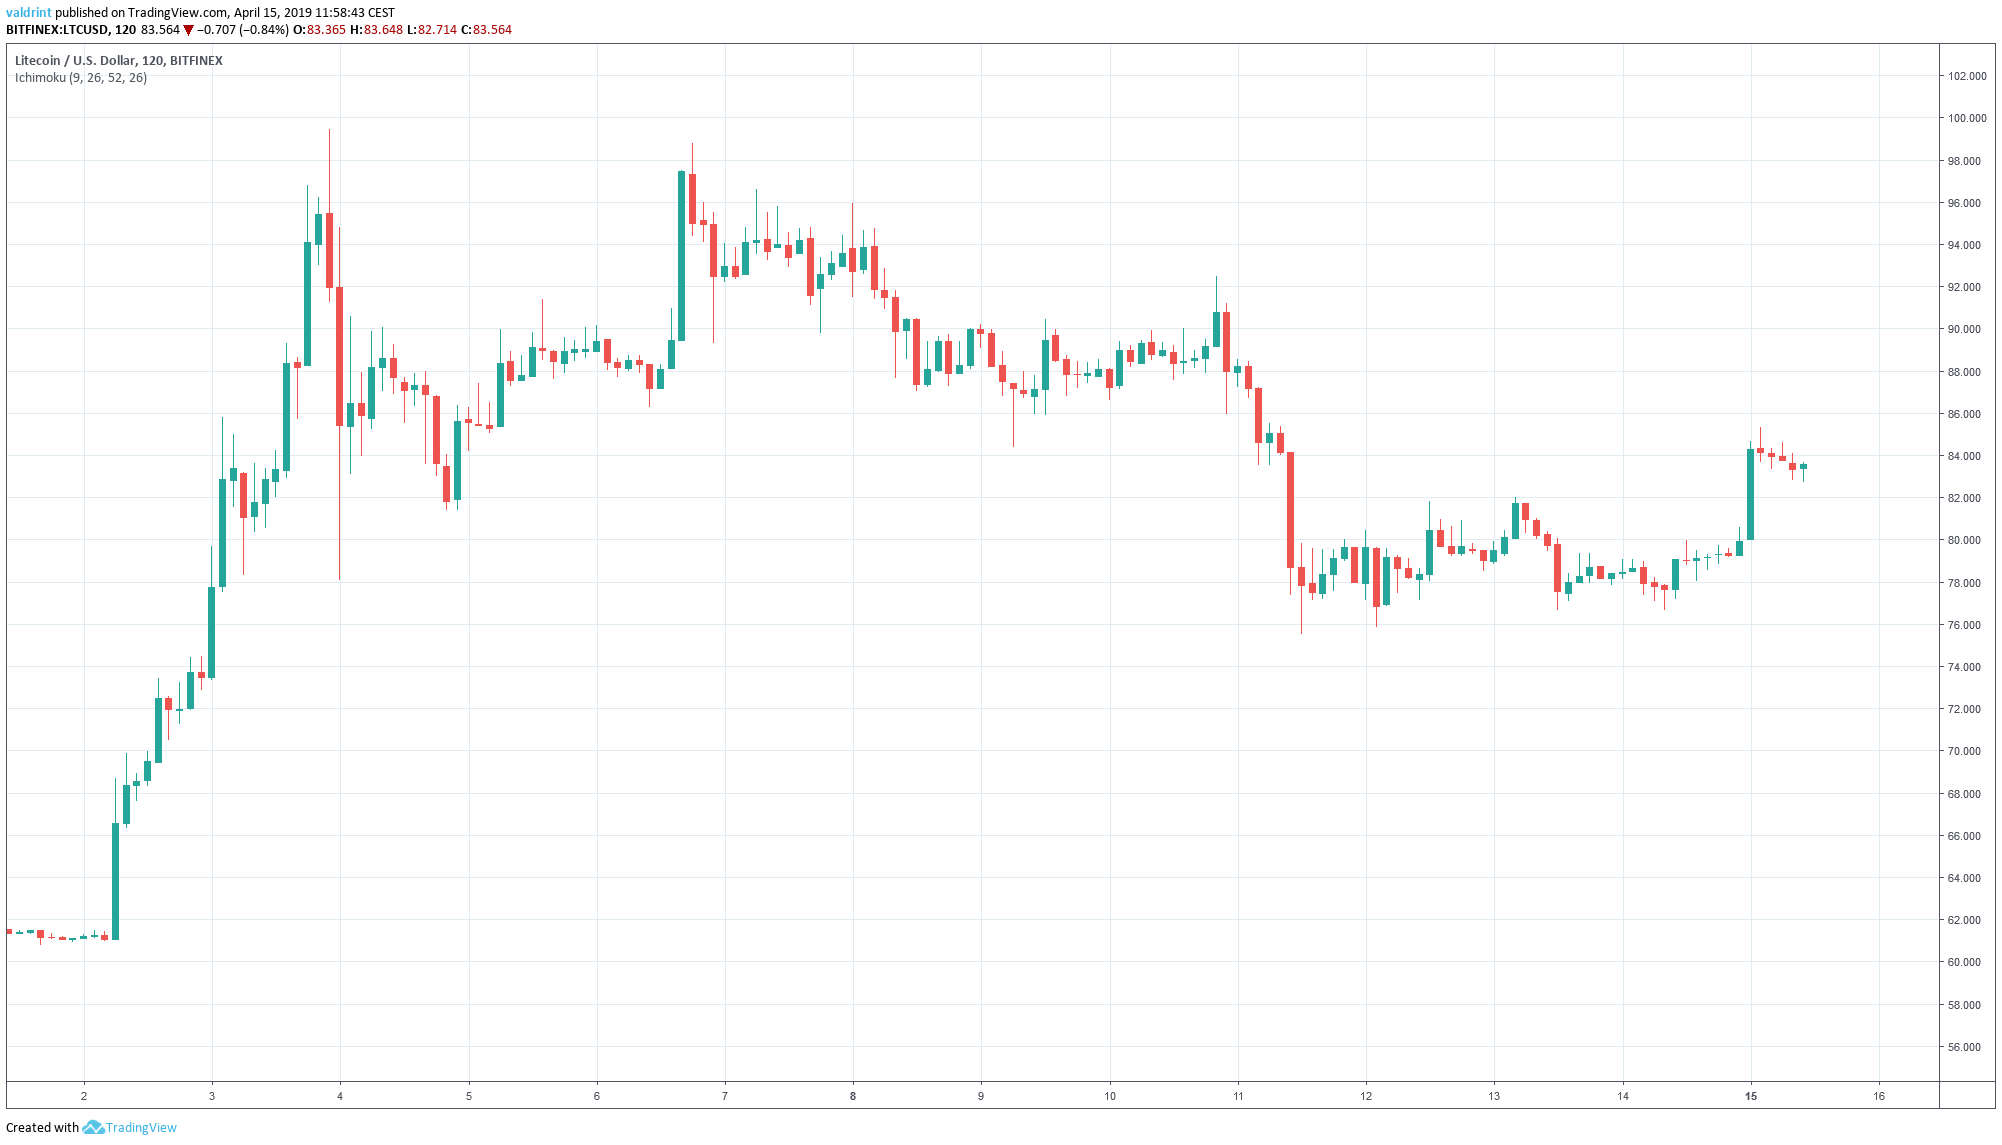
A gradual decrease followed. Losses accelerated on Apr 10. At the time of writing, the price was trading slightly above $80.
Will the price of Litecoin fall into the $70s or push back upward toward $100?
Let’s find out:
Litecoin (LTC): Trends And Highlights For April 15, 2019
- The price of LTC/USD has been on a downtrend since Apr 6.
- It is trading inside an ascending wedge.
- 50- and 200-period moving averages have made a bearish cross.
- There is resistance near $85 andsupport near $70.
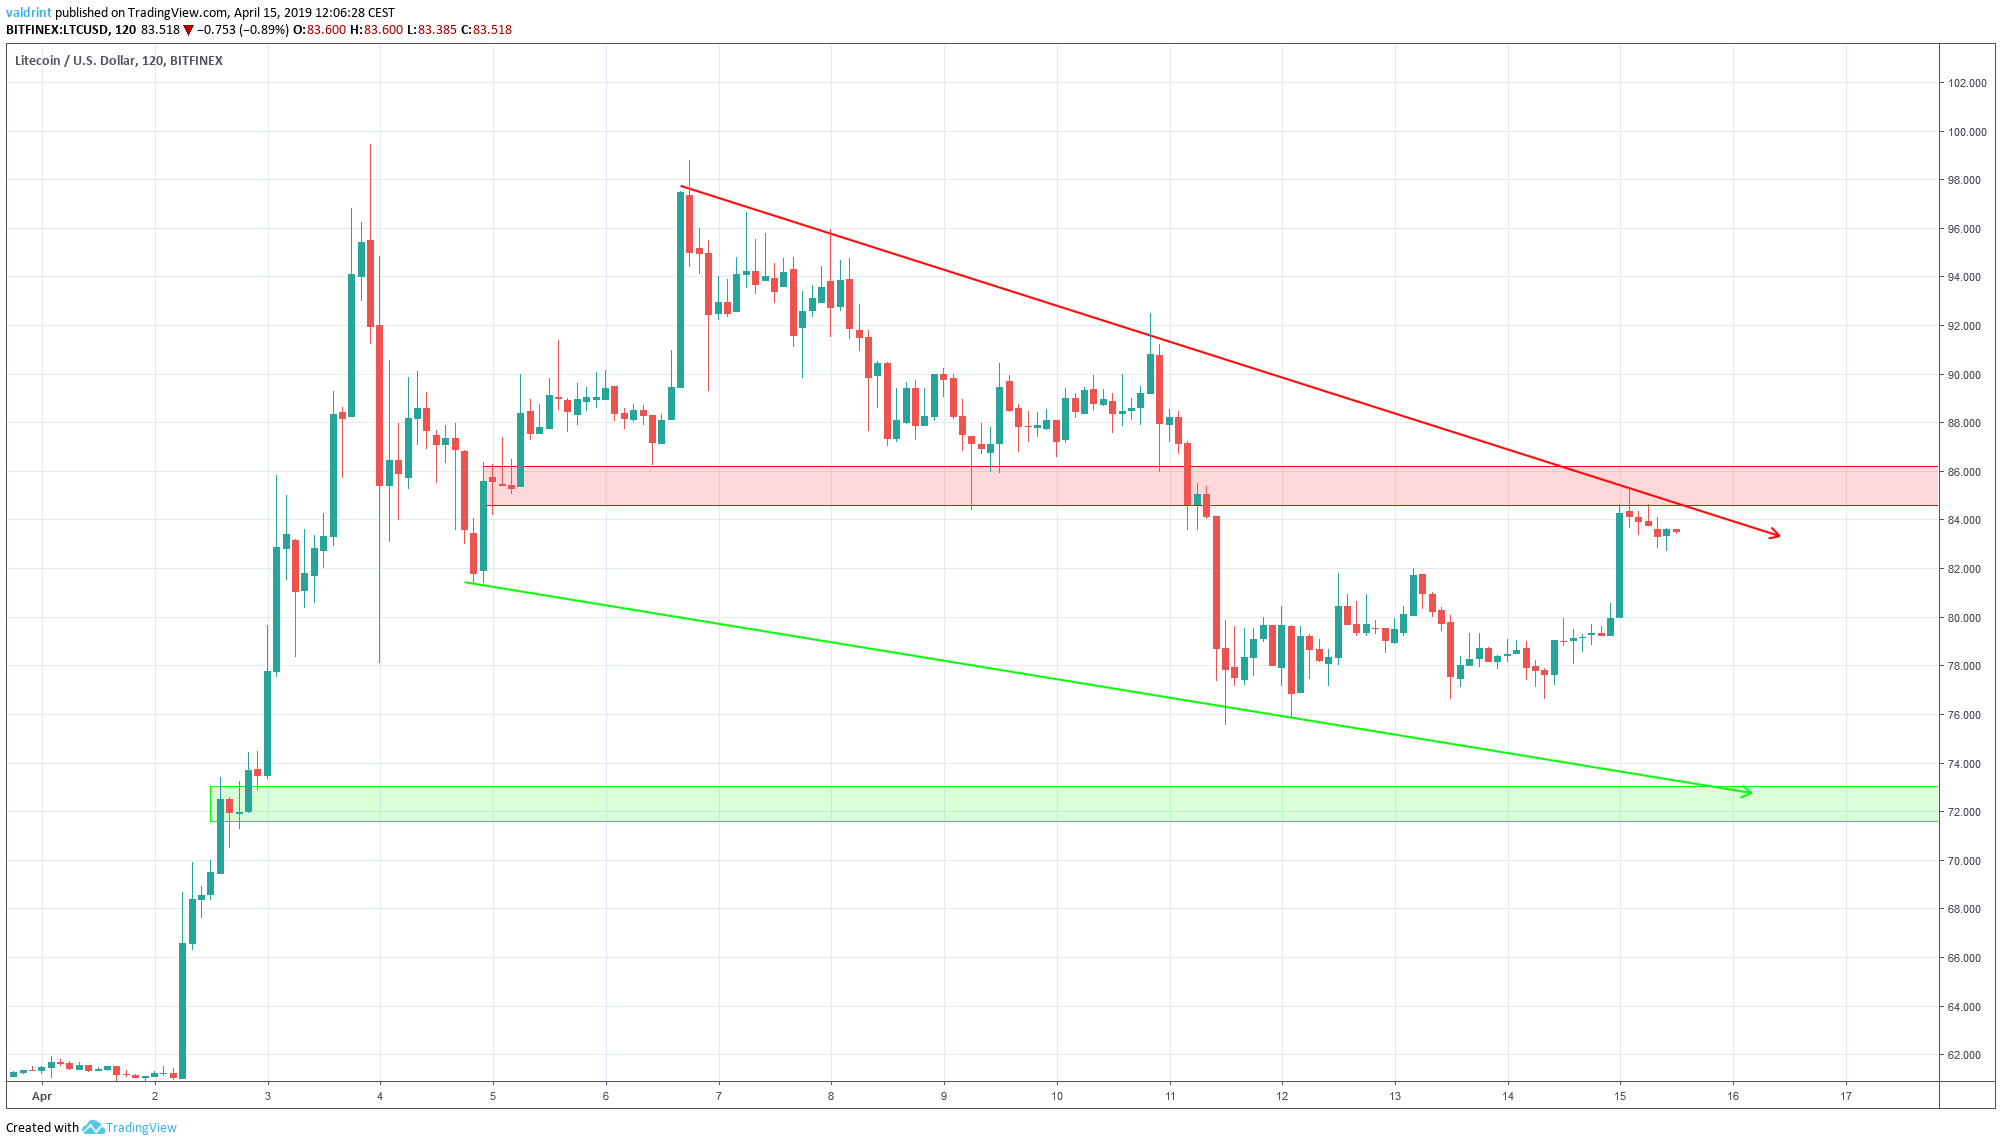
Descending Wedge
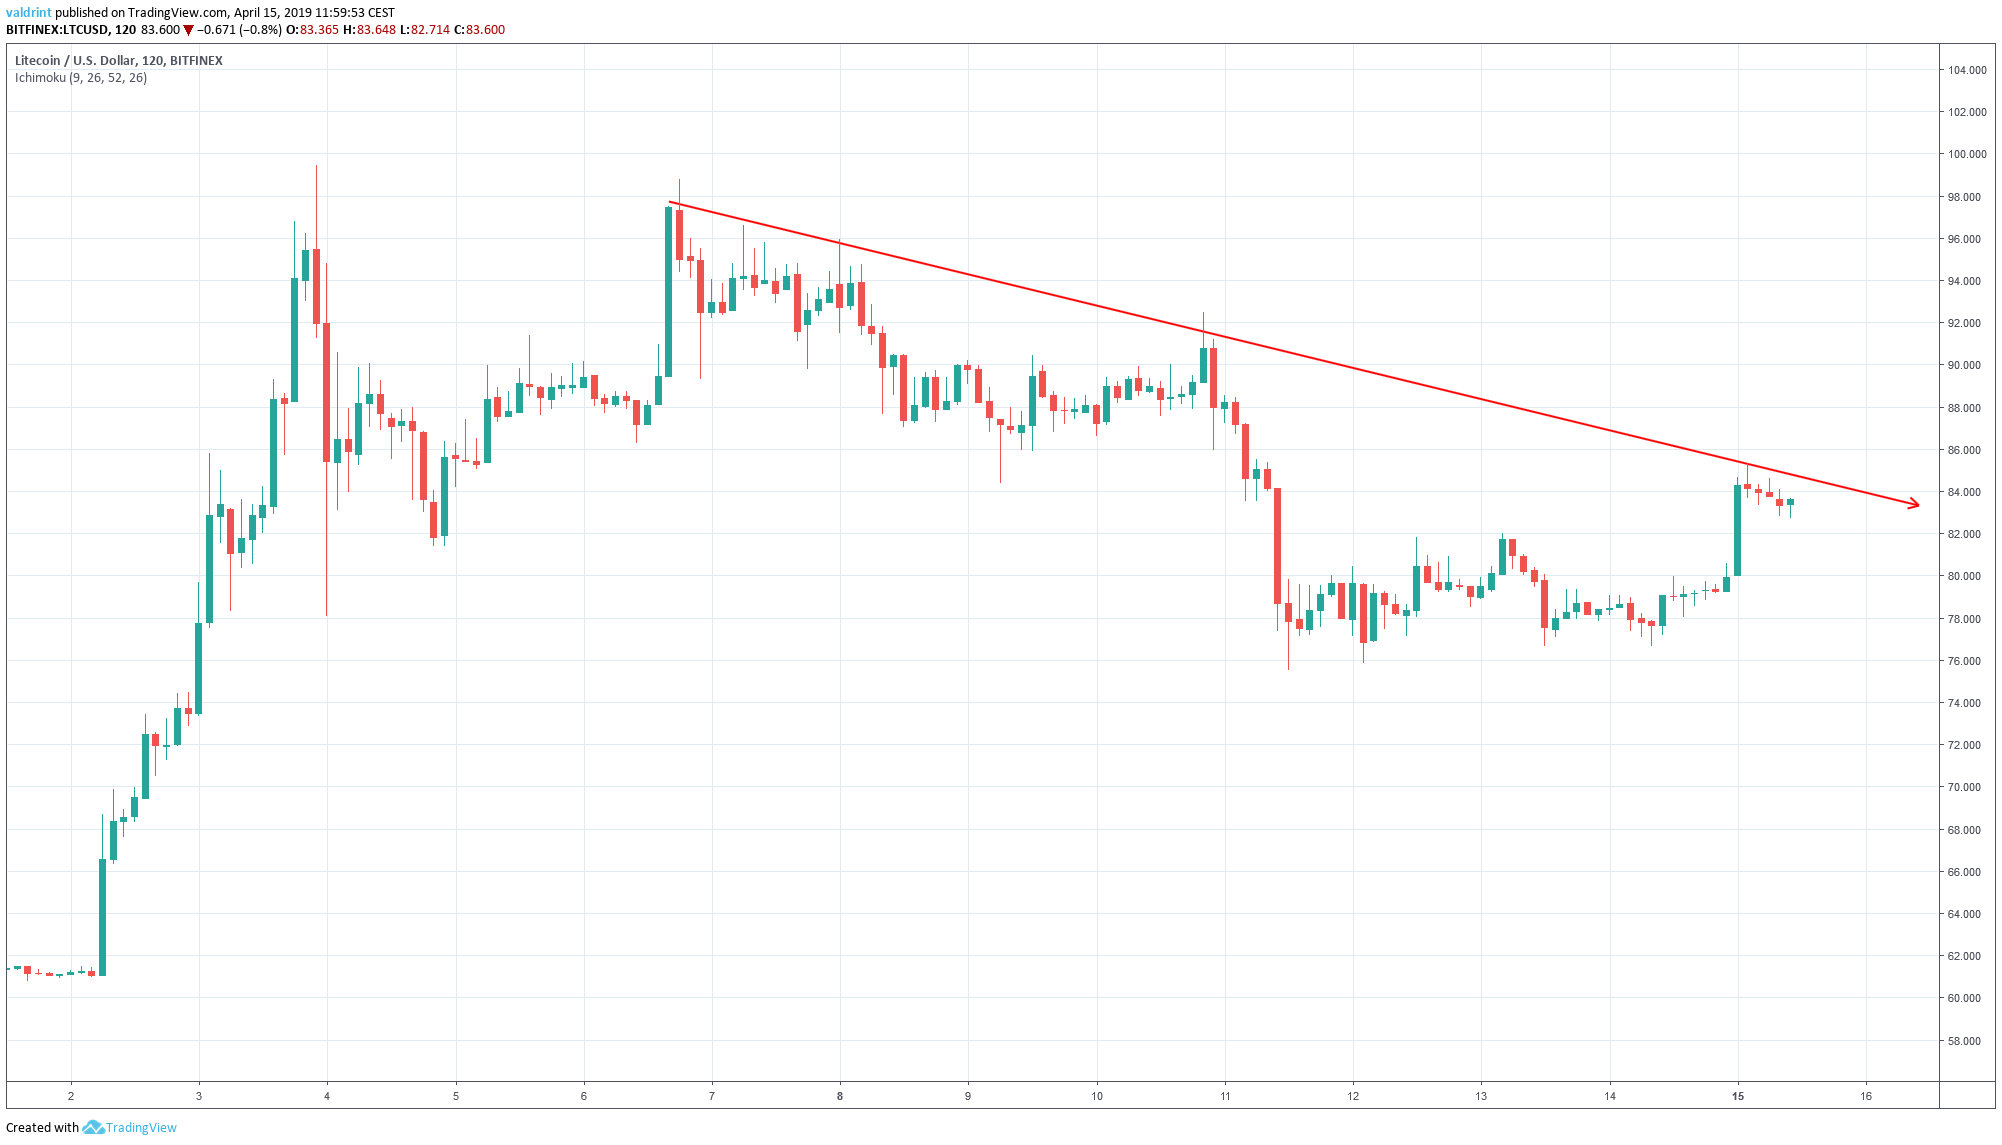
On Apr 6, the price reached a high of $98.8. Several market cycles have been completed and the price has made lower highs each time.
Tracing these highs gives us a descending resistance line:
On Apr 4, the price reached a low of $81.3. A gradual increase was followed by a gradual decrease. The price has made several lower lows. Tracing these lows gives us a descending support line.
The support and resistance lines combine to create a descending wedge:
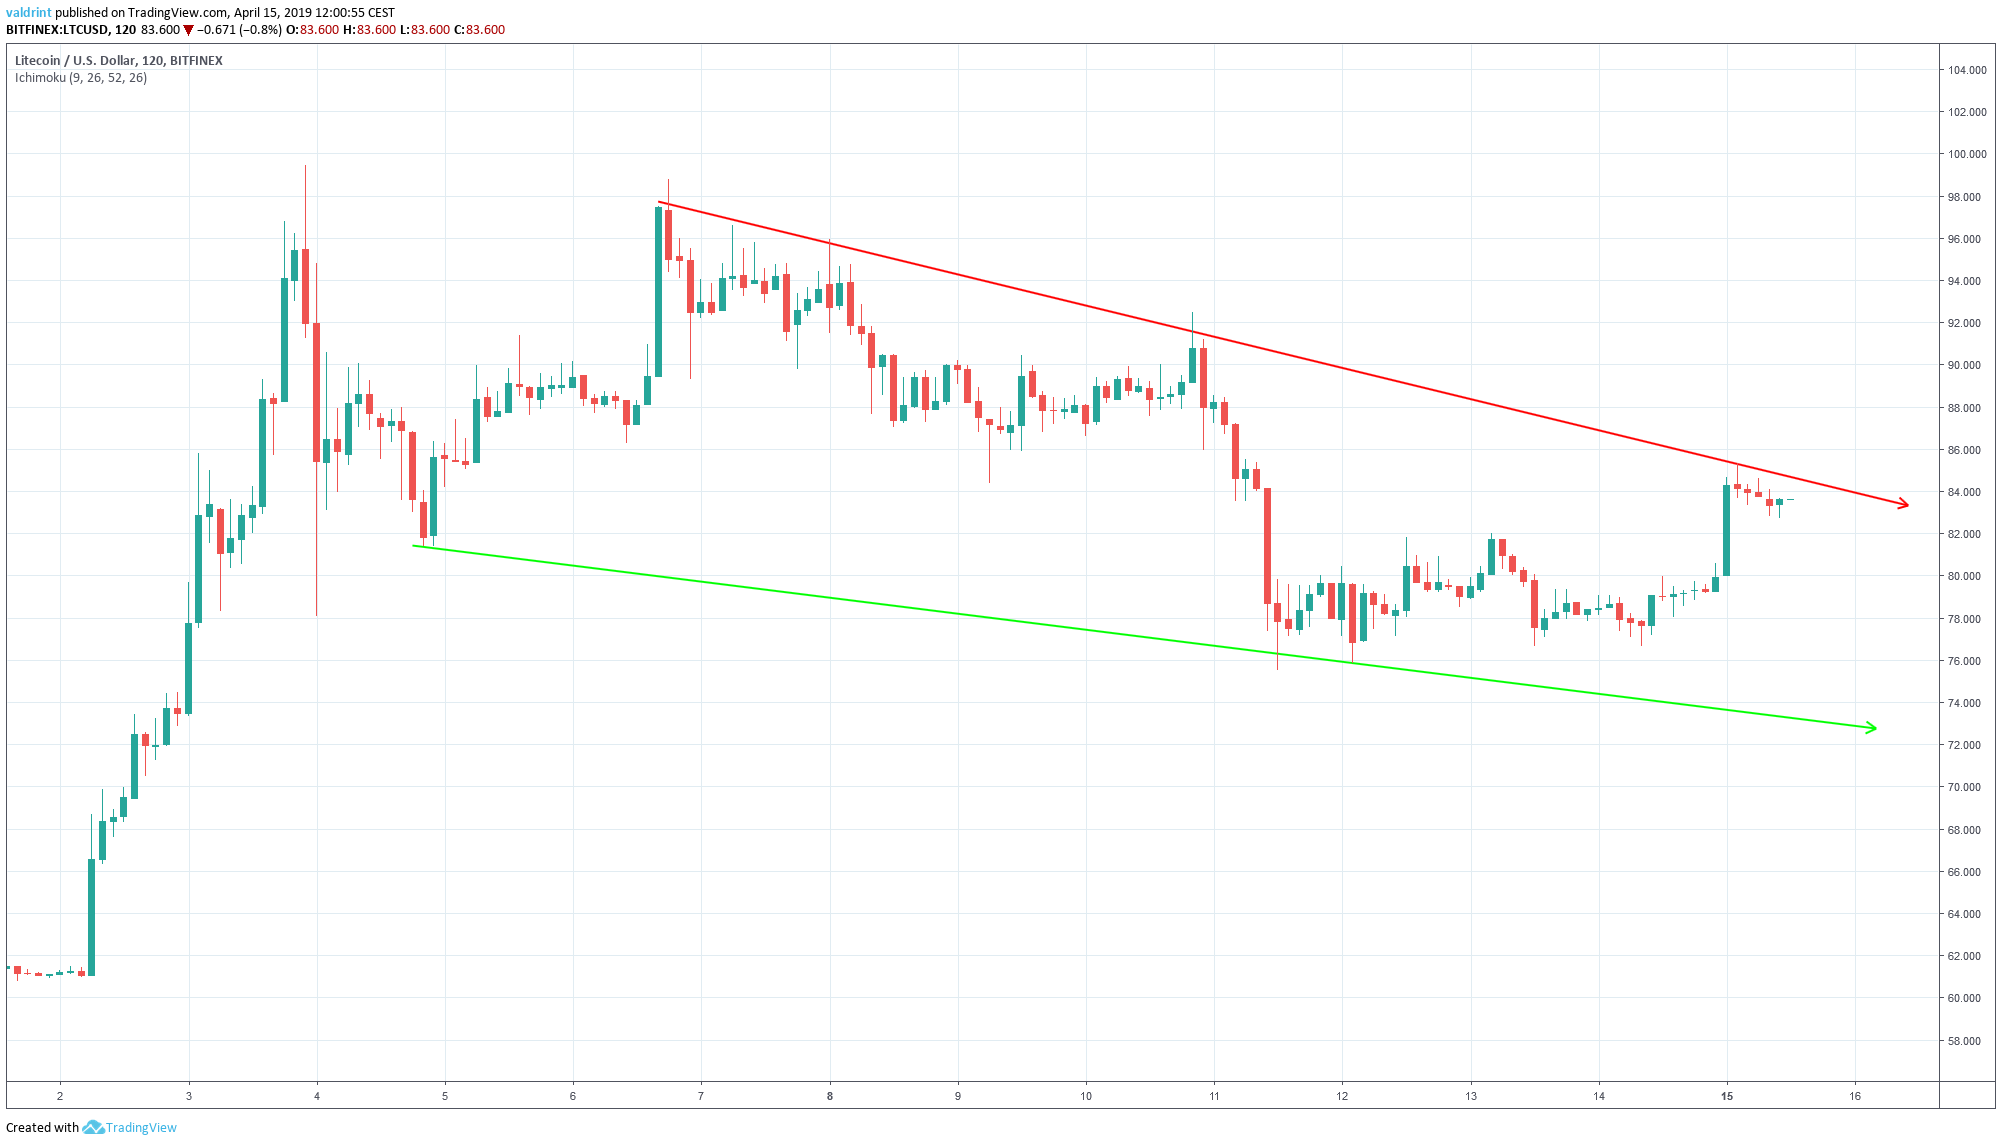
The price is likely to trade inside the confines of the wedge until a decisive move occurs. In order to predict the direction of the move, we need to take a look at previous movements combined with technical indicators.
Previous Breakdown
We begin by incorporating moving averages and volume.
Moving averages are tools used in technical analysis to smooth out price action. It is a lagging indicator since it is based on past prices. The relationship between short and long-term moving averages can help in identifying the beginning and end of a trend.
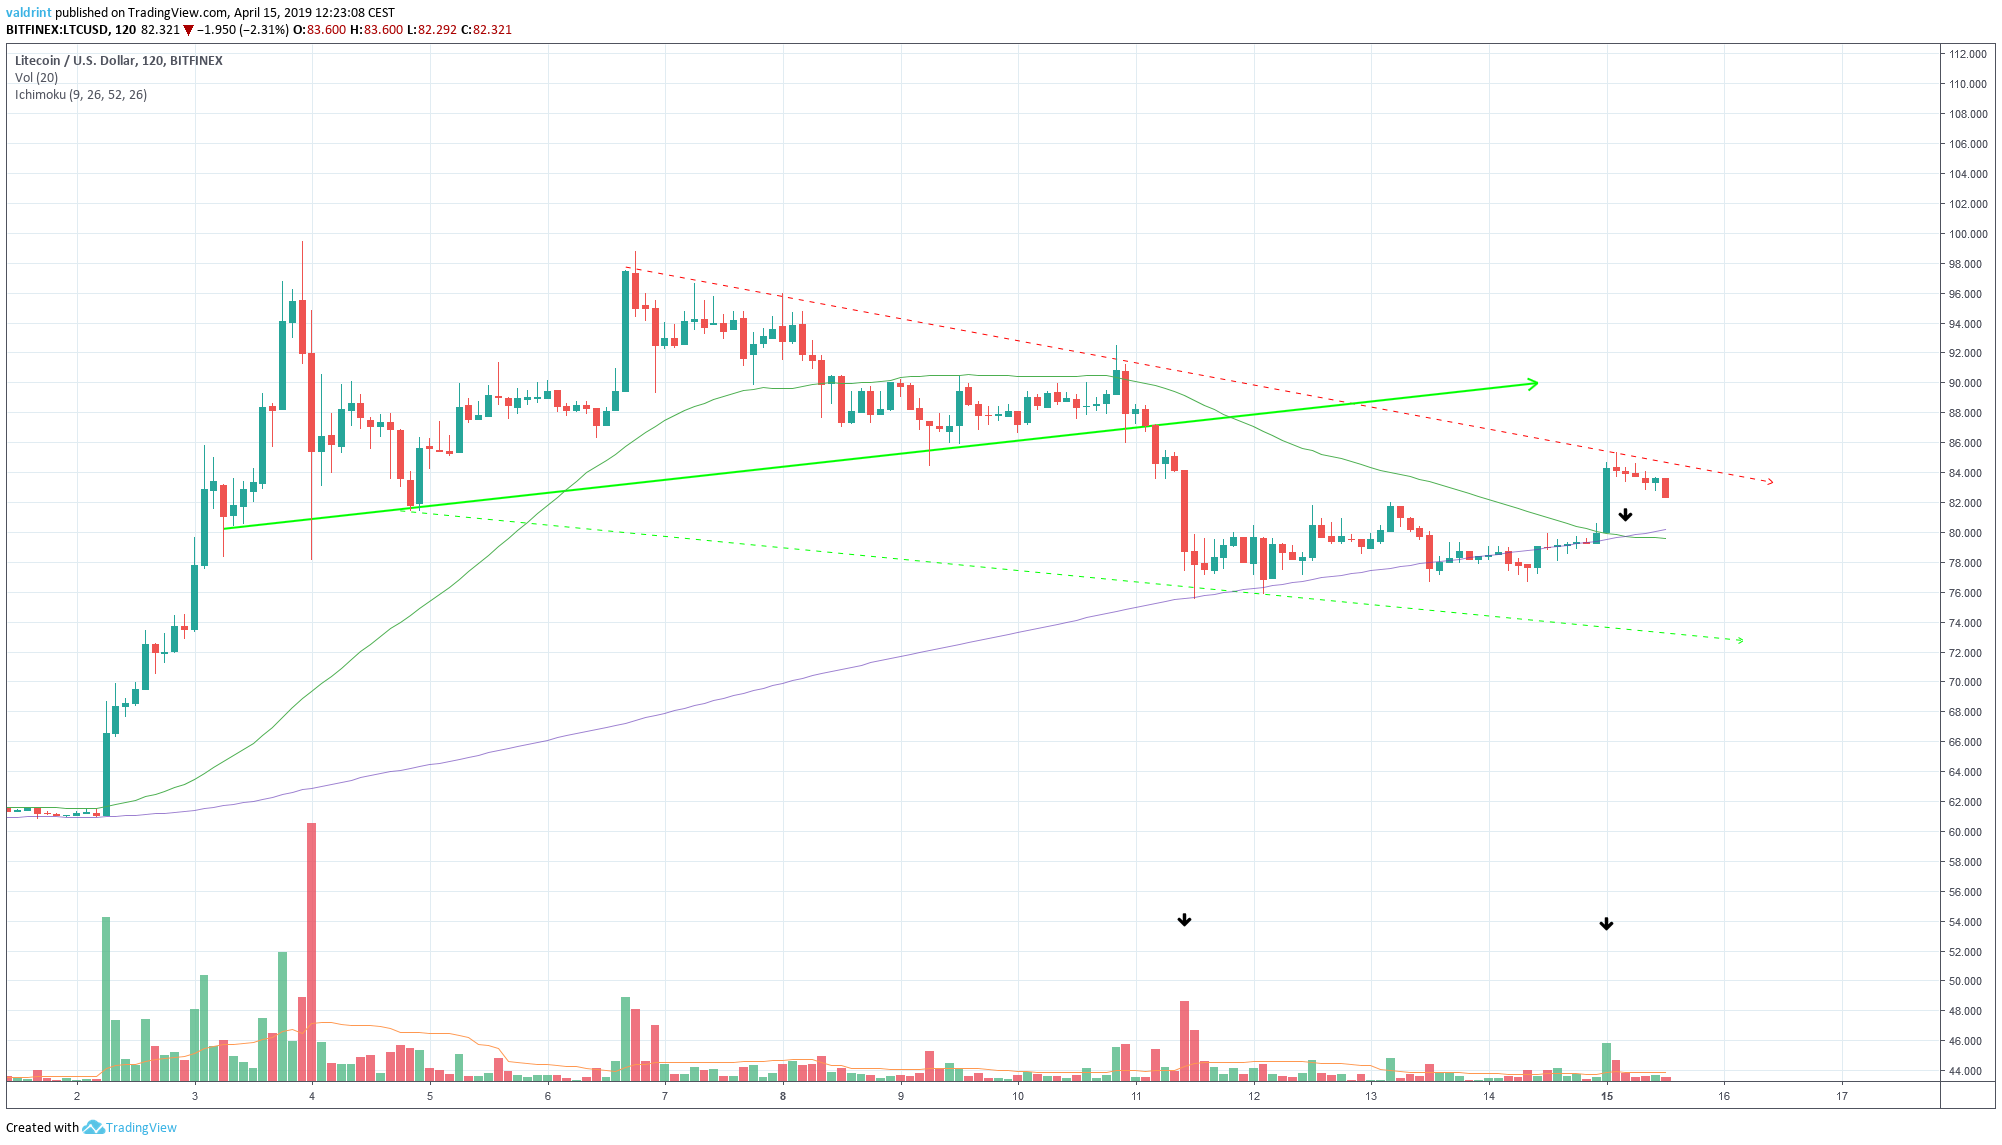
As stated in our previous analysis, the price had been following an ascending support line since Apr 3.
The breakdown on Apr 11 was combined with above-average volume. In contrast, the increase on Apr 15 occurred at a very low volume.
Furthermore, on Apr 15, the 50-period MA moved below the 200-period MA. This is known as a bearish cross and may indicate that a new downtrend has begun.
Using these indicators, it is unlikely that the price will break out of the wedge. Rather, we believe it will decrease towards the support line of the wedge.
Future Movement
The closest support area is found near $70. If the price keeps decreasing at the rate predicted by the wedge, it is likely to reach this area as long as it continues trading within the descending wedge.
The closest resistance area is found near $85. It coincides with the resistance line of the wedge. We do not believe the price will move above this area.
Summary Of Analysis
Based on this analysis, it is likely that the price will keep decreasing and reach the support line of the wedge. Prices within the $70s may be seen by the end of the day or later this week.
Do you think the price of LTC will decrease? Let us know in the comments below.
Disclaimer: This article is not trading advice and should not be construed as such. Always consult a trained financial professional before investing in cryptocurrencies, as the market is particularly volatile.


