


Litecoin has seen steady prices increases throughout 2019. On Apr 2, these accelerated as part of a market-wide spike.
By Apr 3, Litecoin reached a high of $99.43. A rapid decline was followed by a gradual increase. On Apr 6, another attempt at $100 was made when Litecoin reached a high of $98.80.
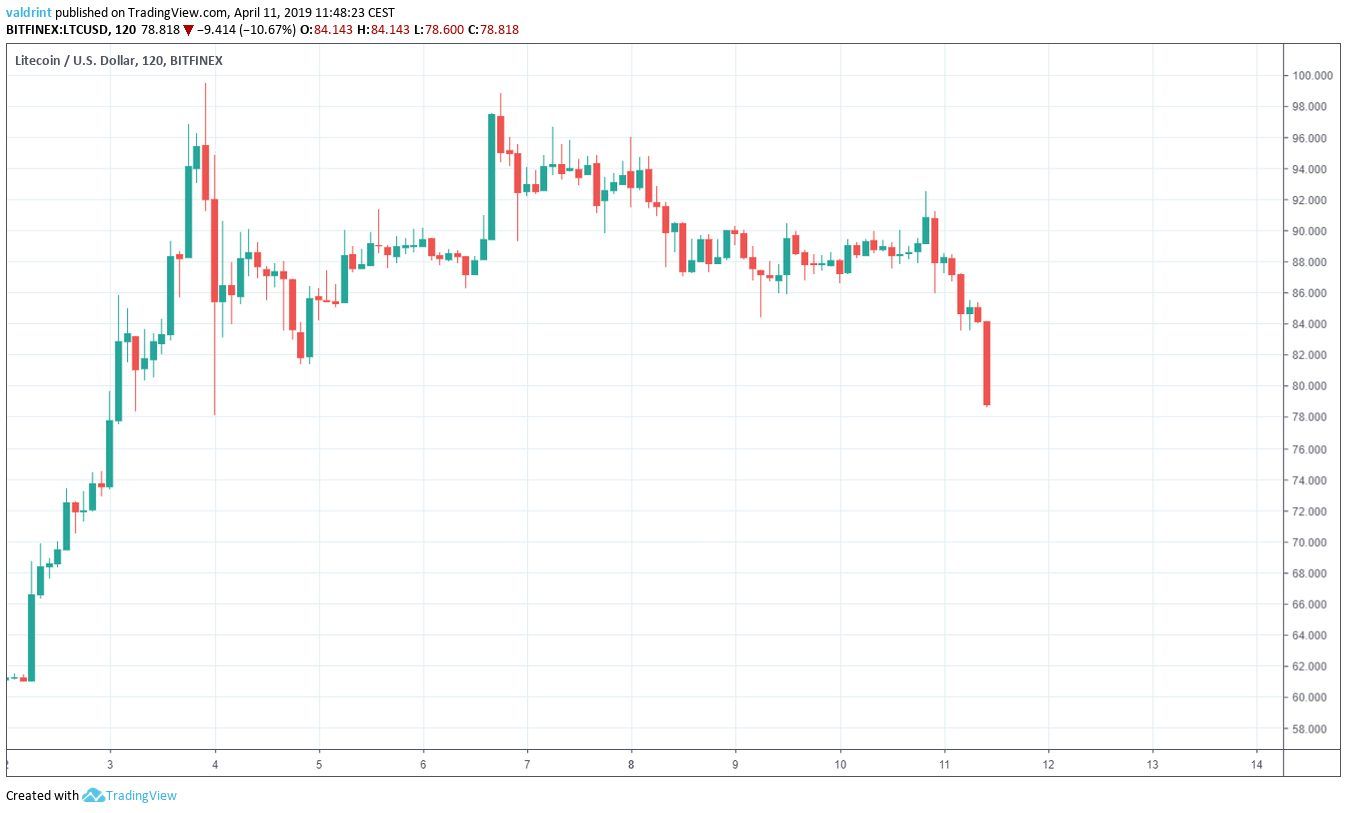
A gradual decrease followed. It intensified on Apr 11. At the time of writing, the price was trading slightly below $80.
Are the bullish gains of 2019 about to end or will Litecoin find the strength to reach $100?
Let’s find out:
Litecoin (LTC): Trends And Highlights For April 11, 2019
- The price of LTC/USD has been on a downtrend since Apr 6.
- Litecoin broke down from a support line on Apr 11.
- The breakdown was preceded by bearish divergence in the RSI.
- There is support near $78 and $72.
Tracing Support
On Apr 3, the price reached an hourly low of $78.3. Several market cycles have been completed and the price has made a higher low each time.
Tracing these lows gives us an ascending support line:
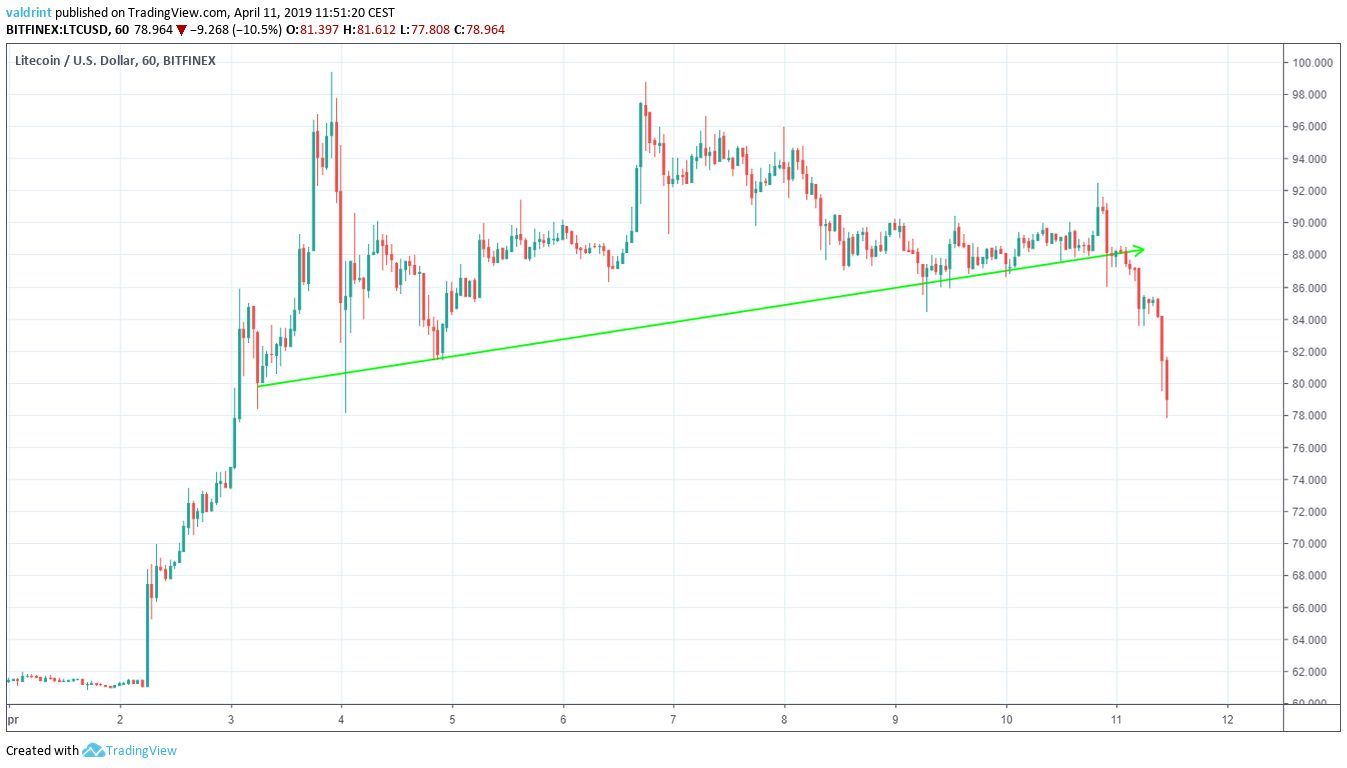
On Apr 11, the price began a rapid increase. It broke down from the support line and reached the lows of Apr 3.
When will the price find a bottom?
In order to answer that question, we need to take a look at technical indicators.
Bearish Divergence
The price of LTC/USD on Bitfinex is analyzed at six-hour intervals from Feb 10 to Apr 11 alongside the RSI in order to trace the previous movement.
The relative strength index (RSI) is an indicator which calculates the size of the changes in price in order to determine oversold or overbought conditions in the market.
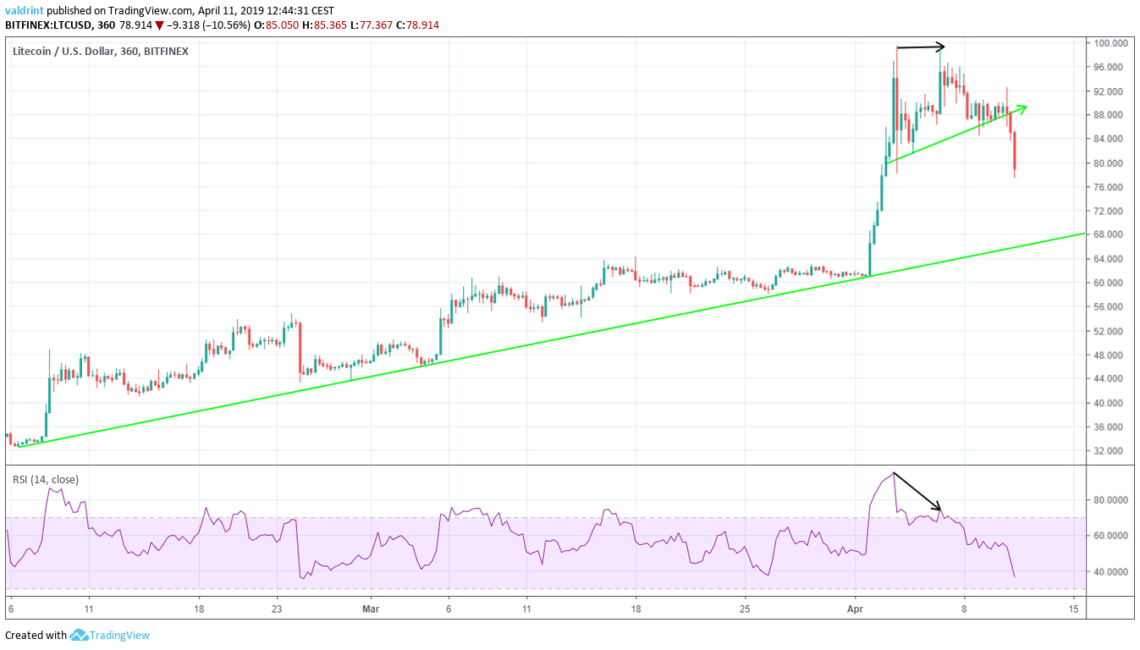
On Apr 3, the price reached a high of $99.40. It reached a similar level on Apr 6.
Similarly, the RSI made the first high on Apr 3. However, it has proceeded to generate lower values.
This is known as bearish divergence and often precedes price decreases. In the case of LTC, it preceded the breakdown from the support line.
We can also see that the price is following a longer term ascending support line.
Using these indicators, it is likely that the price heads towards the long term support line. This would mean much greater losses for Litecoin.
Future Movement
However, it is likely that at least a partial reversal will occur before the support line is reached. To determine the possibility of a reversal, we return to a shorter time frame and incorporate support areas into this portion of the analysis.
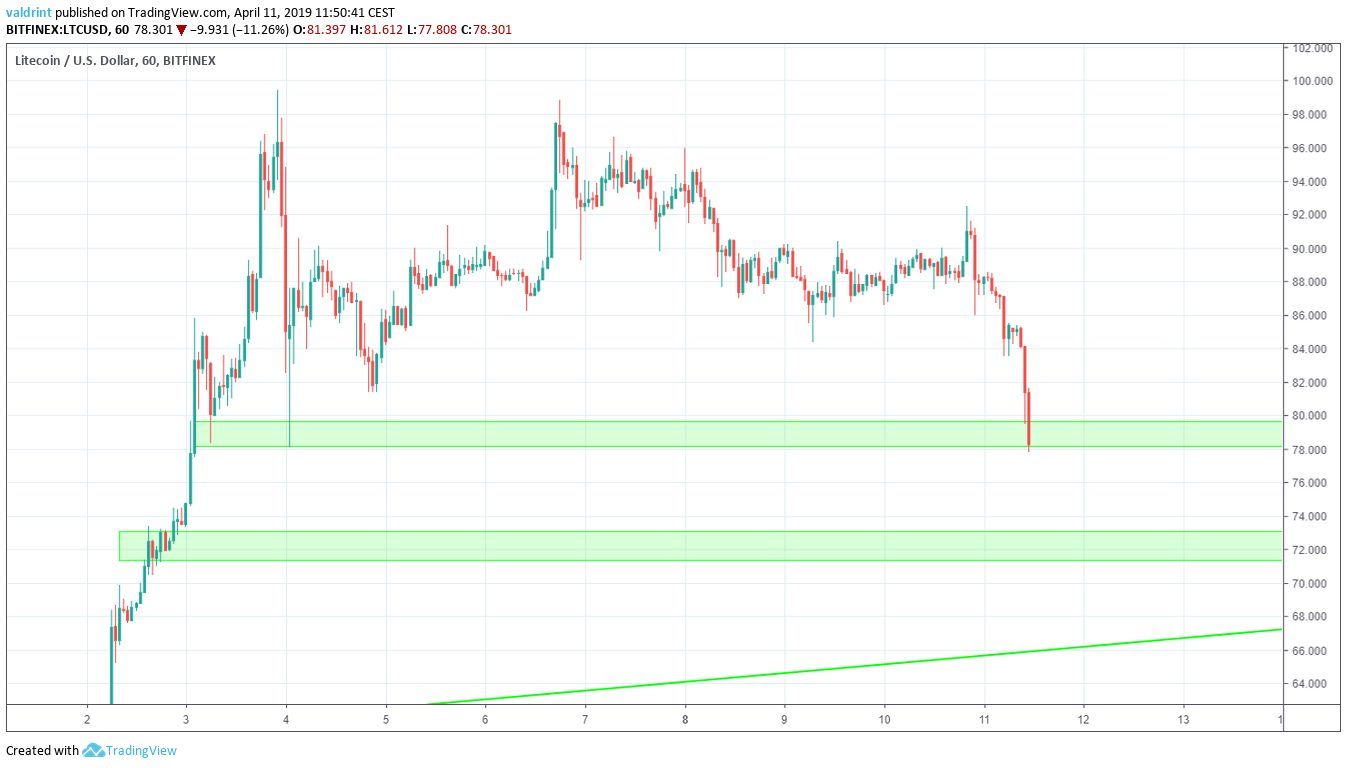
The closest support area is found near $78 where the price is currently trading. The next support area is found near $72. According to our analysis, it is likely that the price reaches the second area. However, short-term increases are possible before price drops to $72.
It is also possible that after reaching the second support area, Litecoin will increase to the first area before dropping to the support line.
The number of market cycles that may be completed along this downward trend will not yet be known until a bottom is reached.
Summary Of Analysis
Based on this analysis, it is likely that the price will keep decreasing and reach the second support area. However, it is possible that short-term increases occur before that. Volatility with several increases and decreases along a downward trend appears possible.
Where do you think the price of LTC will make a bottom? Let us know in the comments below.
Disclaimer: This article is not trading advice and should not be construed as such. Always consult a trained financial professional before investing in cryptocurrencies, as the market is particularly volatile.


