


On Apr 2, 2019, the price of Litecoin (LTC) began a rapid upward move. A high of nearly $100 was reached on Apr 3.
The price has been on a downtrend since.
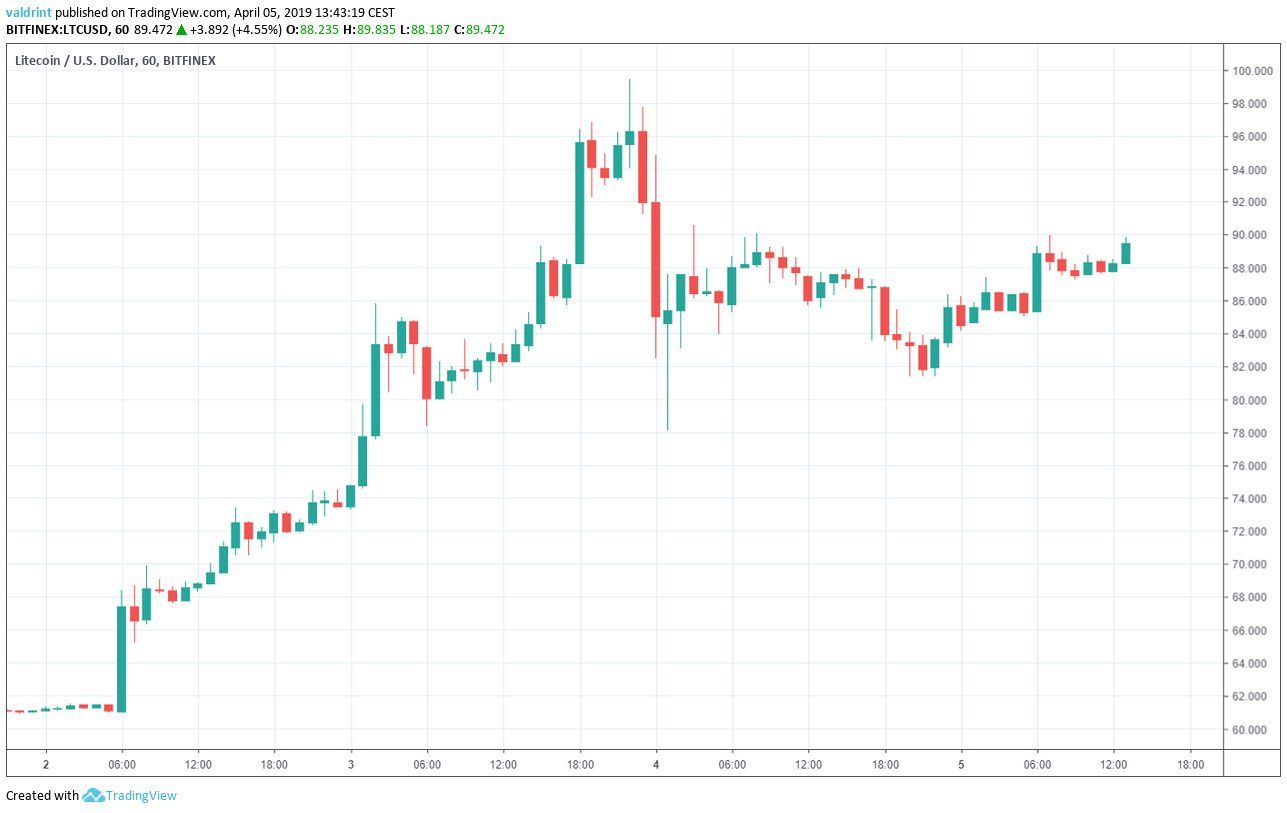
Will a reversal bring Litecoin past the $100 barrier?
Let’s find out.
Litecoin (LTC): Trends And Highlights For April 5, 2019
- The price of LTC/USD has been on an upward trend since Apr 2.
- Litecoin is trading inside a horizontal channel.
- The SMAs have made a bullish cross.
- There is resistance near $96 and support near $66
Tracing Resistance
The price of LTC on Bitfinex was analyzed at one-hour intervals from Mar 17 to Mar 25.
On Apr 3, the price reached an hourly low of $78.3. A rapid upward move was followed by a rapid decrease.
The price reached the same level once more.
Tracing these lows gives us a horizontal support line. 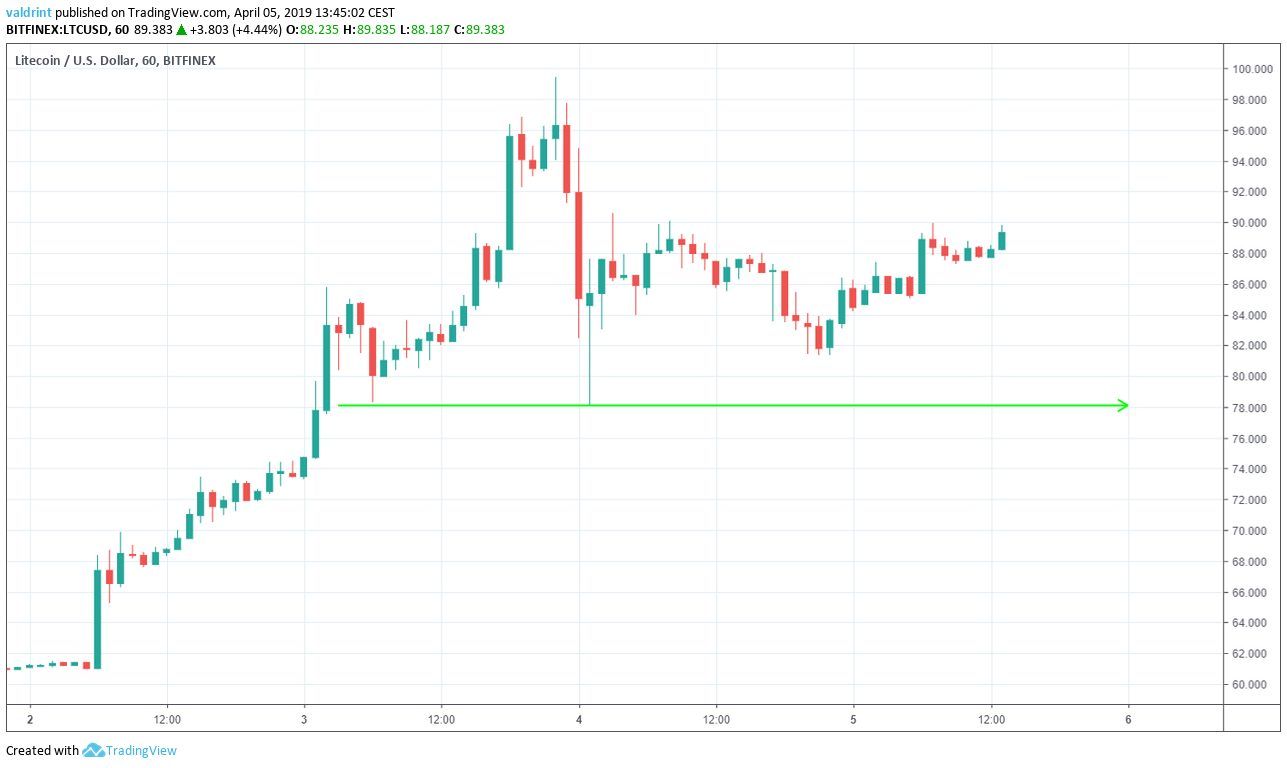
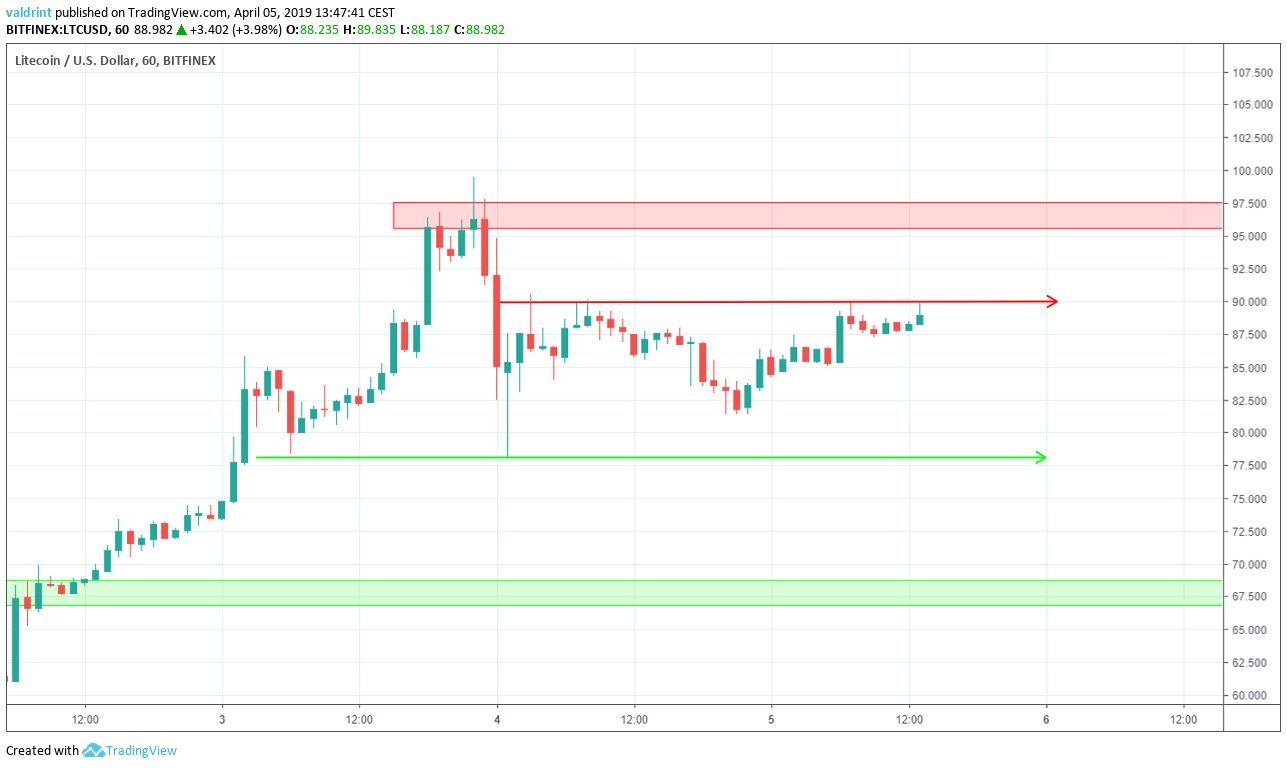
On Apr 4, the price reached an hourly high of $90.50. Furthermore, a long lower wick near $80 on the same indicates significant buying power.
Tracing the highs during this period gives us a horizontal resistance line.
The resistance and support lines combine to create a horizontal channel:
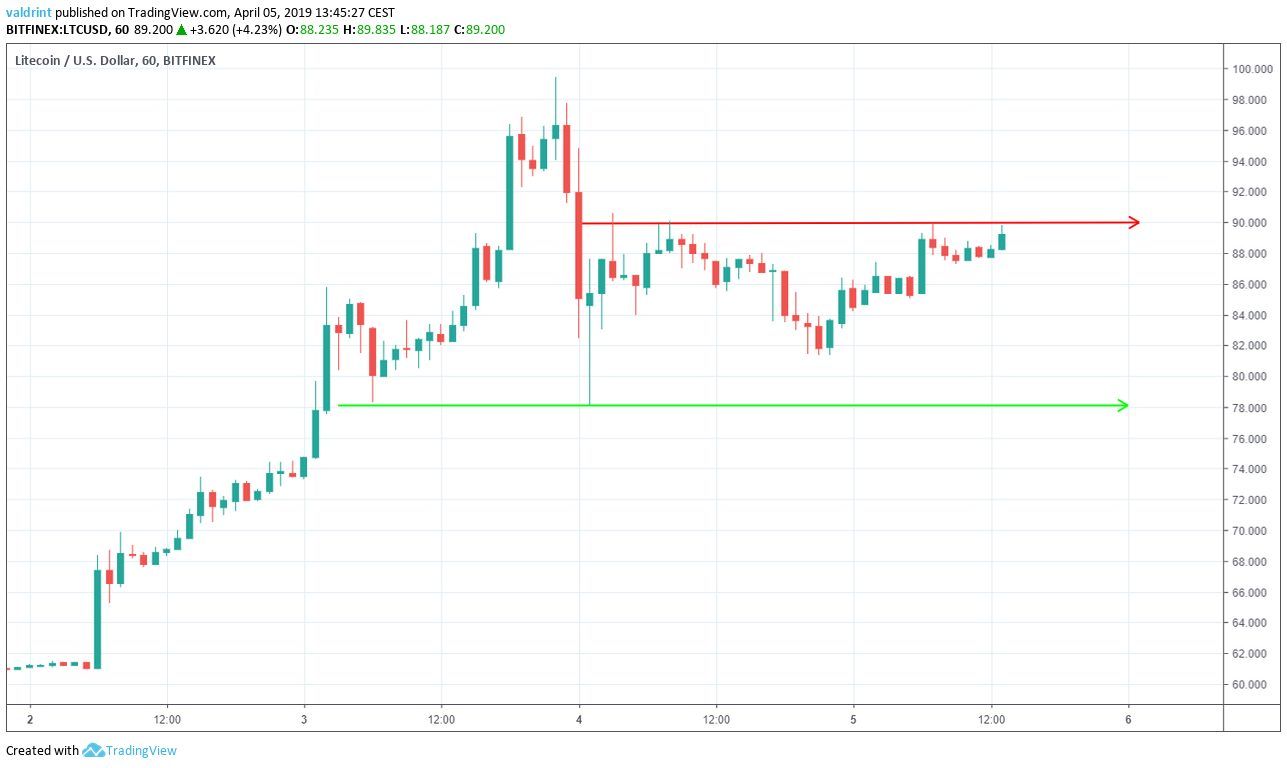
Movement inside this channel is likely until a decisive upward or downward move occurs.
What will be the direction of this move? In order to answer that question, we need to take a look at technical indicators.
Moving Averages
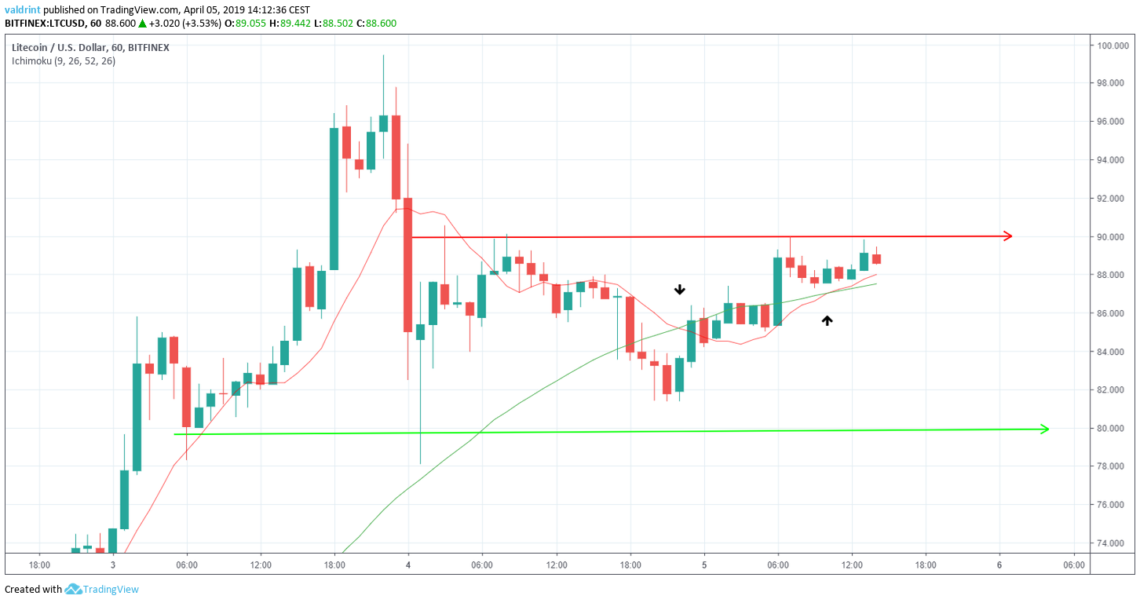
On Apr 4, the 21-period MA crossed below the 50-period MA. This is known as a bearish cross and indicates that the current trend may be over and a new downtrend may begin.
However, the price immediately rebounded and so did the moving averages.
The 21-period MA crossed above the 50-period MA on Apr 5. This invalidated the previous signal and indicates that a new uptrend may begin soon.
Using this indicator, it is likely that the price may increase slightly in the near future. It makes a breakdown from the channel unlikely.
Future Movement
The closest resistance area is found near $98 if the price breaks out of the channel, it is likely to provide a reversal area.
The closest support area is found near $66. If the price were to break down from the channel, it would provide a likely reversal area. Based on the rapid price increases during April and the visible buying power evidenced by the long lower wicks, we believe this to be unlikely.
Summary Of Analysis
Based on this analysis, it is likely that the price keeps trading inside the horizontal channel. A breakout is also possible. We believe a breakdown from the channel to be unlikely.
Do you think the price of LTC will keep increasing? Let us know in the comments below.
Disclaimer: This article is not trading advice and should not be construed as such. Always consult a trained financial professional before investing in cryptocurrencies, as the market is particularly volatile.


