


The Bitcoin price often repeats movements from previously completed patterns. More specifically, the upward move beginning in January 2015 and the current one from December 2018 share several similarities — and suggest the price has already reached a bottom.
This bearish sentiment started to fade after the rally that began on November 25. Furthermore, the buy positions on the Bitfinex exchange have spiked to their highest levels since February, while the sell positions are at an all-time low. This suggests that bullish momentum is still building — with sell orders plummeting on the exchange.
Cryptocurrency charter and investor @davthewave stated that upward move beginning in August 2016 and the following correction has numerous similarities with the current Bitcoin price movements since December 2018.
Another argument for the log fib… pic.twitter.com/XJS4VoPHa8
— dave the wave🌊🌓 (@davthewave) November 27, 2019
Similarities
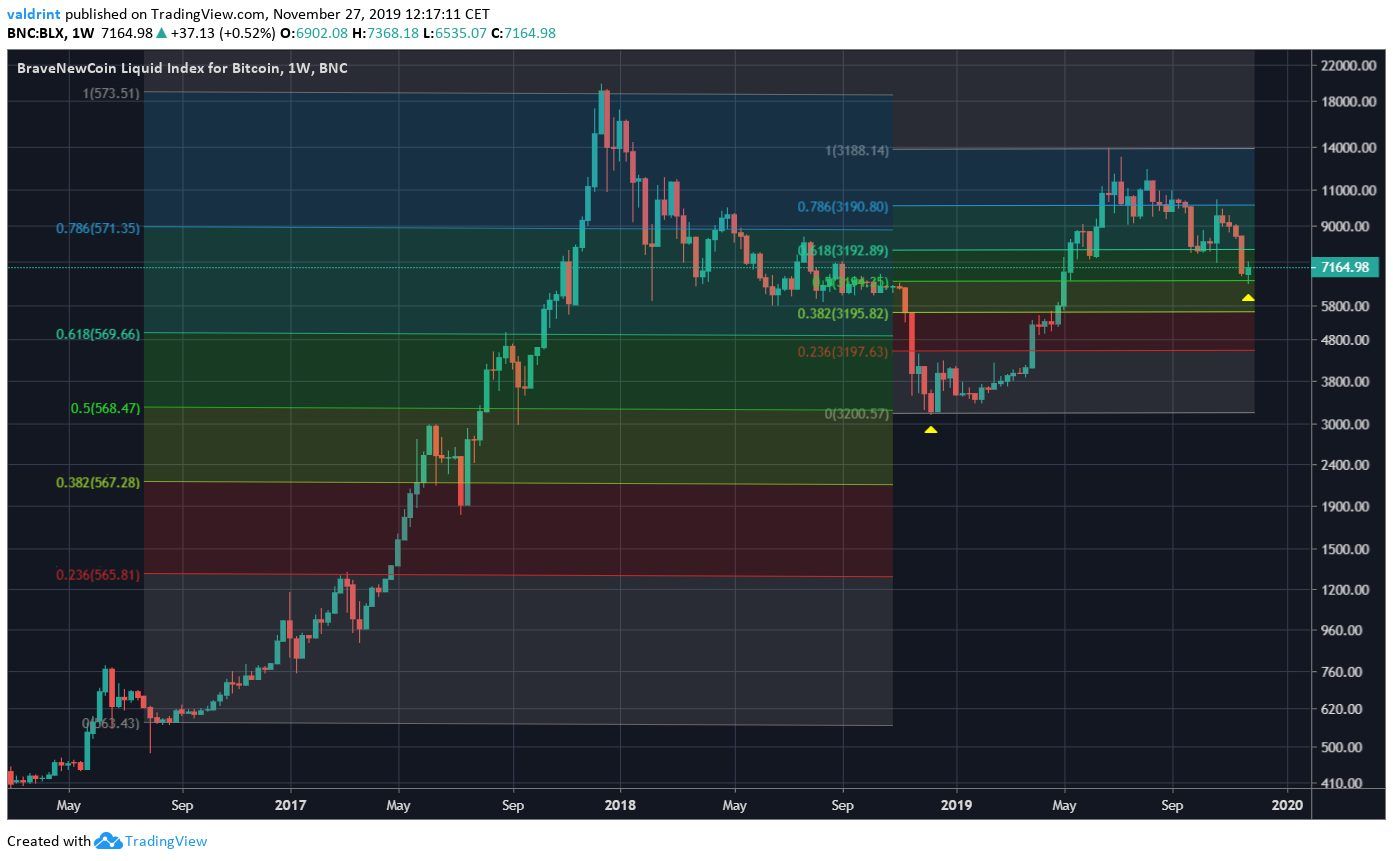
The similar Fib levels are visible when measuring the first movement from September 2016 to December 2017. Afterward, the Bitcoin price retraced to the 0.5 fib level before beginning the current upward movement.
Furthermore, after reaching a high of $13,764 on June 24, 2019, the bitcoin price has retraced to the 0.5 fib level, thus giving credence to the idea that the corrections are similar and the price has reached a bottom.
However, since the upward movement began earlier than September 2016, the low looks somewhat handpicked to fit the analysis.
Different Measurement
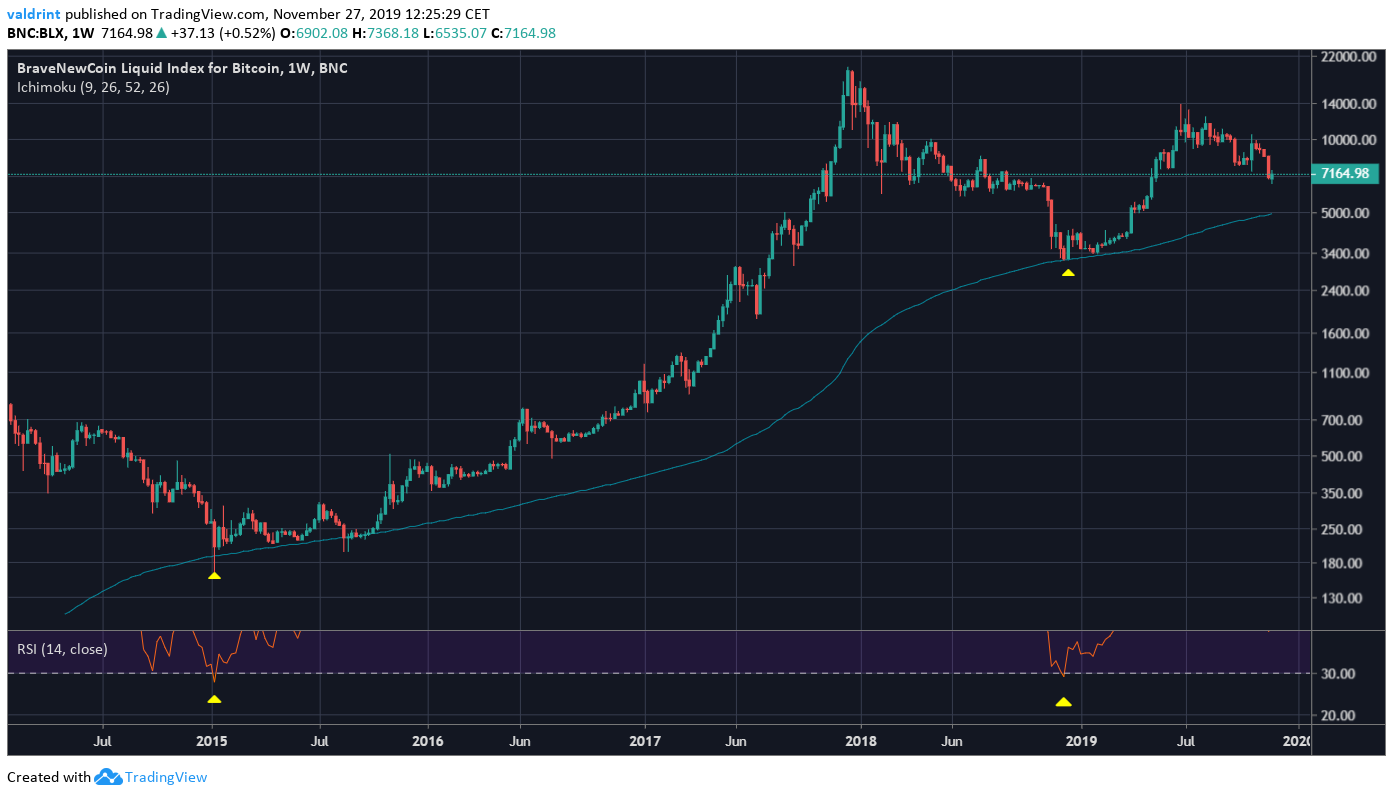
Looking at the Bitcoin price movement alongside technical indicators, there are two dates that stand out:
- January 2015
- December 2018
Both these lows were combined with oversold values in the weekly RSI (only ones recorded) and a touch of the 200-week Moving average (MA). Therefore, it makes more sense to begin measuring the Fib levels from here.
This also falls in line with the idea posted earlier, in which the 2013 correction outlined on top of the current one creates a fractal that has been followed until now.
Do you really want to argue with the log fib [this cycle has corrected further]? Also, the same real decline from the peak…. pic.twitter.com/YabSAgB6Fr
— dave the wave🌊🌓 (@davthewave) November 27, 2019
The dates used in our log prediction (Jan 2015; Dec 2018) converge with each other in the fractal. Therefore, these could definitely represent similar points in the market cycle.
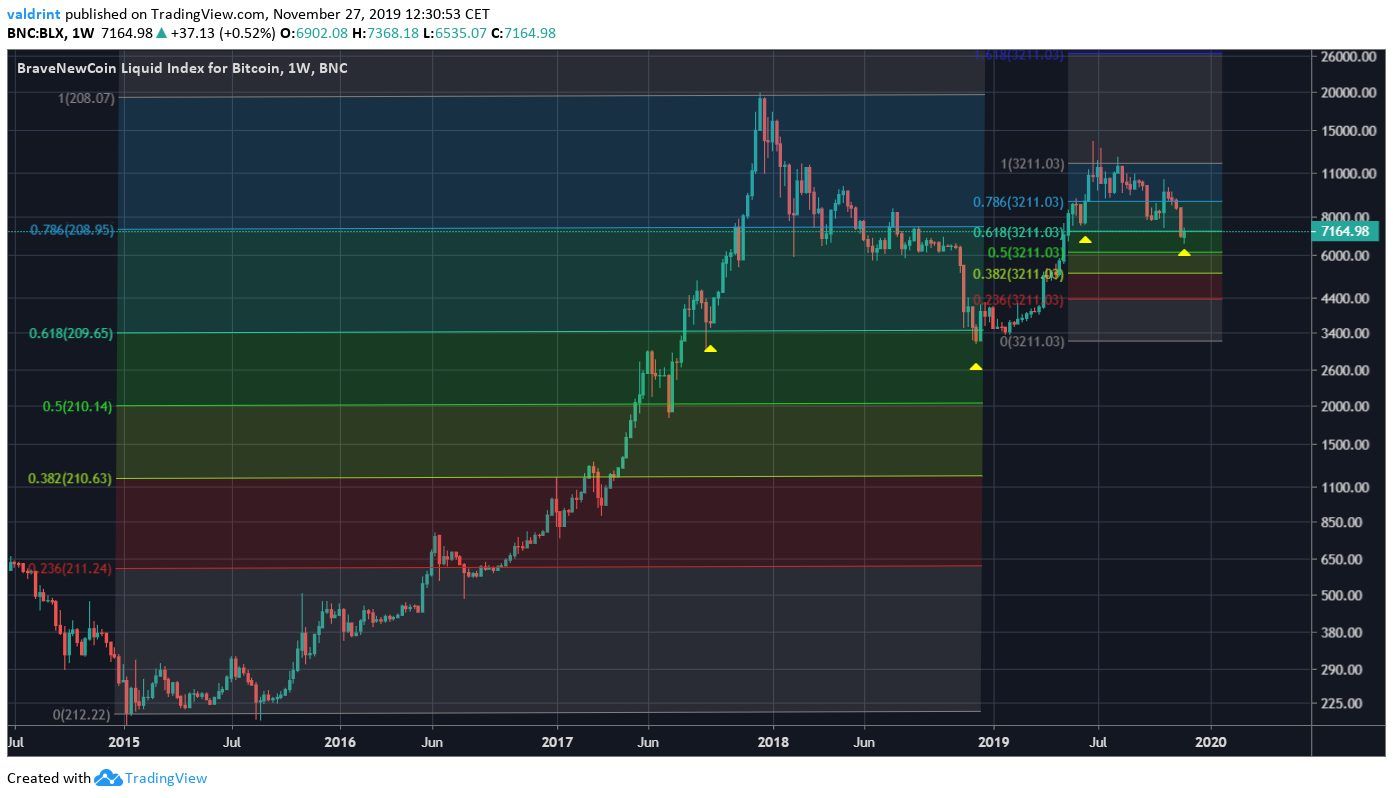
Fib Channel
Using Fib levels from these dates reveals an interesting occurrence. The Bitcoin price bounced on the 0.618 fib level on the way up, and the bottom was reached only slightly below this level during the first upward move.
During the second move, we will use the Bitcoin price closes instead of wicks for the highs — which is often done in the case of long wicks.
In doing so, we find an identical movement. On the way up, the Bitcoin price bounced on the 0.618 Fib level and is currently only slightly below it.
To conclude, the correction beginning in 2013 and the ensuing market cycle have similarities with the upward move beginning in December 2018. The bottoms in Jan 2015 and Dec 2018 could represent similar points in the market cycle.
Therefore, we have either already reached a bottom or are very close to doing so — and an upward move signaling the beginning of a new market cycle will soon follow.
Disclaimer: This article is not trading advice and should not be construed as such. Always consult a trained financial professional before investing in cryptocurrencies, as the market is particularly volatile.
Did you know you can trade sign-up to trade Bitcoin and many leading altcoins with a multiplier of up to 100x on a safe and secure exchange with the lowest fees — with only an email address? Well, now you do! Click here to get started on StormGain!


