


Litentry (LIT) has been increasing over the past three weeks and is in the process of breaking out and confirming that its correction is complete.
While the LIT/USD chart provides a bullish outlook, the LIT/BTC chart is bearish and could soon fall to new all-time lows.
Potential breakout
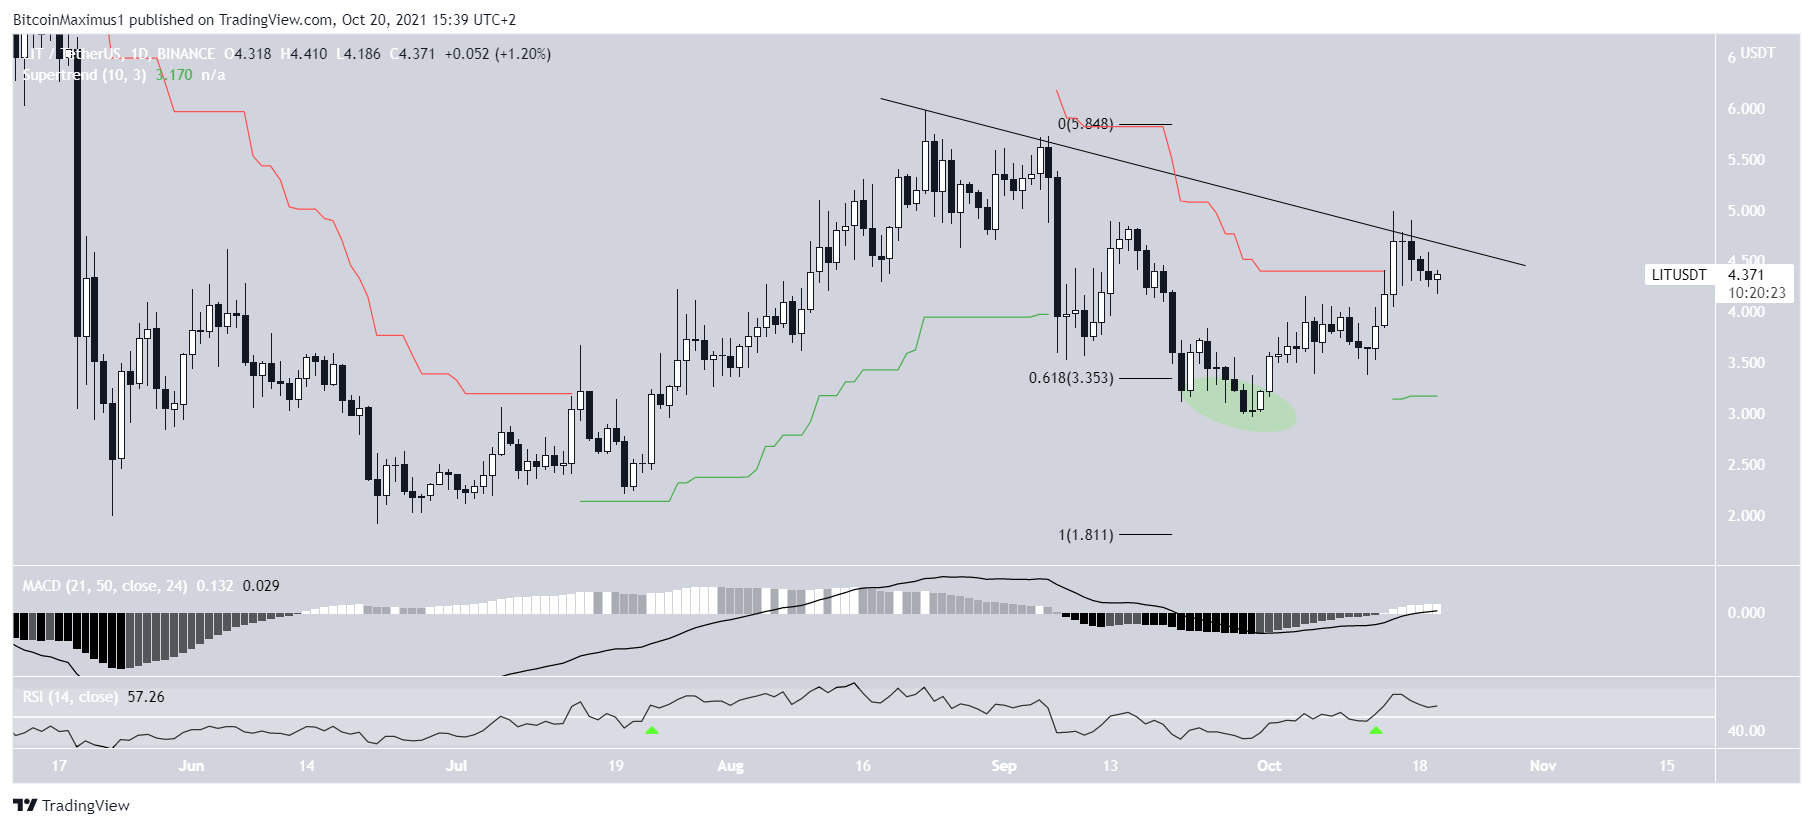
The daily chart shows that LIT has been moving upwards since Sept 29. This led to a high of $5 on Oct 15. However, the token was rejected by a descending resistance line and has been decreasing since. The breakout from this line is required in order for the trend to be considered bullish.
The Sept 29 reversal was important since it transpired after the token deviated (green circle) below the 0.618 Fib retracement level. This is a crucial level, that often initiated bounces after corrections are complete. The deviation and subsequent reclamation support the possibility that the low was reached.
Technical indicators for LIT are also bullish.
The MACD, which is created by a short- and long-term moving average (MA) is positive and moving upwards. This means that the short-term trend is moving at a faster rate than the long-term one.
Furthermore, the RSI has moved above 50 (green icon). The RSI is a momentum indicator, and the increase above 50 suggests that the trend is bullish. The previous time this transpired was on July 21 and preceded the entire upward movement.
Therefore, while the bullish trend is not confirmed until LIT breaks out from the resistance line, all signs are pointing towards a successful breakout.
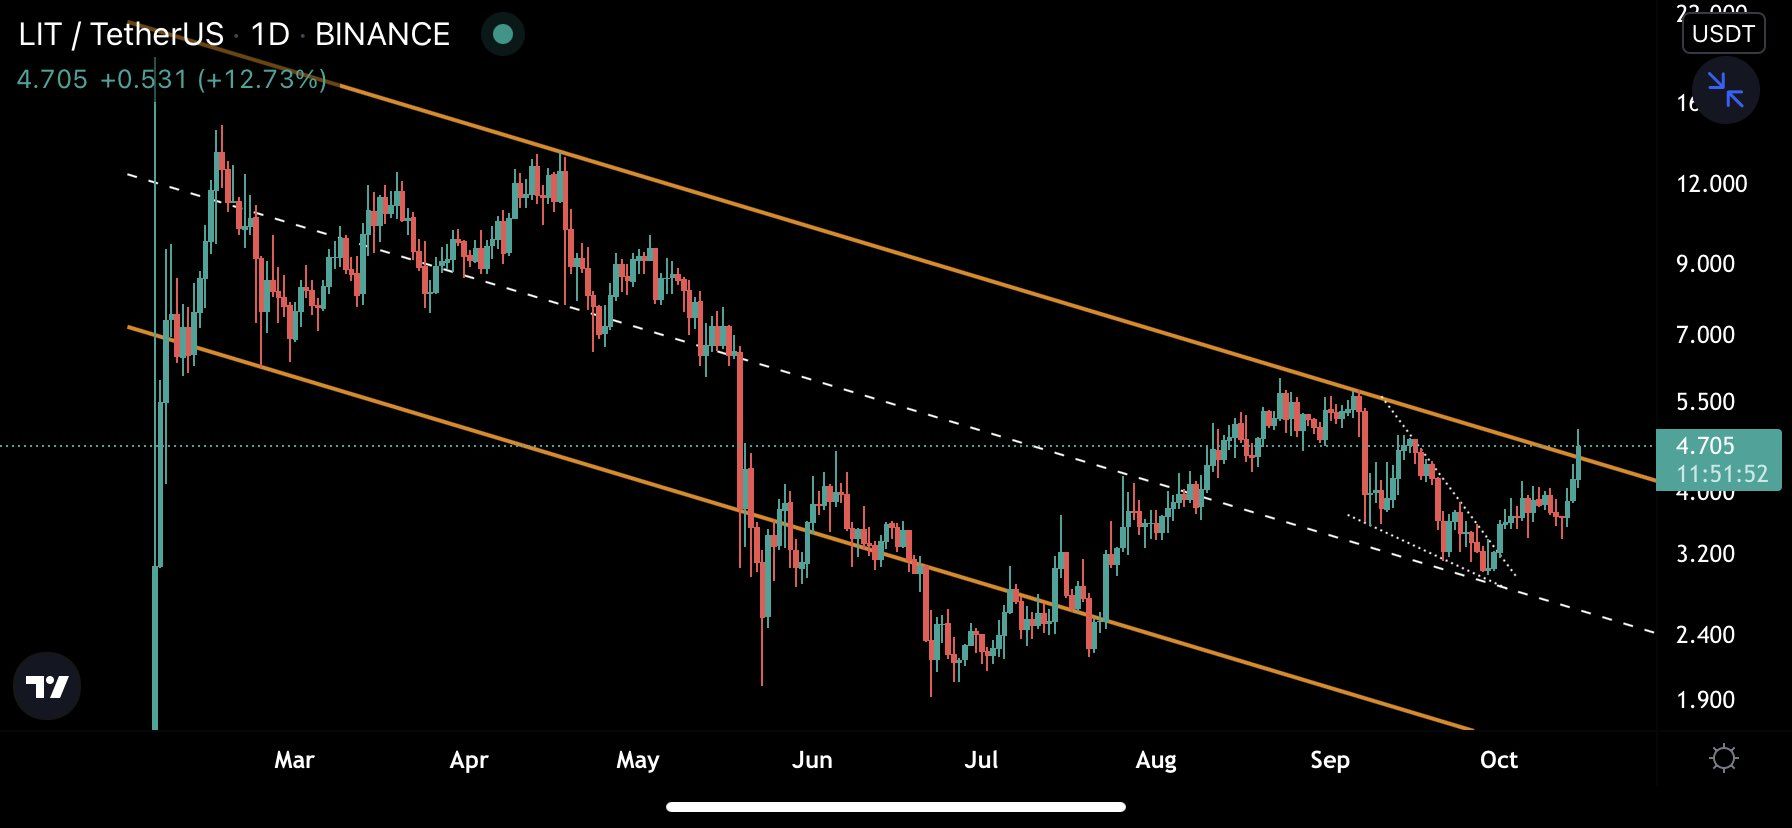
Cryptocurrency trader @Mesawine1 outlined a LIT chart, stating that the token is very close to breaking out from a parallel descending channel. This long-term channel coincides with the descending resistance line outlined in the image above.
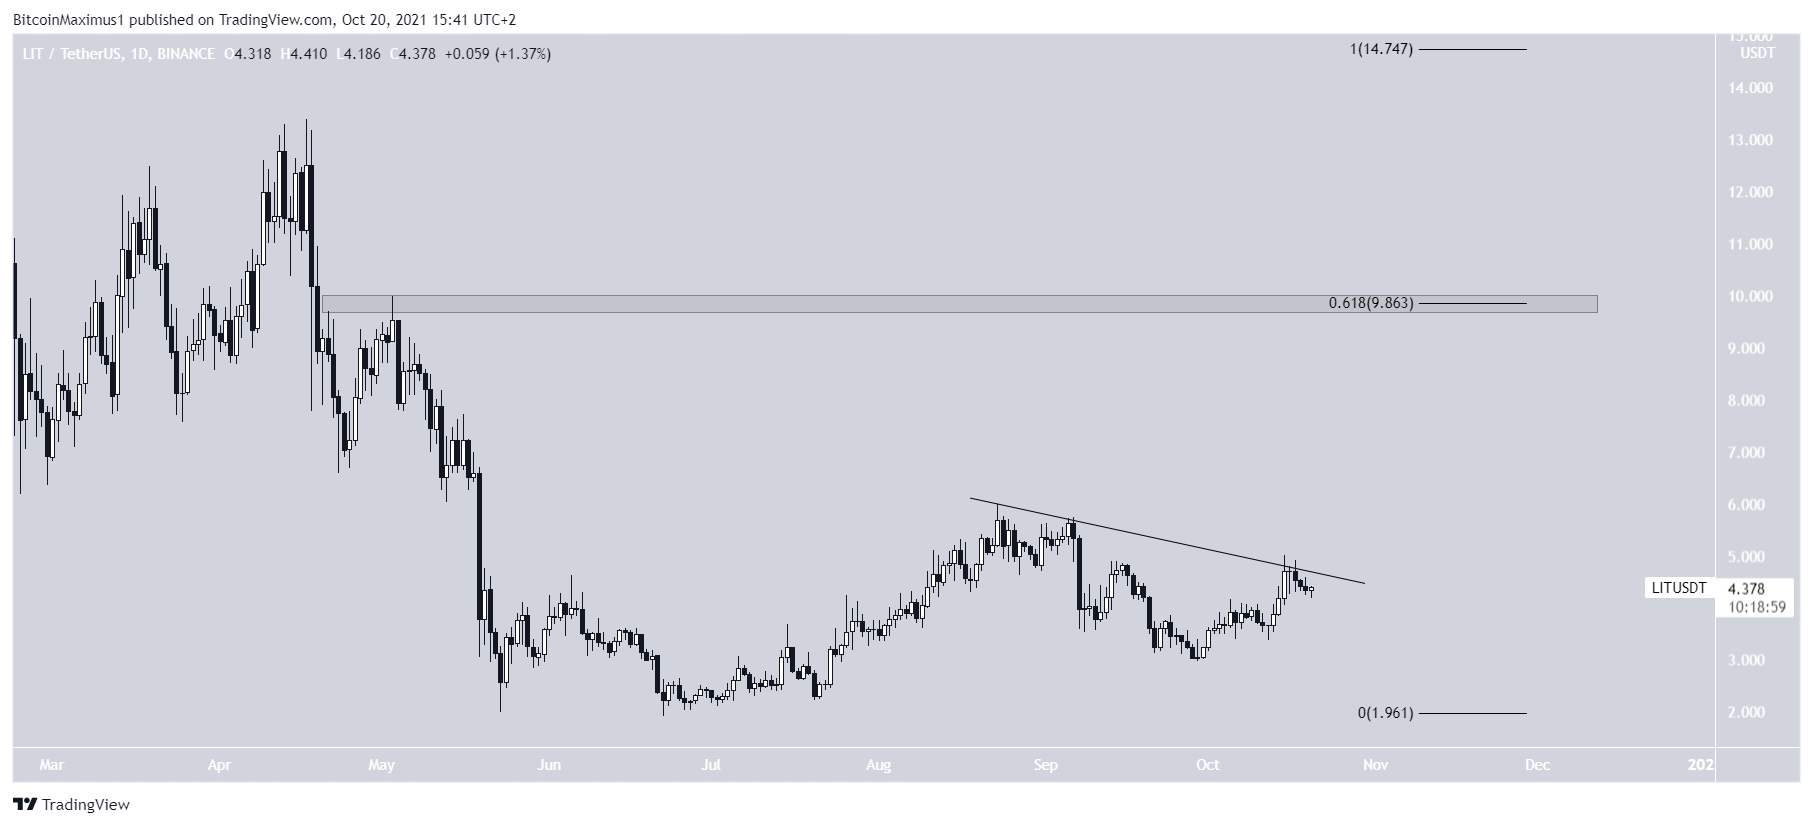
If one occurs, the next closest resistance area would be all the way at $9.86. This is the 0.618 Fib retracement level when measuring the entire previous downward movement.
Similar to how the 0.618 Fib retracement level acted as support on the way down, it is expected to act as resistance on the way up.
LIT/BTC
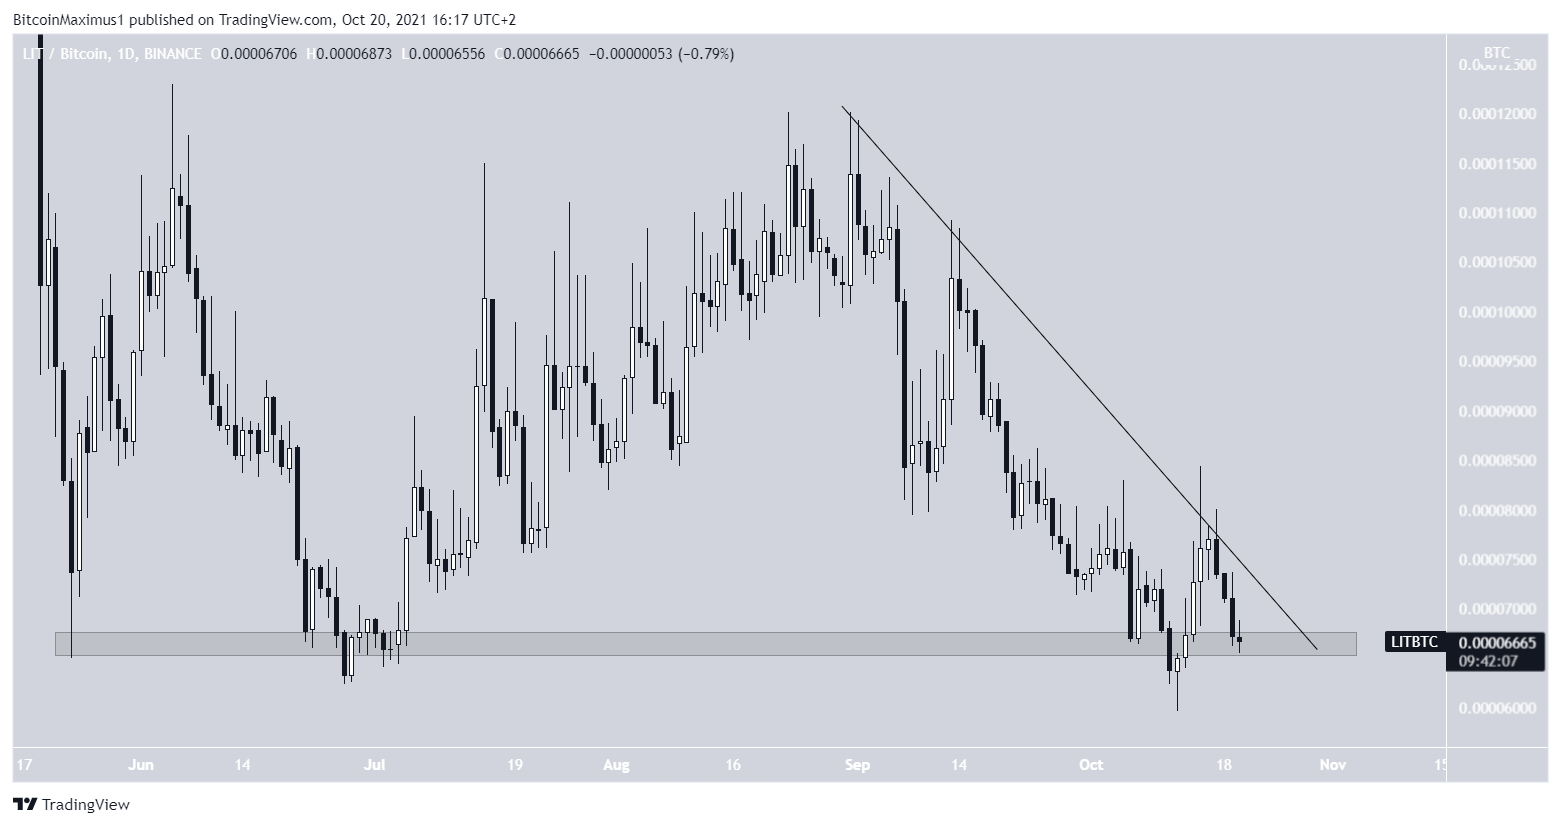
However, the LIT/BTC chart is not as bullish as its USD counterpart. It is barely holding above the 6650 satoshi support area.
Since the support gets weaker each time it is touched, a breakdown from this area would be expected. Furthermore, LIT is following a descending resistance line, which confirms that the trend is bearish.
If a breakdown occurs, LIT would fall to a new all-time low.
For BeInCrypto’s latest Bitcoin (BTC) analysis, click here.
What do you think about this subject? Write to us and tell us
