


Litentry (LIT) has been increasing since Feb 24. It would confirm that the correction is complete with a breakout from a long-term descending resistance line.
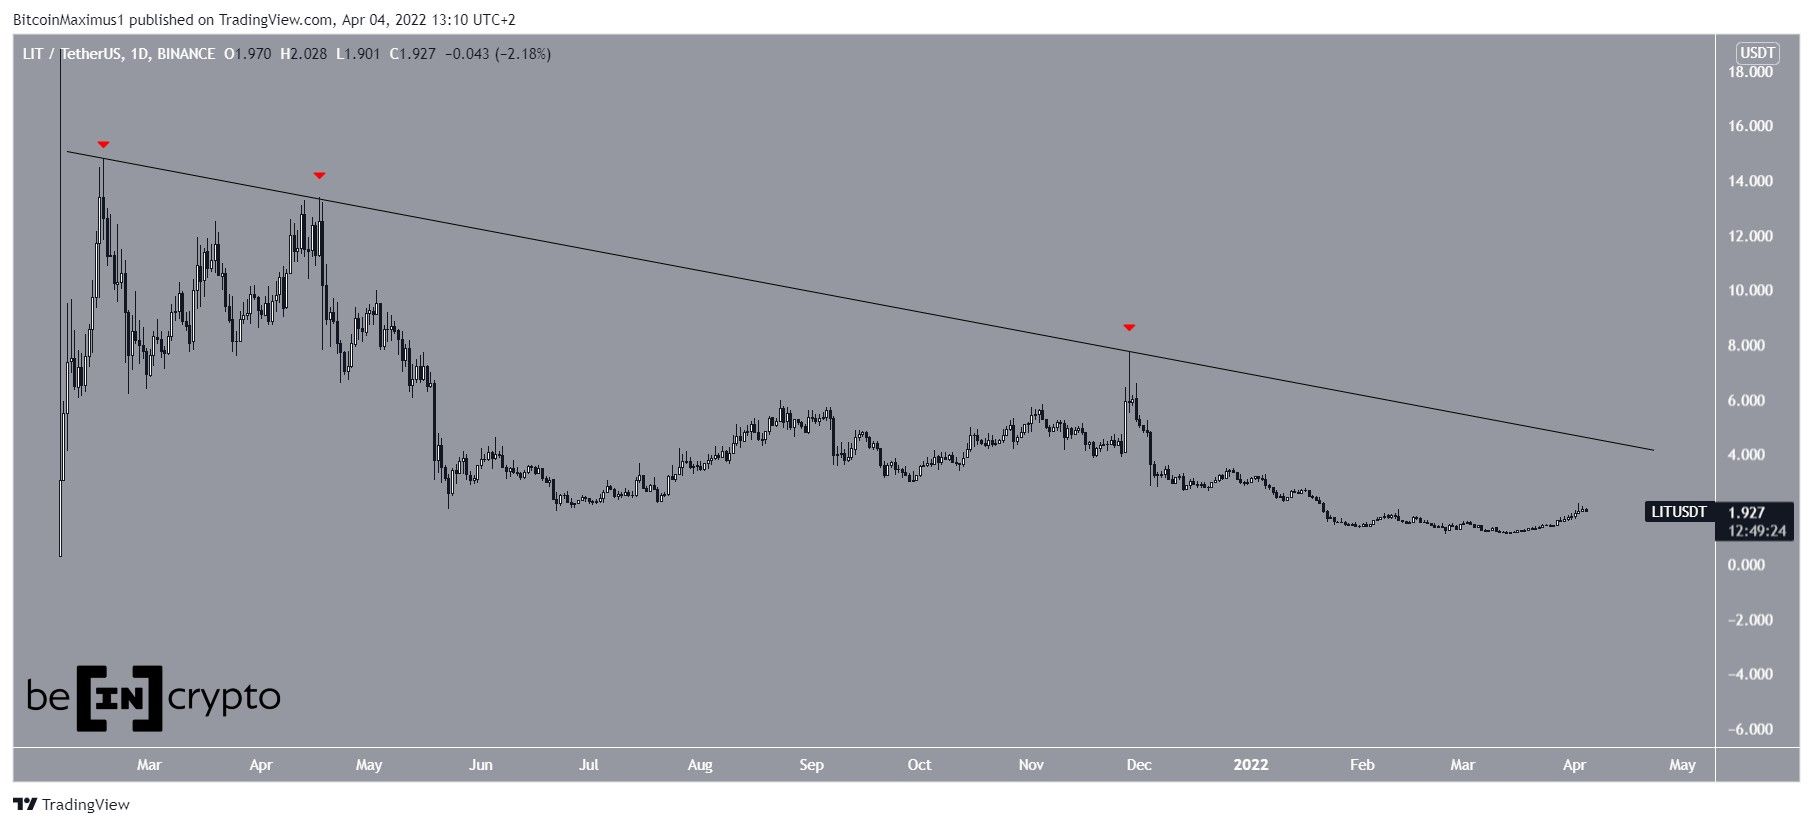
LIT has been falling underneath a descending resistance line since reaching an all-time high price of $18.82 on Feb 4.
The line has been validated four times, most recently on Nov 28 (red icon). The final rejection caused an acceleration of the downward movement and led to a low of $1.073 on Feb 24 (green icon). The price has been moving upwards since.
If the upward movement continues, the aforementioned resistance line would be at $4.
Future LIT movement
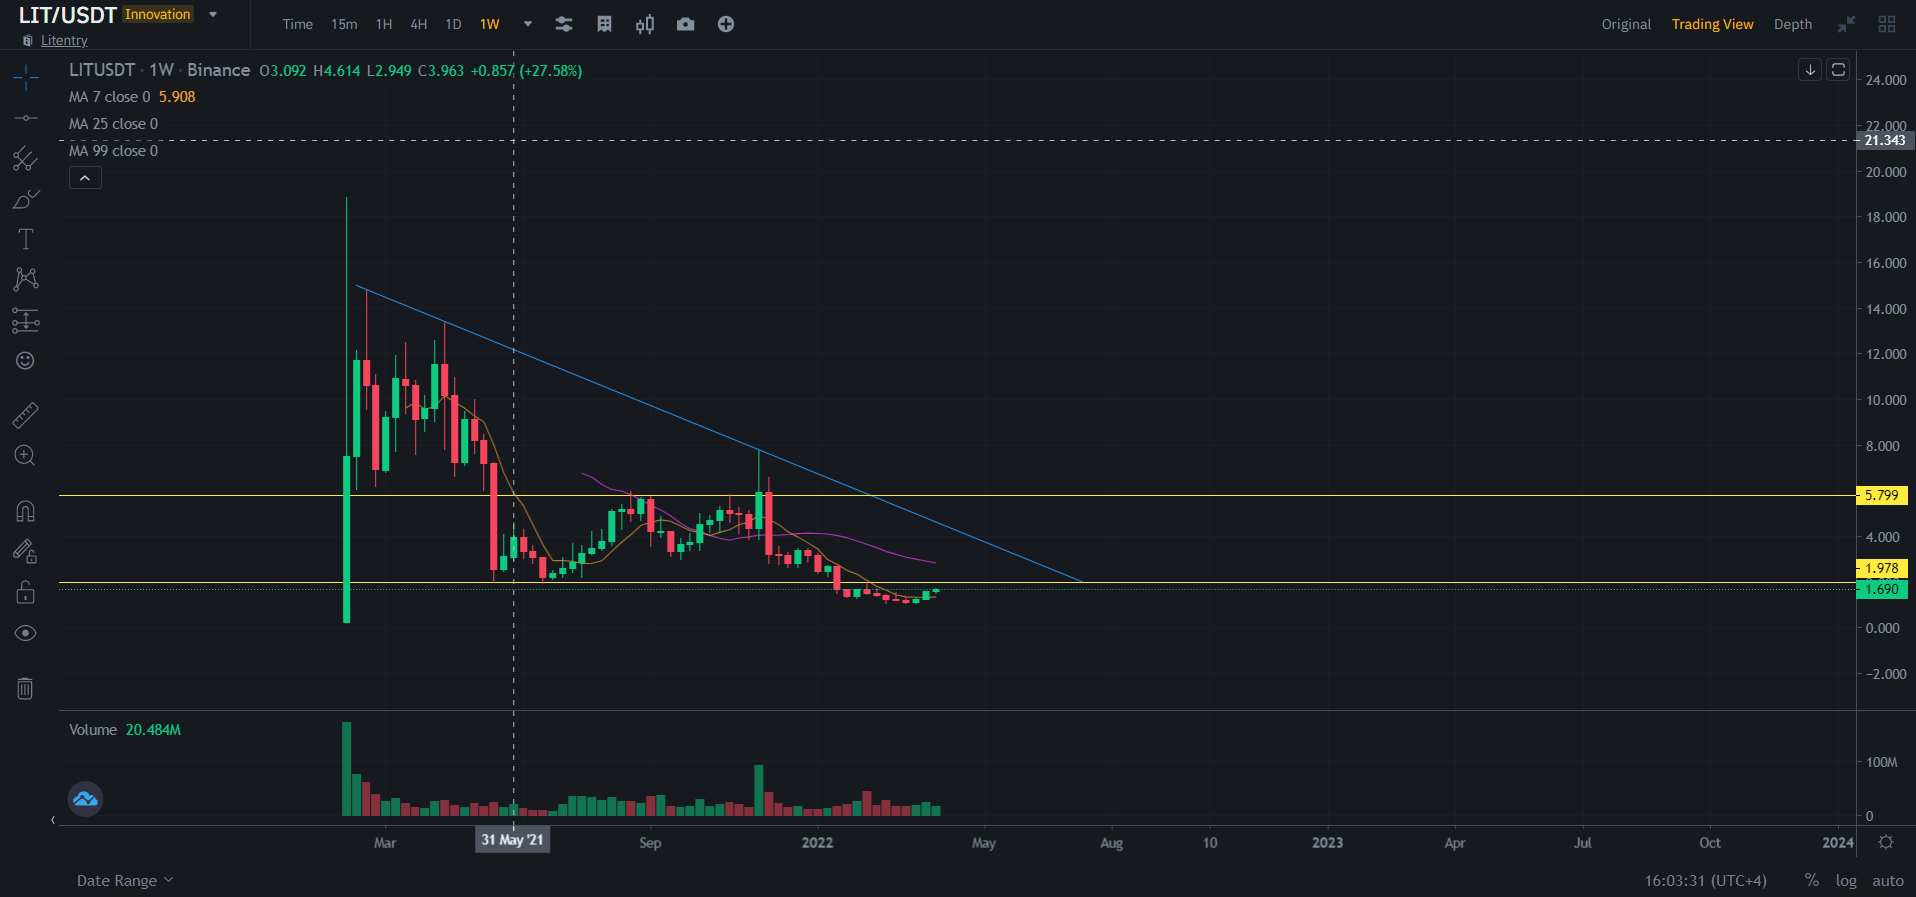
Cryptocurrency trader @S_SMI_ tweeted a chart of LIT, stating that the coin could soon begin to move upwards.
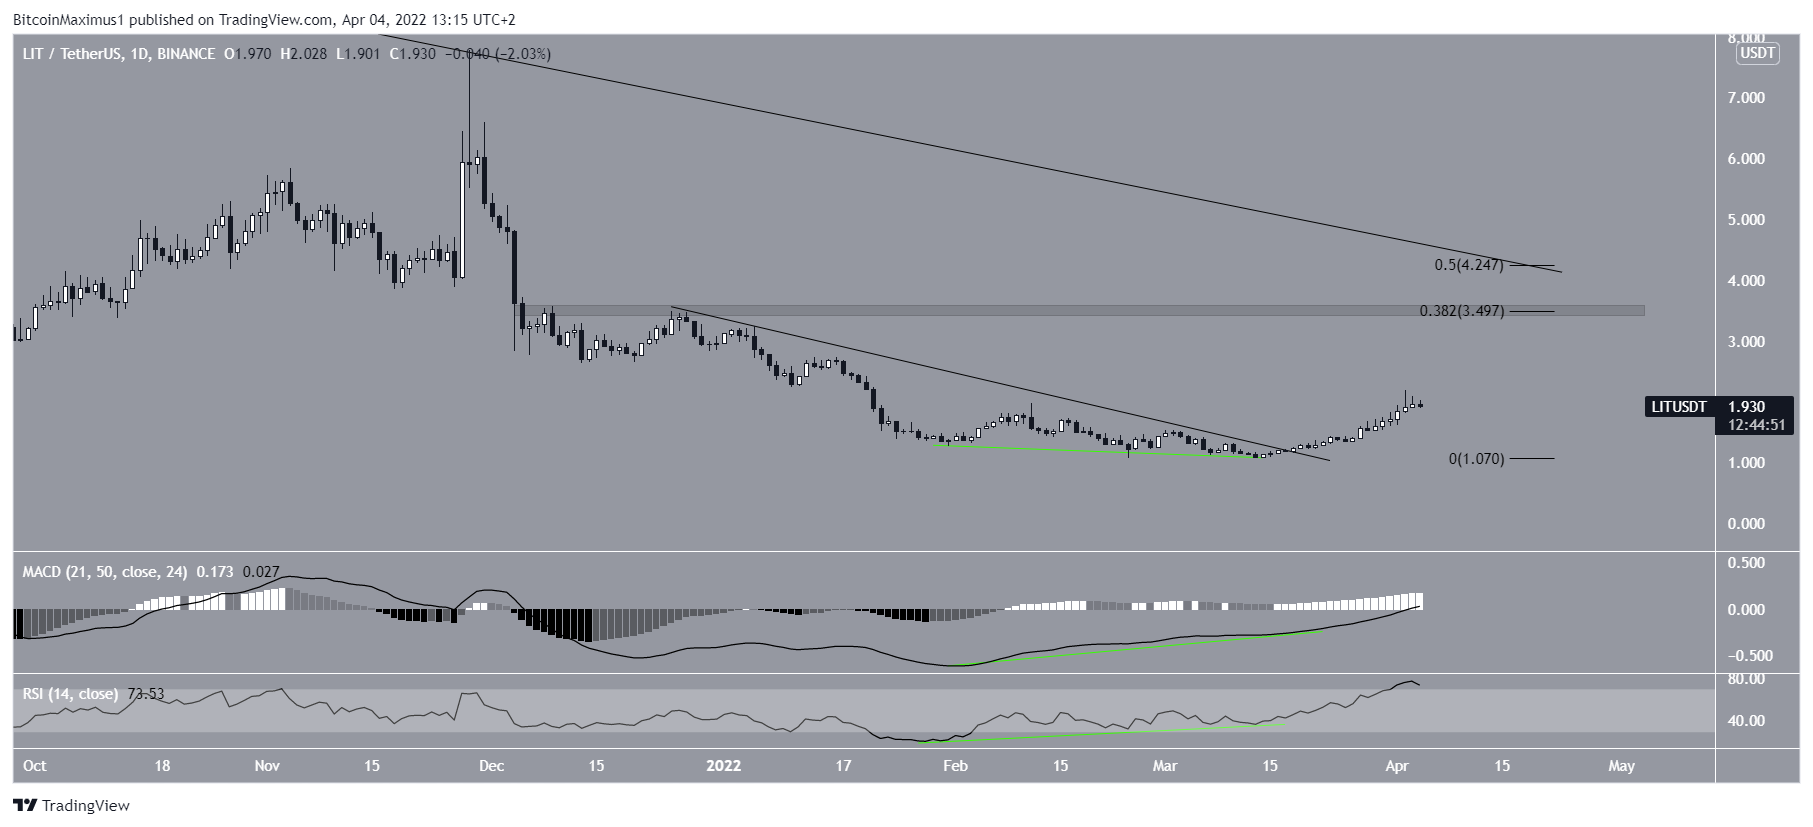
A closer look at the daily time-frame movement and indicators supports the continuation of the upward movement.
Firstly, the price has broken out from a shorter-term descending resistance line, which had been in place since Dec 25.
Secondly, the breakout was preceded by a significant bullish divergence in both the RSI and MACD (green lines). Such divergences usually precede significant bullish trend reversals.
The closest resistance area for LIT is at $3.50. This is the 0.382 Fib retracement resistance level. Additionally, it is a horizontal resistance area.
The second resistance is at $4.25. This is the 0.5 Fib retracement resistance level. Furthermore, it coincides with the aforementioned long-term descending resistance line.
Wave count analysis
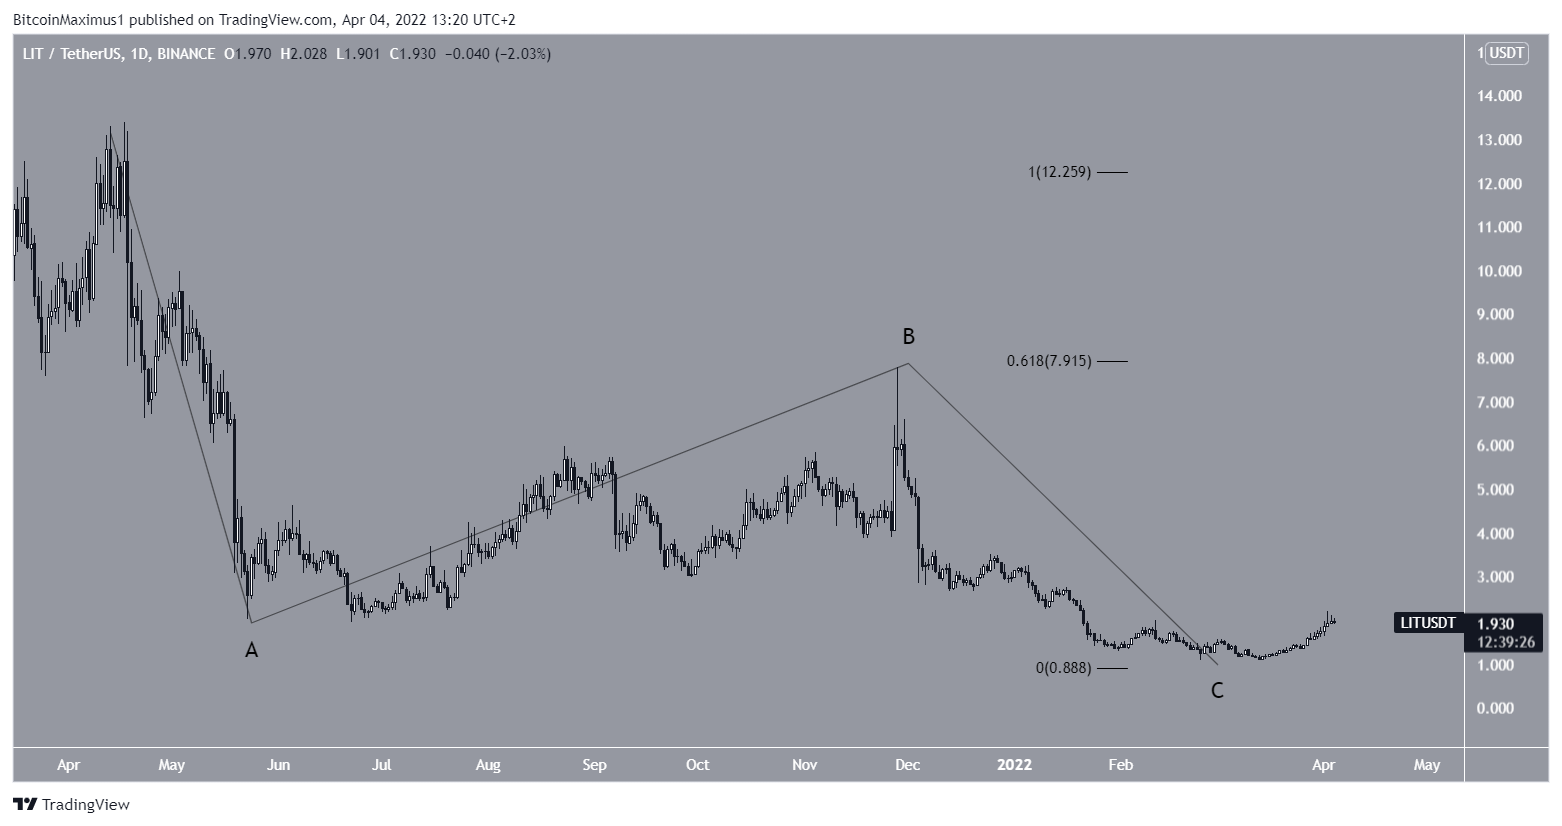
The wave count suggests that LIT has completed an A-B-C corrective structure (black). In it, waves A:C had a 1:0.618 ratio, which is common in such structures.
As a result of these readings, a breakout from the long-term descending resistance line would confirm that the low is in.
For Be[in]Crypto’s latest Bitcoin (BTC) analysis, click here



