

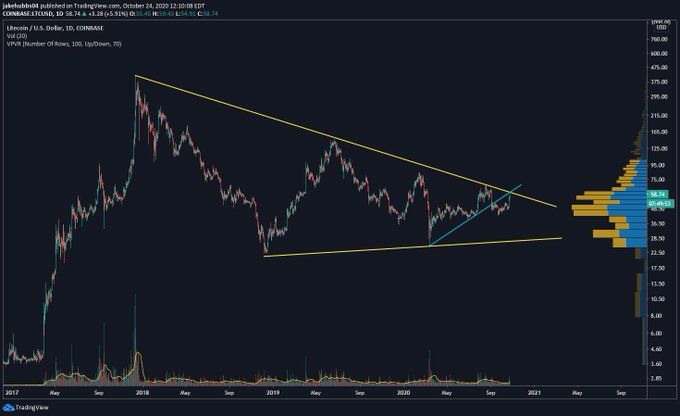
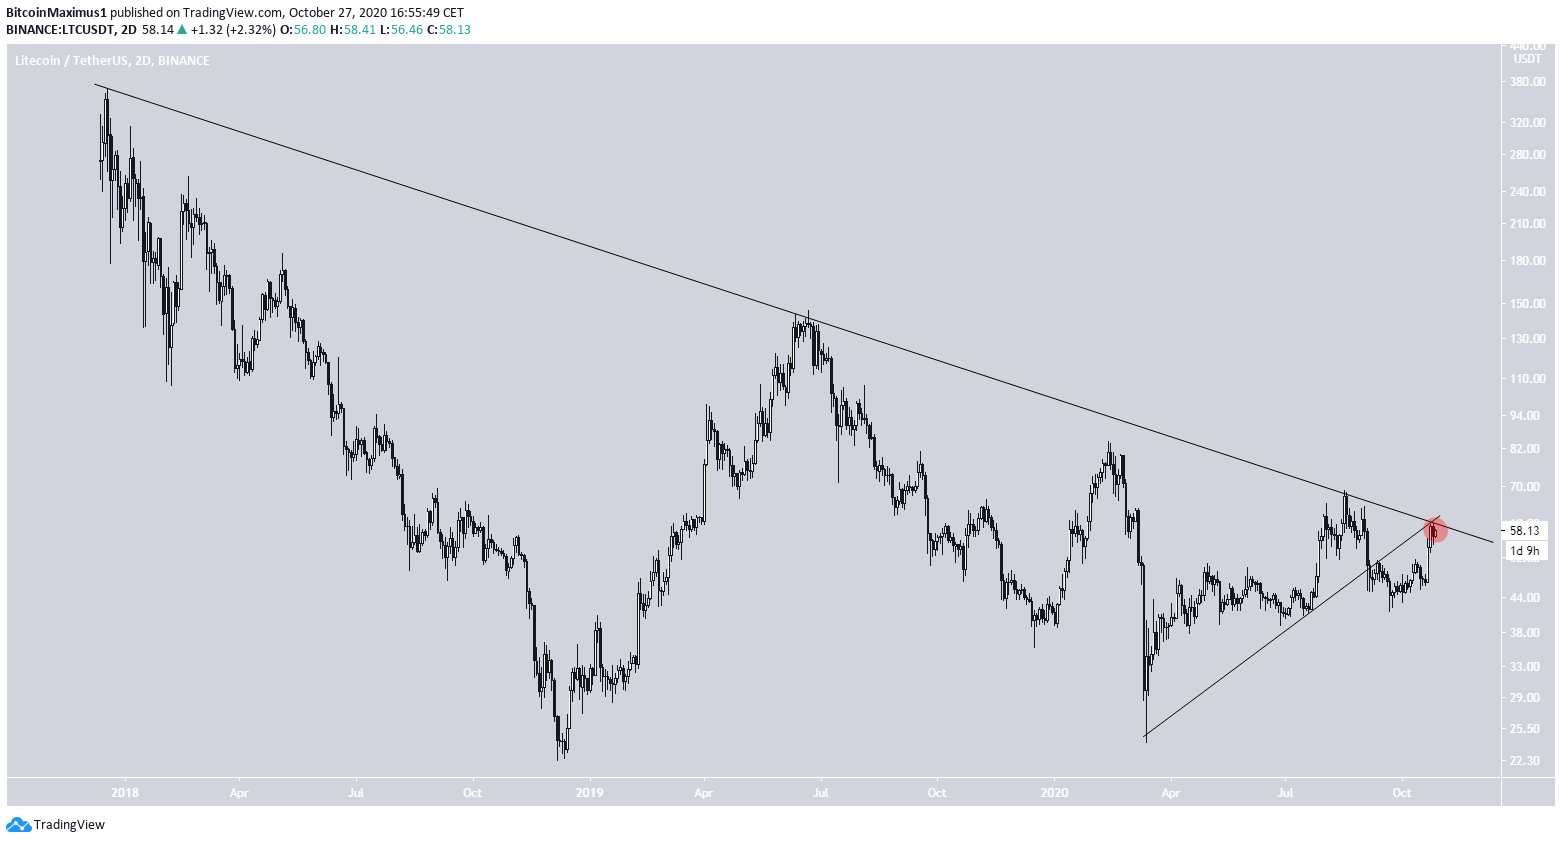
Litecoin (LTC) is approaching a crucial resistance at $63. A breakout above this level would signal that the trend is bullish.
There are no signs of weakness yet, and the price is expected to eventually break out.
Long-Term Litecoin Resistance Levels
The LTC price is trading very close to a crucial resistance level found at $63. The level has intermittently acted as both support and resistance since September 2019 and is also the 0.618 Fib level of the most recent decrease that began in February 2020. Despite this, LTC created a bullish engulfing candlestick last week, increasing considerably and almost reached the $63 area. The movement also caused the weekly RSI to cross above 50 and accelerated the slope of the Stochastic Oscillator. These are bullish signs that indicate that the price is likely to continue heading upwards. If successful in breaking through $63, the next resistance area would be found at $84.50.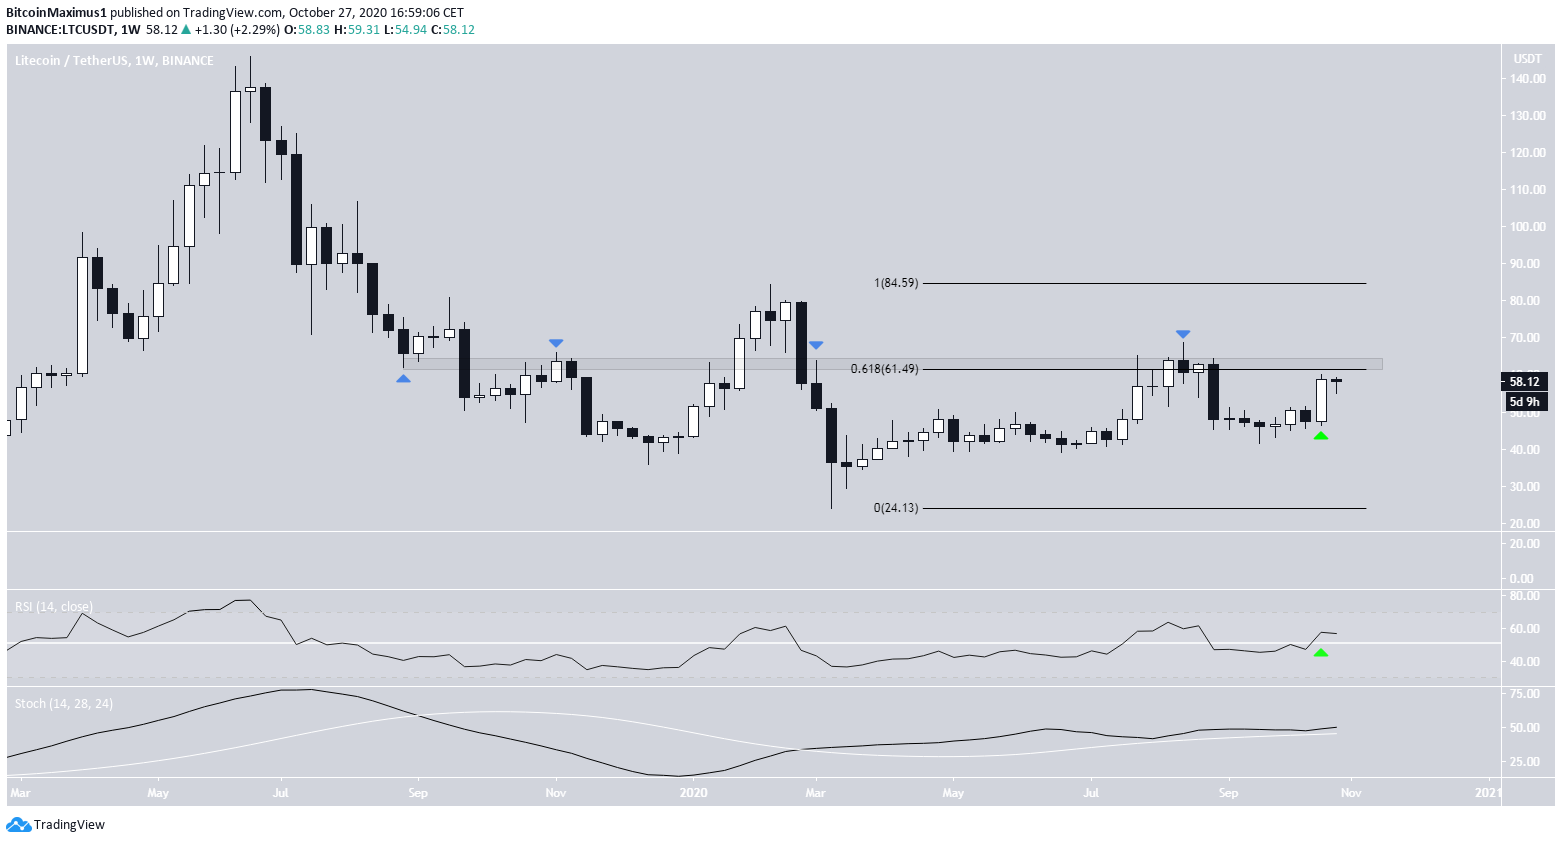
Pattern Breakout
The daily chart provides a bullish outlook. We can see that the price has broken out from an inverse head-and-shoulders (H&S) pattern with a neckline at $51. LTC has traveled the entire height of the pattern, reaching a local high of $60 on Oct 25. Despite the considerable increase, technical indicators do not yet show any weakness, since the MACD, RSI, and Stochastic Oscillator are all still increasing without generating any bearish divergence. The $63 area is also shown as a horizontal resistance level, strengthening its significance. The breakout level at $51 is now expected to act as support.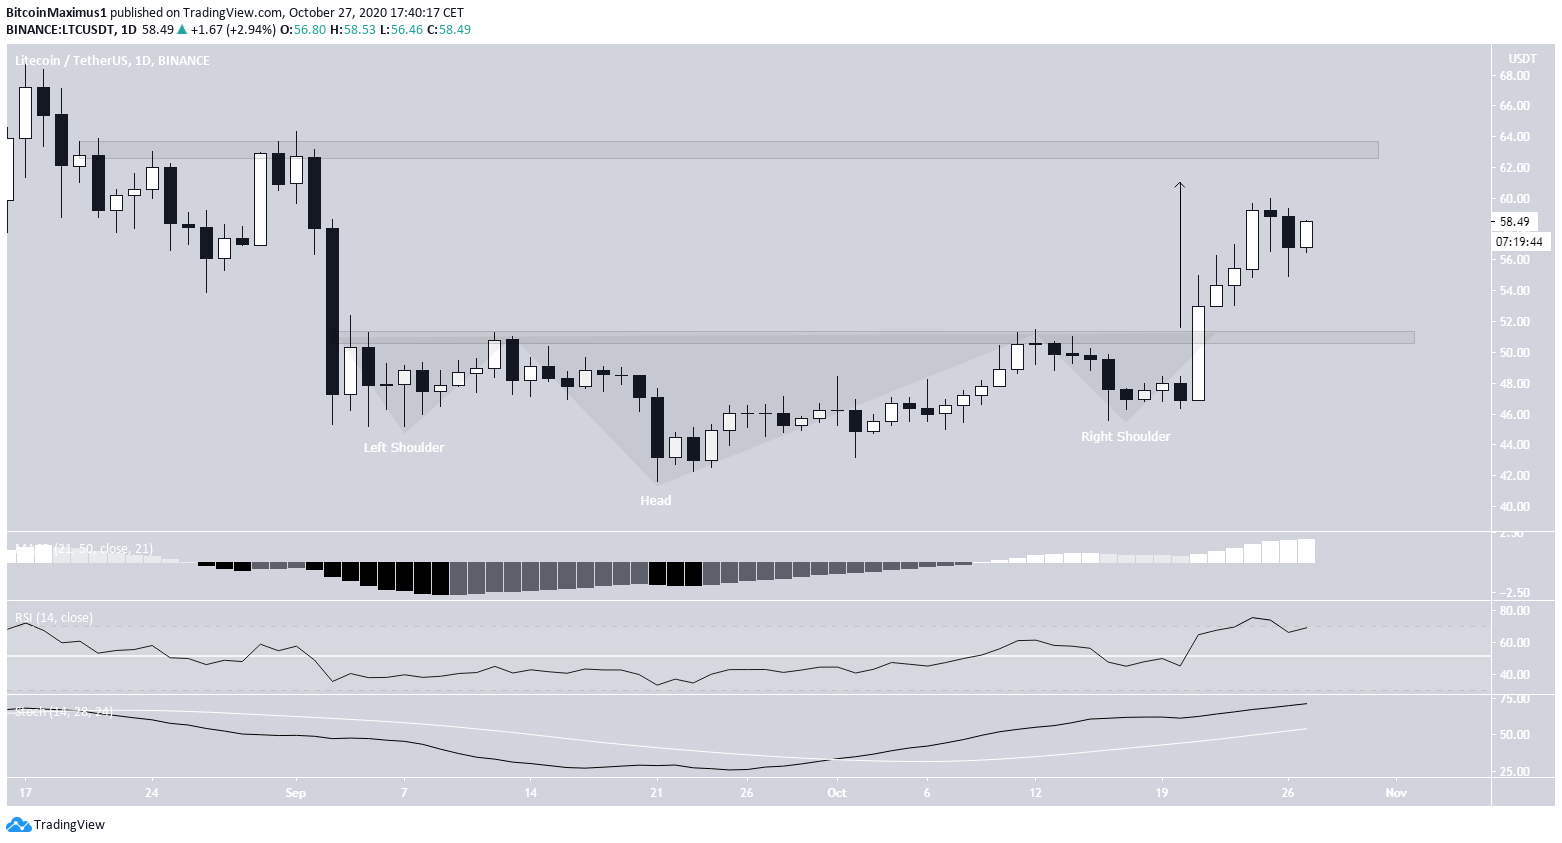
Wave Count
While the long-term count is not entirely clear, it seems that LTC has begun a bullish impulse (shown in black below) after reaching a low on Sept 23. If this is true, LTC is currently in the third wave, which has become extended and has a target of $66.472 (3.61 Fib extensions of wave 1). A decrease below the wave 1 high (black line) at $48.57 would invalidate this particular count. The sub-wave count for the extended third wave is shown in blue. LTC looks to either be in or has just completed sub-wave 4. The target for the top of sub-wave 3 ($64.90) coincides with the longer-term wave count, increasing the possibility that it will be reached. A decrease below the sub-wave 1 high at $51.69 (blue line) would invalidate the sub-wave count, but the longer-term (black) count would still be intact.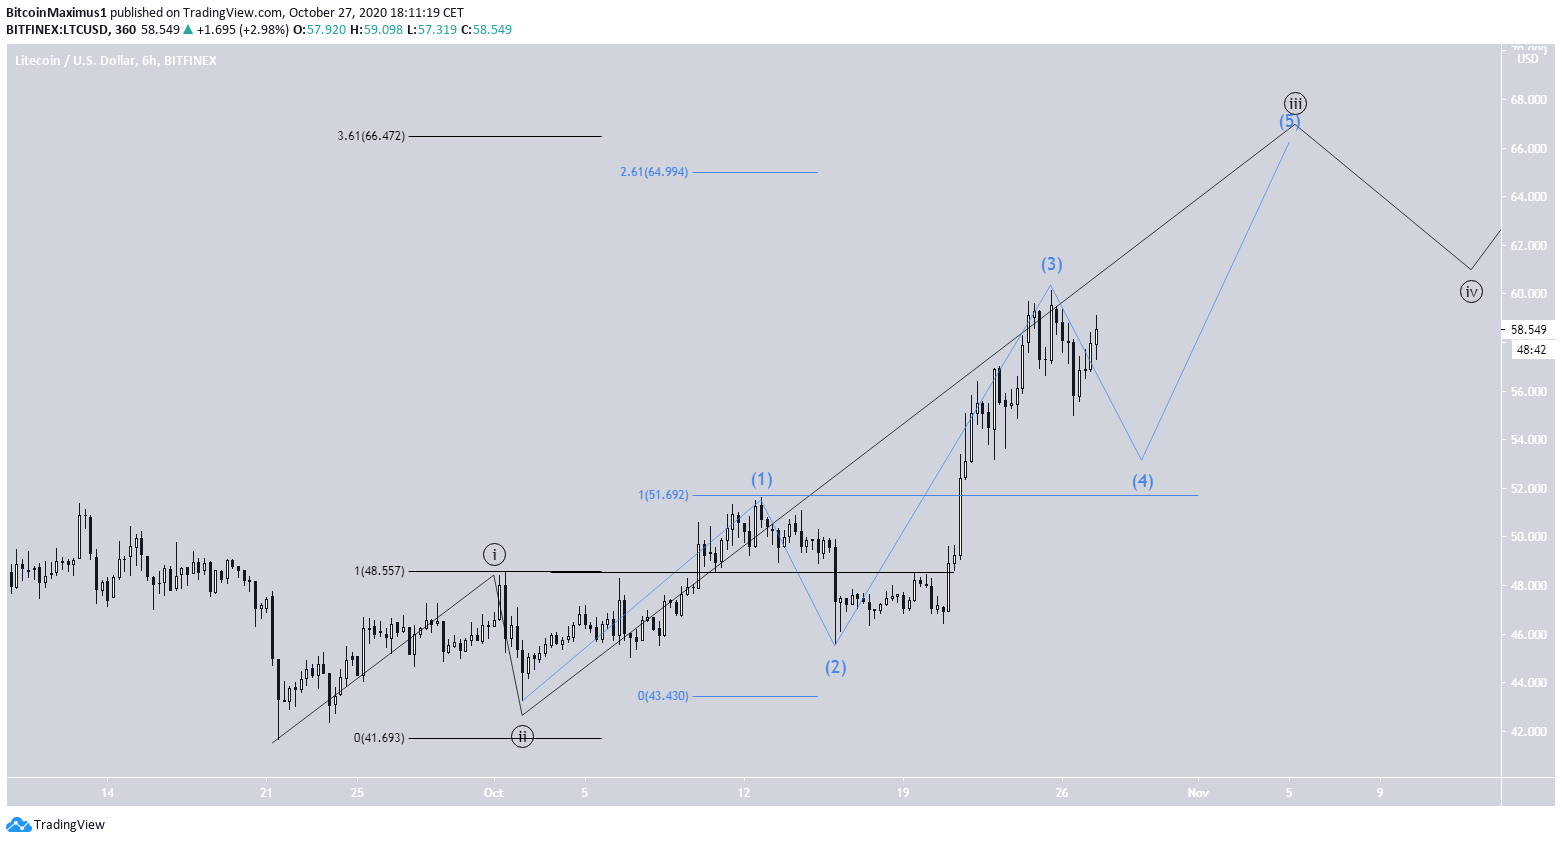
Disclaimer
In line with the Trust Project guidelines, this price analysis article is for informational purposes only and should not be considered financial or investment advice. BeInCrypto is committed to accurate, unbiased reporting, but market conditions are subject to change without notice. Always conduct your own research and consult with a professional before making any financial decisions. Please note that our Terms and Conditions, Privacy Policy, and Disclaimers have been updated.

Valdrin Tahiri
Valdrin discovered cryptocurrencies while he was getting his MSc in Financial Markets from the Barcelona School of Economics. Shortly after graduating, he began writing for several different cryptocurrency related websites as a freelancer before eventually taking on the role of BeInCrypto's Senior Analyst.
(I do not have a discord and will not contact you first there. Beware of scammers)
READ FULL BIO
Sponsored
Sponsored