


In the first week of March 2019, the Venezuelan government launched a remittance program that supports payments with only Bitcoin (BTC) or Litecoin (LTC).
Venezuela’s fiat currency has suffered massive hyperinflation in recent years. The country’s economy is in shambles, and cryptocurrency may be the only way out. Will Venezula help Litecoin reach the moon?
Key Highlights For March 6
- The price is currently on a swing high
- The price is moving inside a parallel channel
- There is bearish divergence developing in the MACD and the RSI
- There are resistance areas near $57 and $63
- There are support areas near $45 and $42
Gradual Upward Movement
The price of LTC on Bitfinex was analyzed on 4-Hour intervals from Feb 10 to Mar 6.
The price of LTC made a high near $49 on Feb 10. A gradual drop took it down to slightly above $41. It has since been on an overall upward trend despite several dips.
At each dip, a new low was reached. Each low was greater than that of the previous low. Using four of these ascending lows, a support line is created.
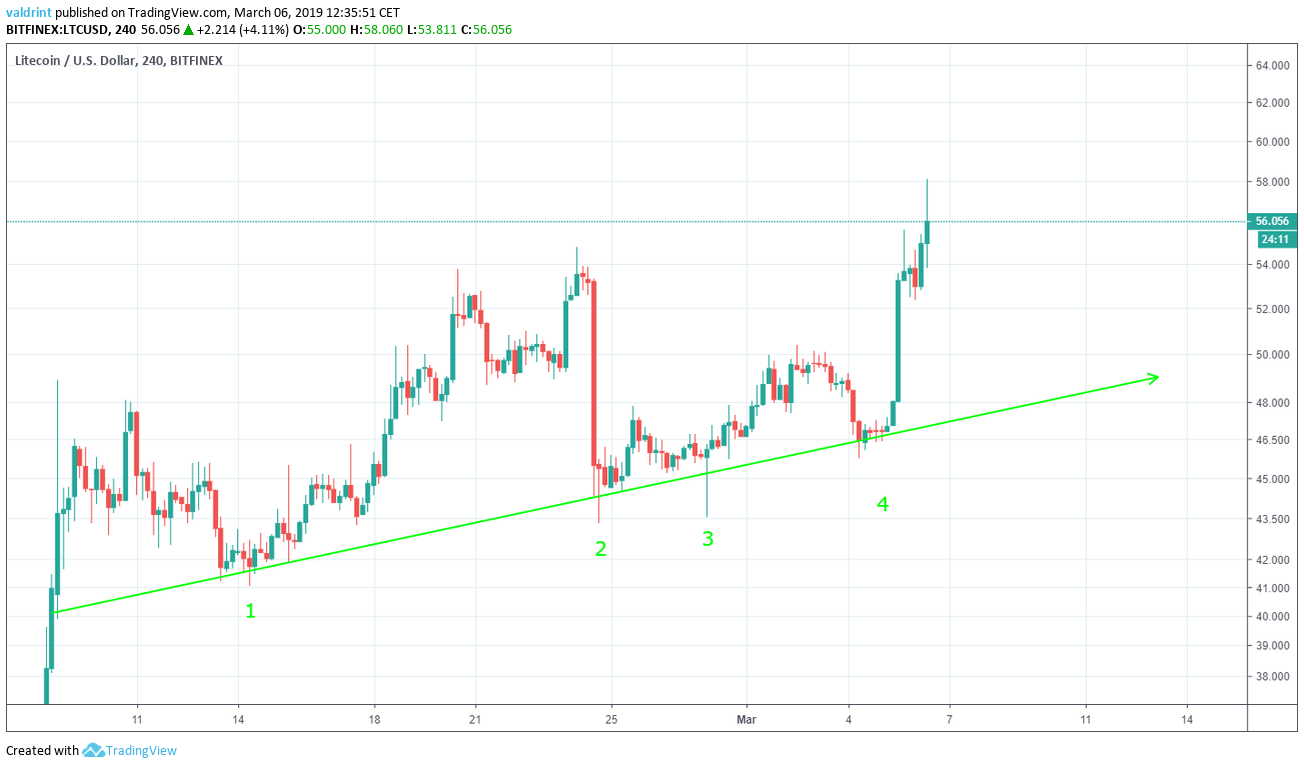
The support line can act as a floor, preventing the price from dropping below that level. It also supports the upward movement and highlights the current trend of Litecoin’s price.
The dates in Litecoin’s price touched the line were:
- Feb 14
- Feb 25
- Feb 28
- Mar 5
The Parallel Channel
Dips along the upward trend correlated with subsequent rises. Just as the lows grew gradually higher along the support line, the highs increased across an ascending resistance line.
Four highs. They occurred on:
- Feb 10
- Feb 21
- Feb 24
- Mar 6
The support and resistance lines combined create a parallel channel. If the price moves outside this channel for a significant period, new resistance and support lines may develop.
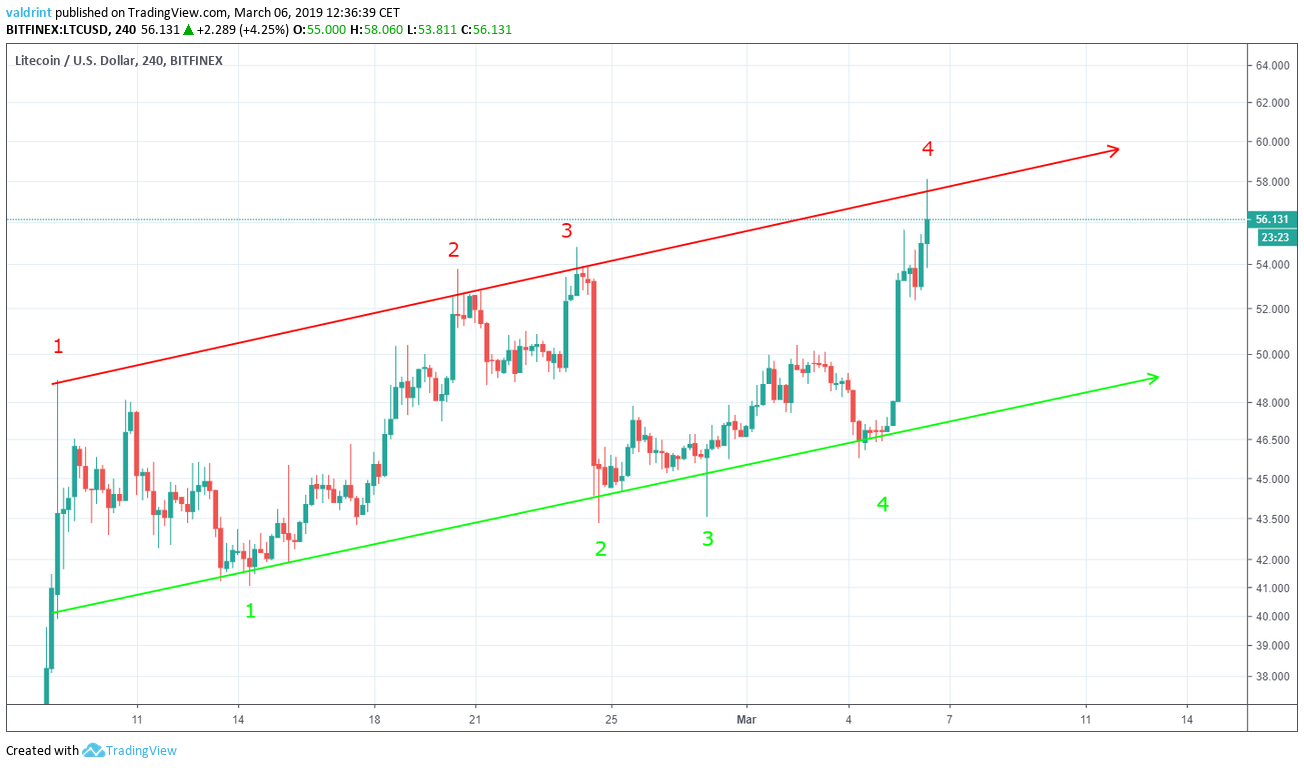
On Mar 6, the price rose just above the resistance line. Prices may continue rising beyond the parallel channel, but recent rises and dips suggest that this increase will likely precede a forthcoming dip—which will likely bring the price back into the parallel channel.
It is unclear how long Litecoin will continue trading within this range. If ascending highs and lows continue along this trend, the price may soon break out of the resistance.
The Long-Term Divergence
The moving average convergence divergence (MACD) is a trend indicator that shows the relationship between two moving averages (long and short-term) and the price. It is used to measure the strength of a move.
The relative strength index (RSI) is an indicator which calculates the size of the changes in price in order to determine oversold or overbought conditions in the market.
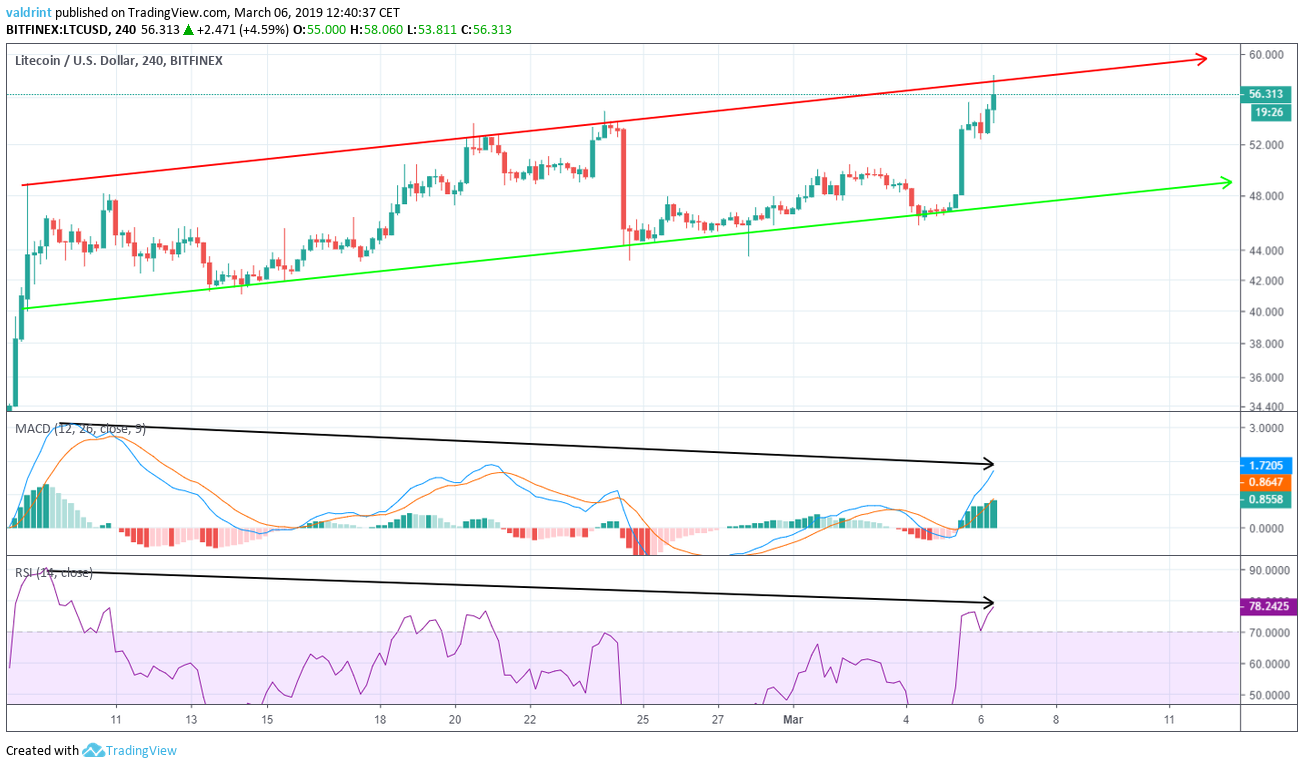
As stated above, since reaching the top of $49, the price has made higher highs over the month of February. The MACD and RSI did not act in the same manner. They both reached a high on Feb 10 and continued to make lower highs during February.
This is called bearish divergence. It often precedes drops in price—as suggested already by the current trading pattern.
The use of divergence in the RSI and the MACD combined with the use of support/resistance lines can be effective in predicting a reversal. Predictions can be especially precise if there is a bearish divergence in a resistance line.
Both indicators are in agreement that a price decrease is likely forthcoming.
Movement Outside The Channel
Resistance and support areas are created when the price reaches the same level several times. They can effectively act as a respective ceiling or floor to create a structure in which the price of an asset can fluctuate. They can be effective in predicting areas of reversal when the price breaks out/breaks down of a trading channel.
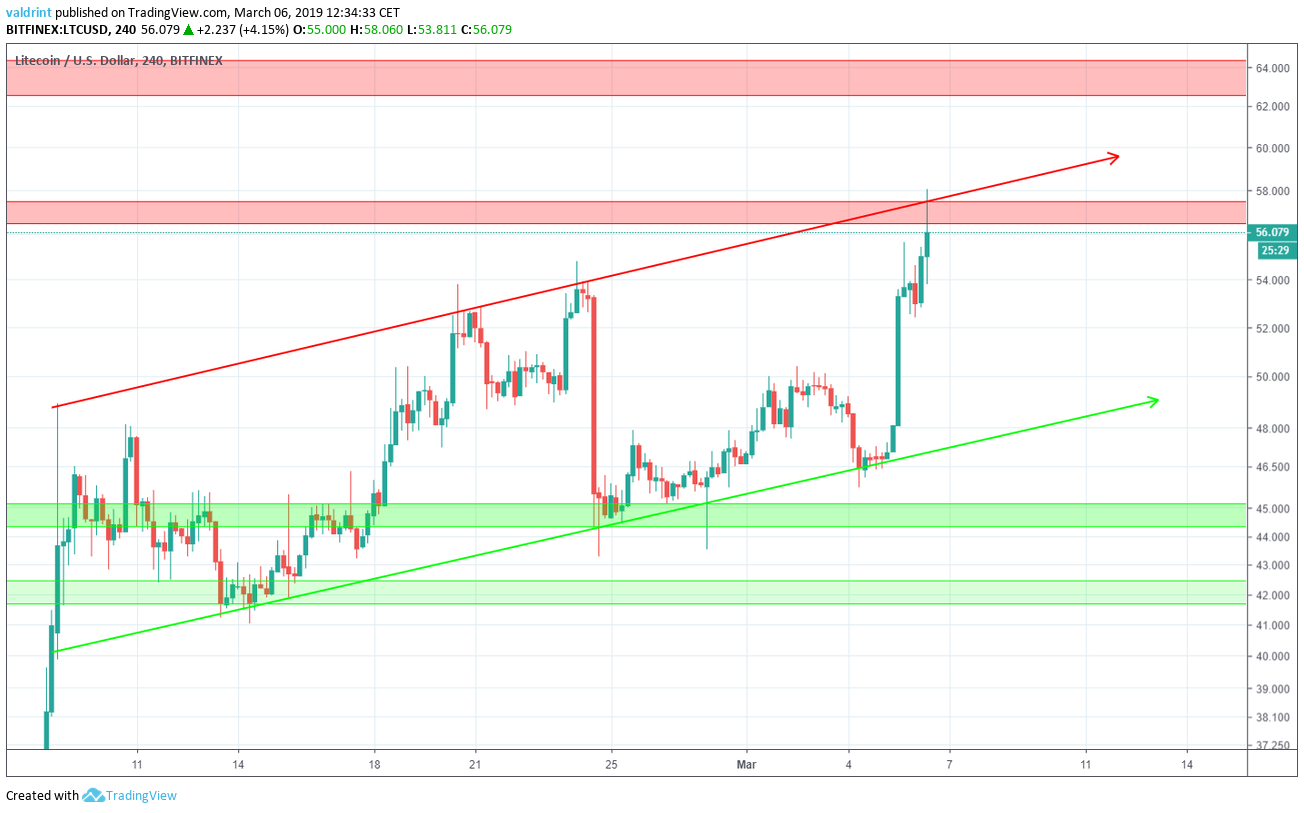
In the case of LTC, the closest resistance area is found near $63.5. Conversely, support areas are found near $45 and $42. If a dip does occur as projected, the price of Litecoin may fall to the ascending support line near $48 within the next few days.
Do you think that the price of Litecoin will trade inside the channel or break down? Let us know your thoughts in the comments below!
Disclaimer: This article is not trading advice and should not be construed as such. Always consult a trained financial professional before investing in cryptocurrencies, as the market is particularly volatile.


