Both LTC/USD and LTC/BTC have broken out from descending resistance lines and are targeting the closest resistance levels.
The breakout from the current descending resistance line was noted by cryptocurrency trader @Mesawine1, who tweeted an image showing the breakout and predicting that the price could increase all the way to the next resistance area at $80.
$ltc update: #ltc has broken out of his triangle and for now it looks pretty solid IF this shows continuation my mainfor #litecoin is ~$80 at the: – 1:1 of (A) – 0.618 fib of PF – Major weekly res A LOT of res is in between so it’s no given. Taking it one step at a time
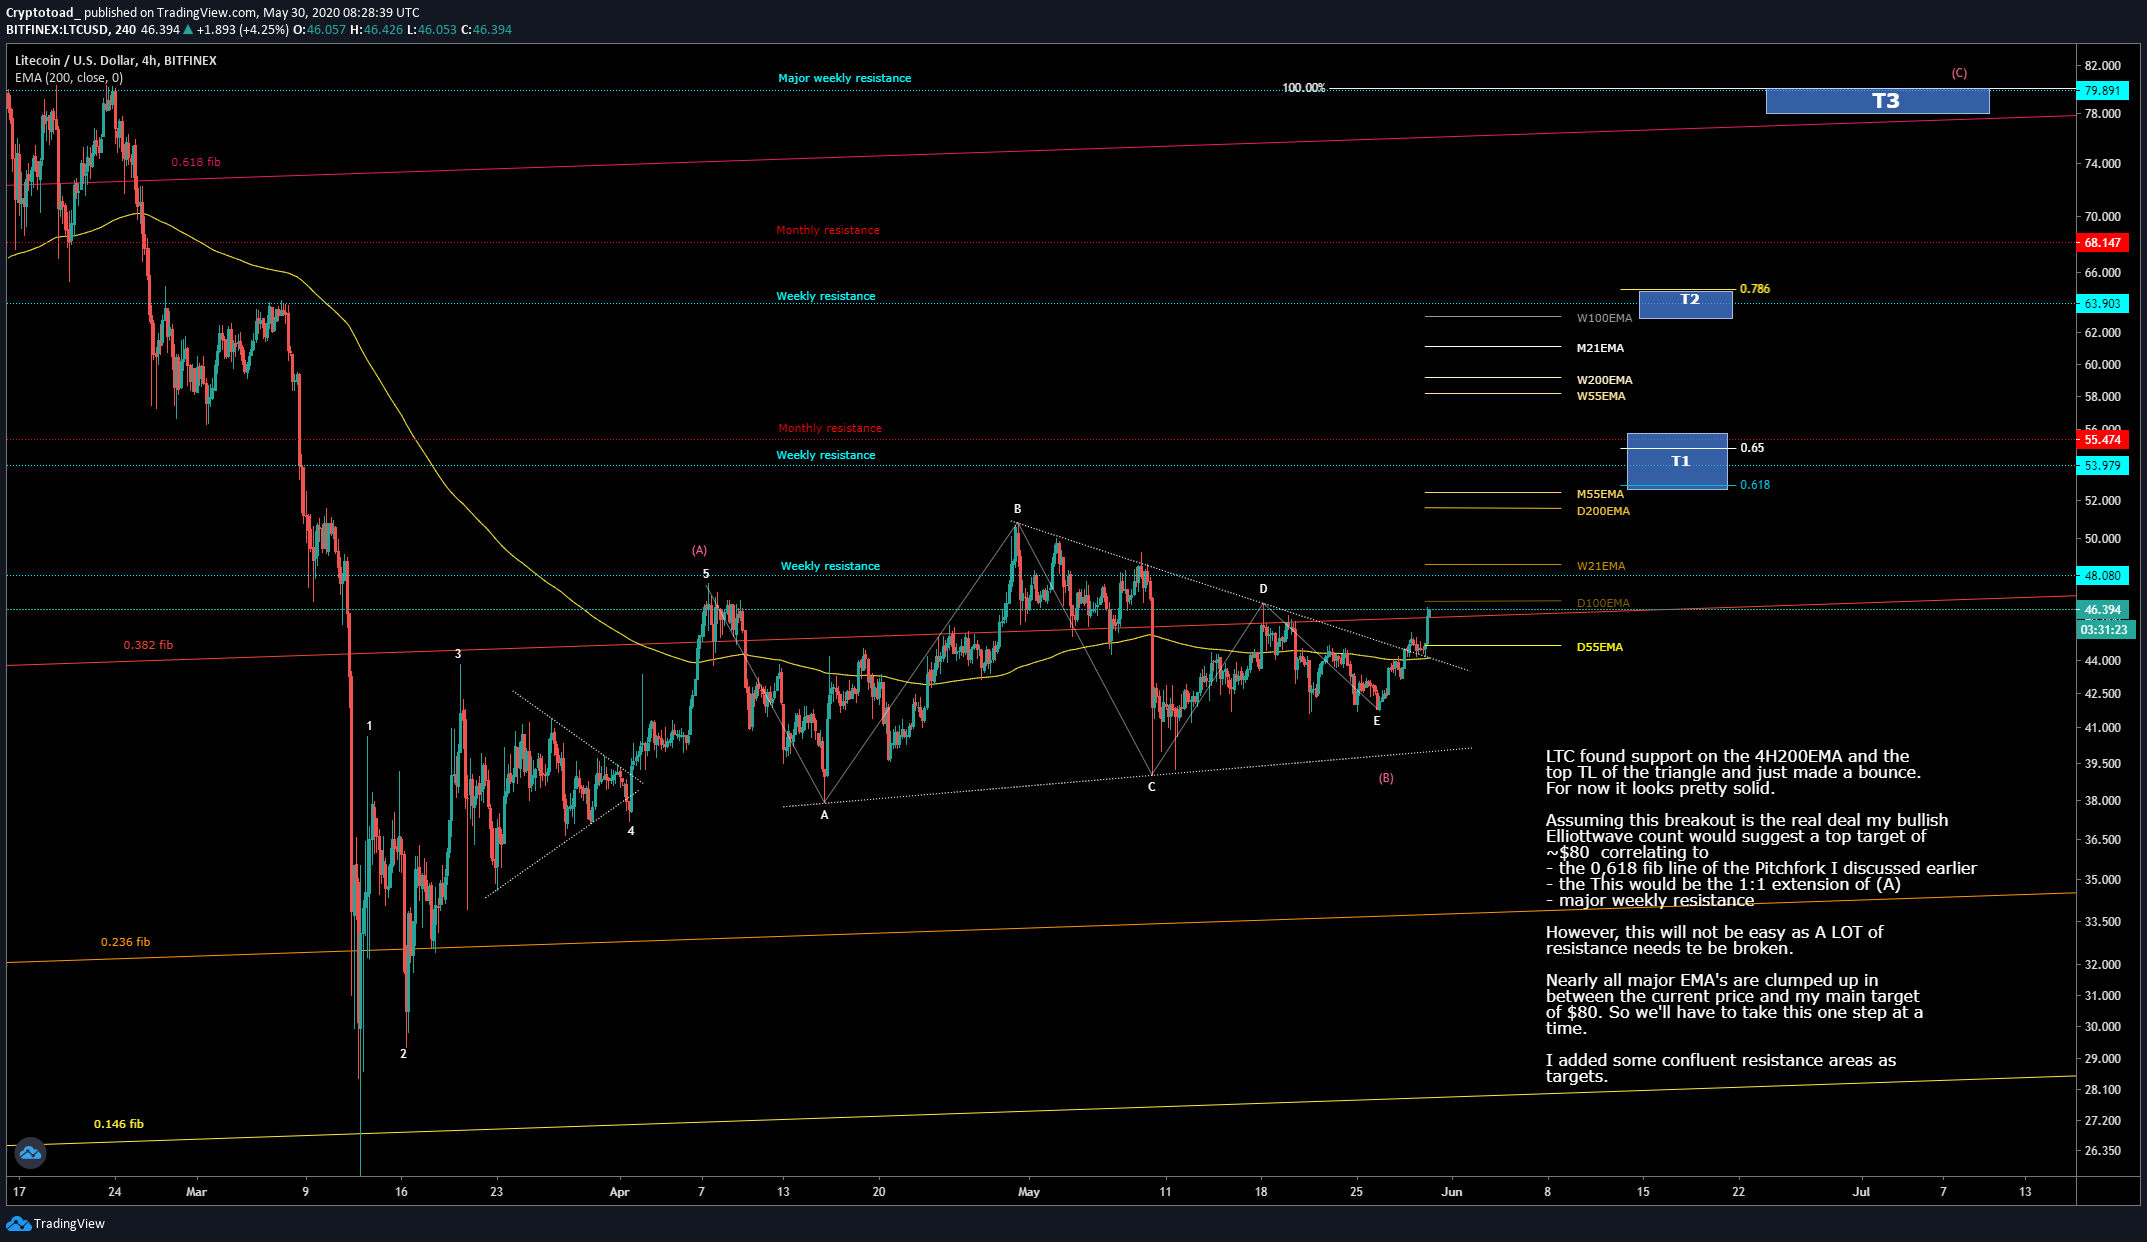
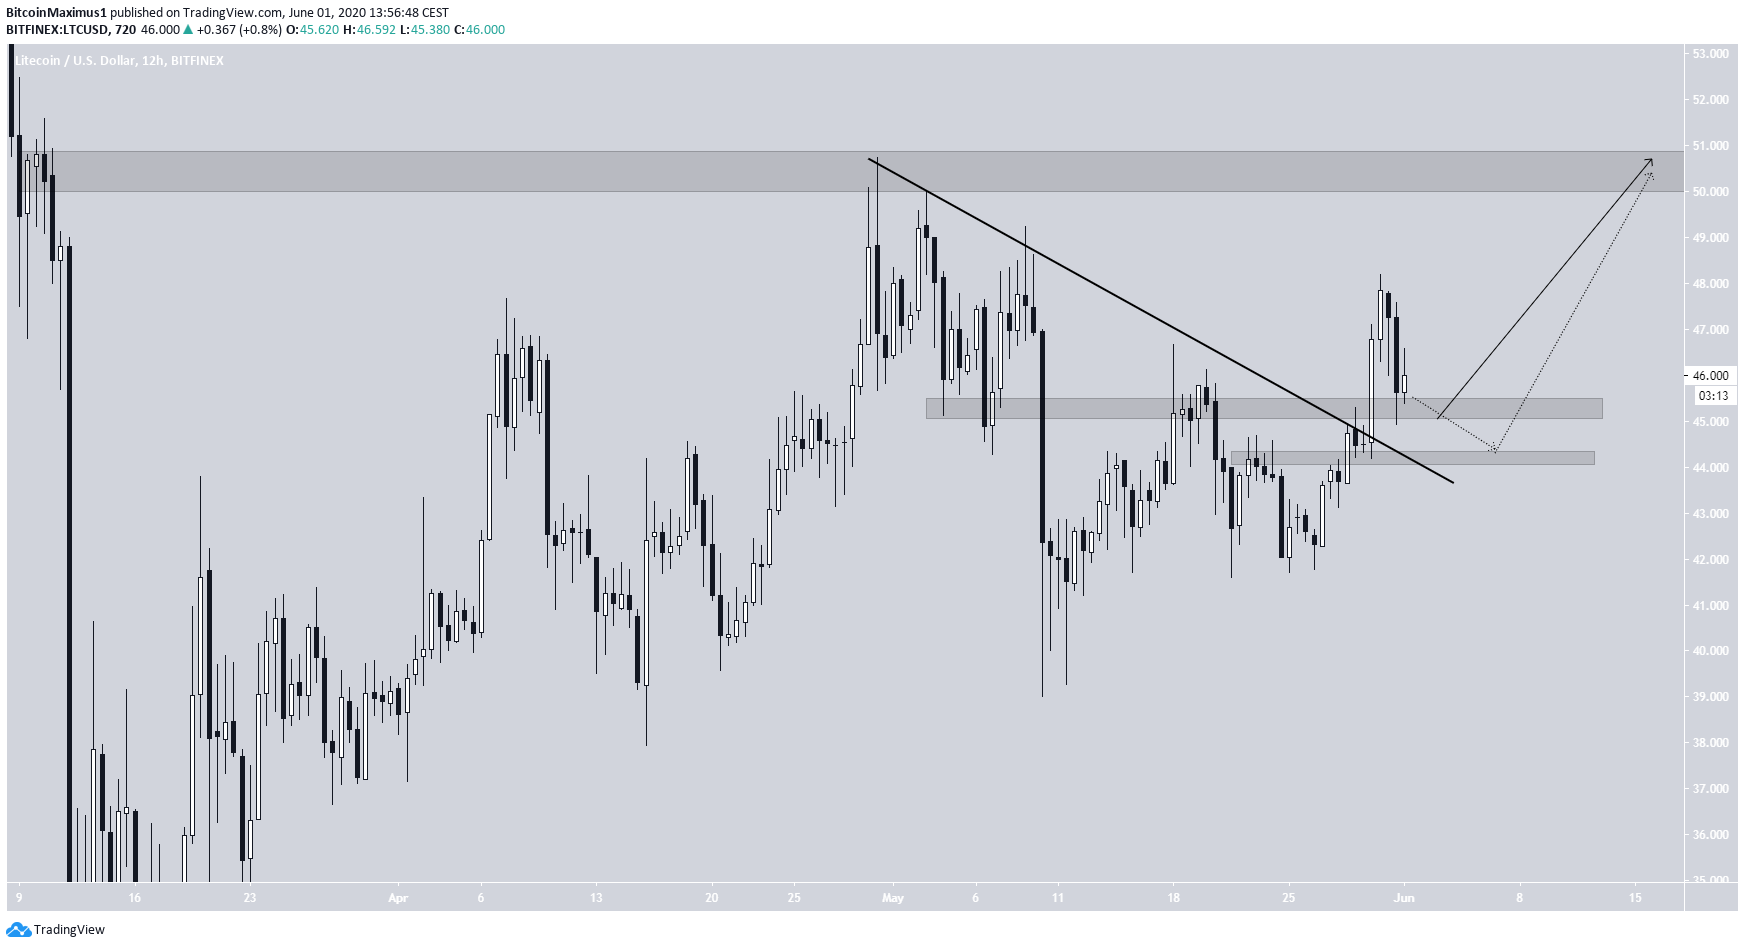
Indeed, Litecoin broke out from a descending resistance line on May 30 and has been increasing since. After the breakout, LTC returned to validate the $45.3 area, which has now turned to support. While it is possible that the price will decrease towards the $44 minor support area, it seems poised to eventually reach $50 — where a crucial resistance area is found.
Until the price is successful in flipping the $50 area, the price movement for LTC cannot be considered bullish. Therefore, while the price could increase all the way to $80 as stated in the tweet, it initially has to flip the $50 area as support.
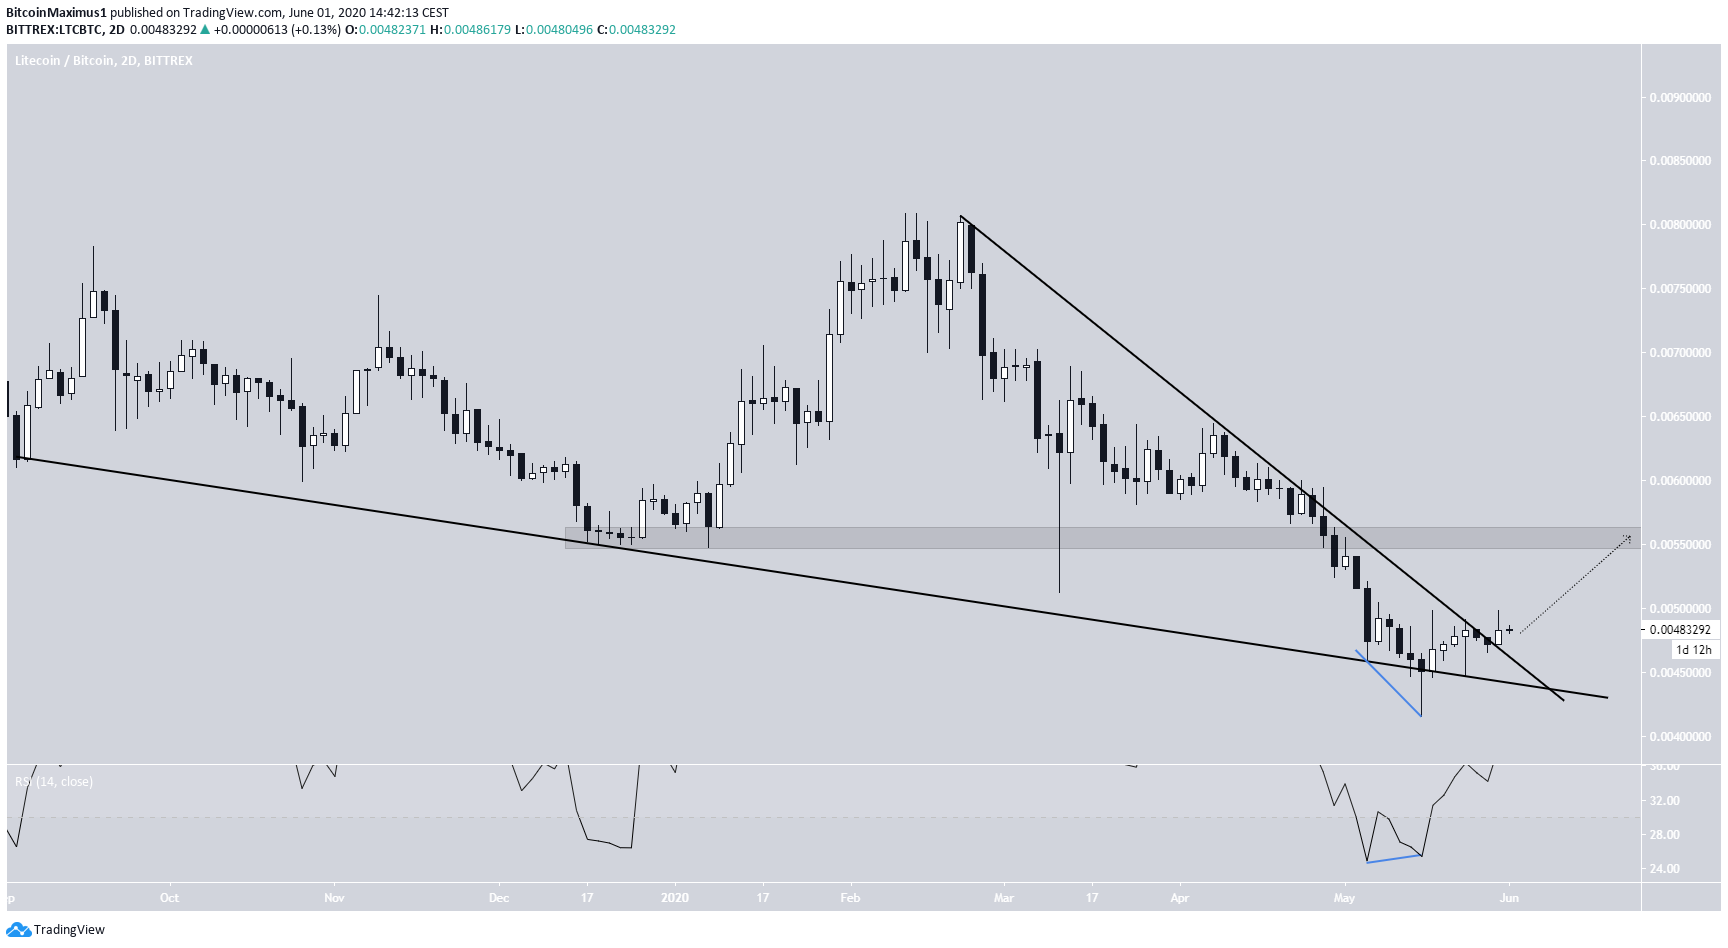
Litecoin/Bitcoin
At the beginning of May, LTC broke down from its 2020 range low of ₿0.0055 and has been decreasing since. However, the price bounced on the long-term descending support line on May 16 — a move that was preceded by a bullish divergence. Litecoin has been increasing since.
Yesterday, the LTC price broke out from the possible descending wedge it has been trading in since the beginning of March. If the price continues increasing, it could move to validate the ₿0.0055 area it previously broke down from.
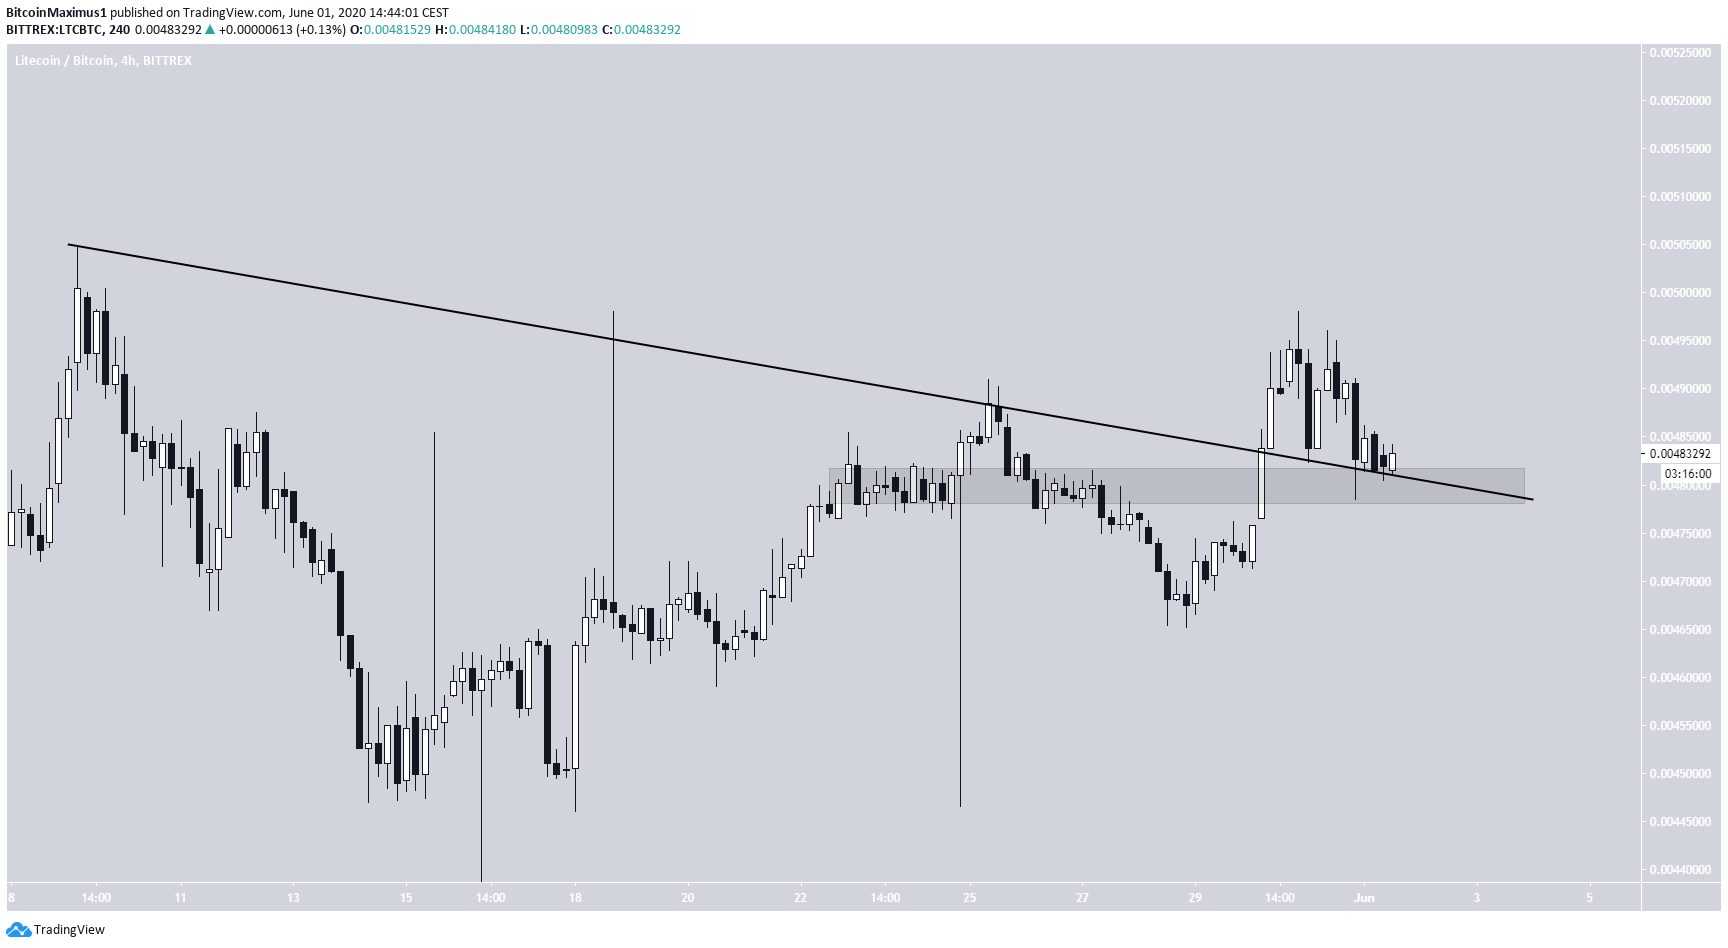
In the short-term, LTC has broken out from a descending resistance line and validated it as support, along with the ₿0.0048 horizontal support level. This suggests that Litecoin is likely to increase and move towards the previously mentioned resistance area.