


On June 2, 2019, the Litecoin price reached a low of $116.97. A gradual decrease ensued. The LTC price made lows of $98.16 on June 4.
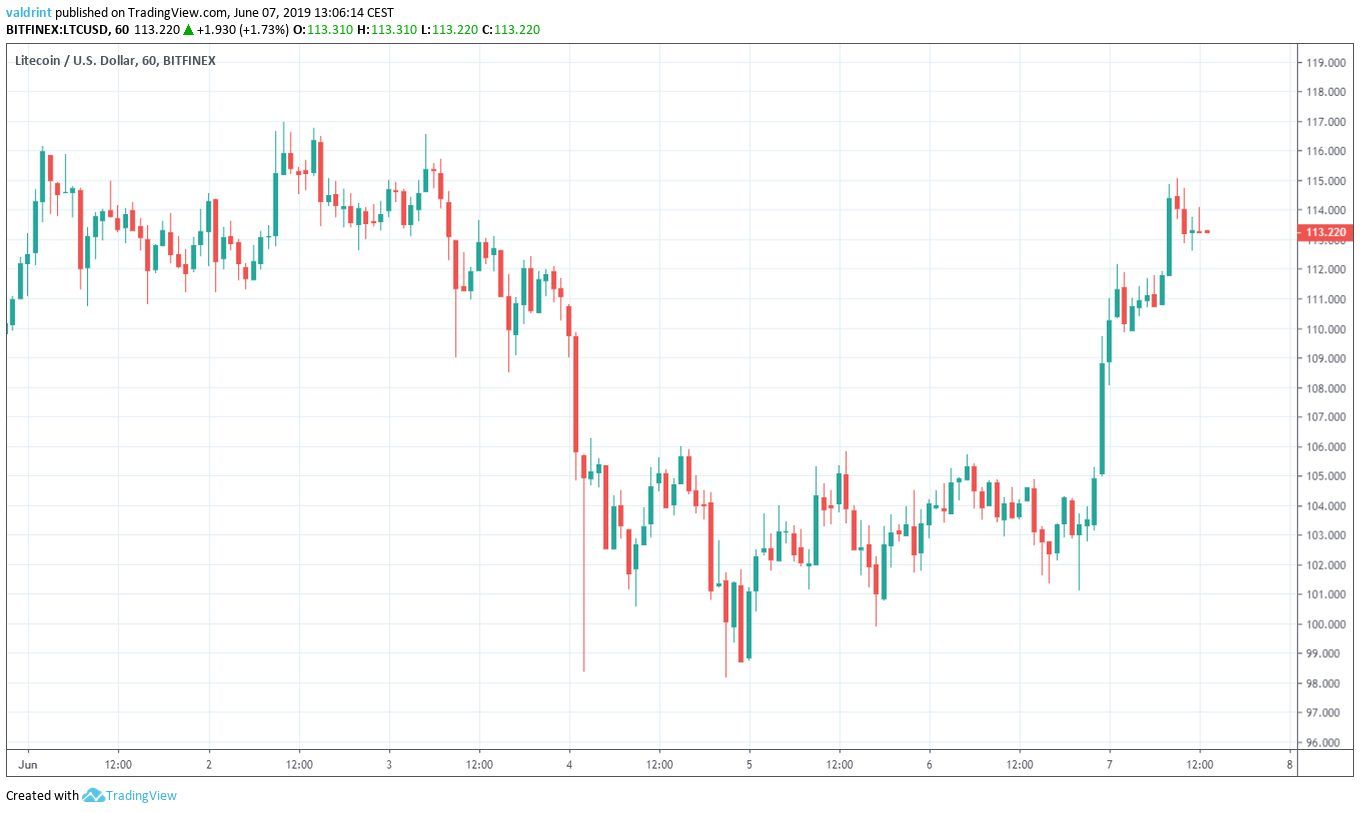
It has been increasing since.
For a summary of recent price actions, you can watch our video below:
Litecoin Price (LTC): Trends and Highlights for June 7, 2019
- LTC/USD broke out of an ascending triangle.
- The breakout occurred with significant volume.
- Bearish divergence has developed in long-term timeframes in the RSI and the MACD.
- It is possibly in the first wave of a three-wave decrease formation.
- There is resistance near $122 and support near $96.
Litecoin Price: Horizontal Channel
On June 4, the Litecoin price reached a low of $98.65. A gradual increase ensued and the price reached a high of $105.8 the next day. Since then, the price has been trading inside the symmetrical triangle outlined below:
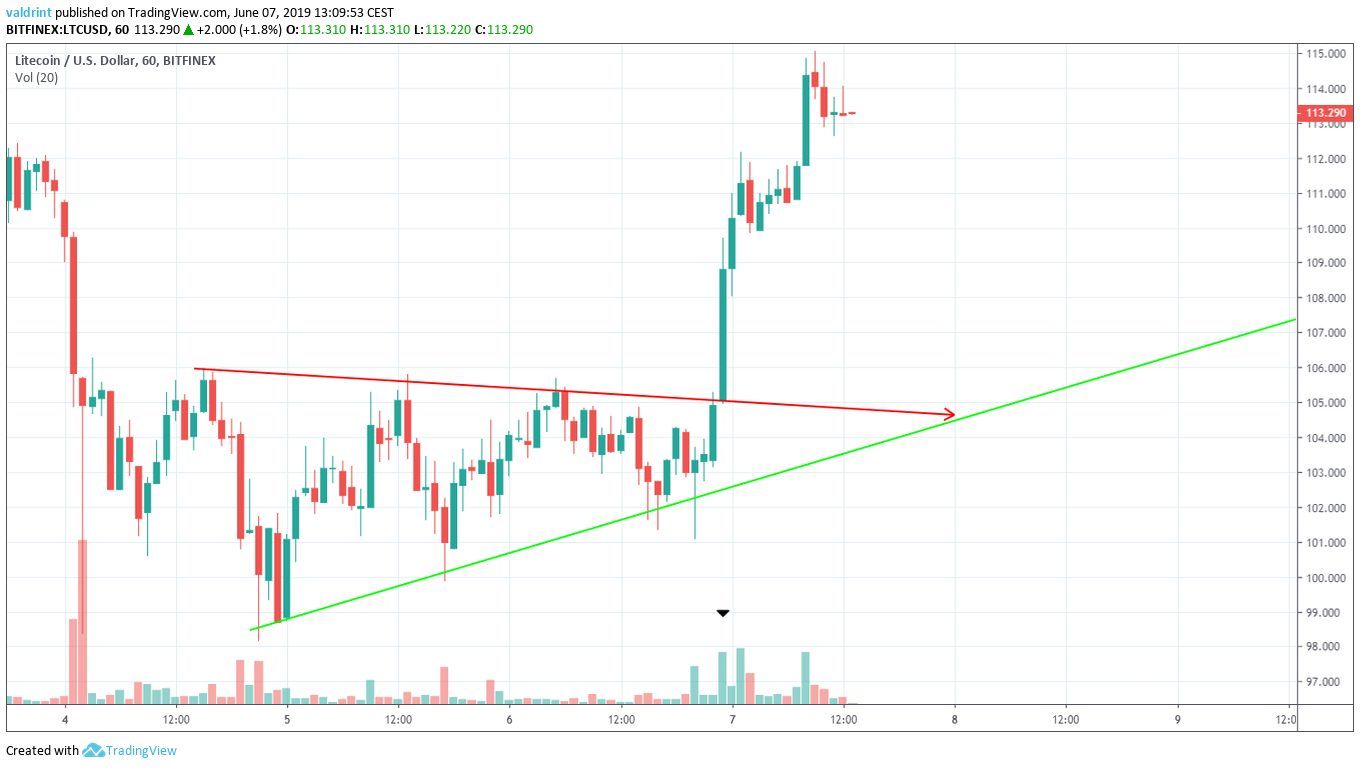
On June 6, the LTC price broke out from the triangle. It made a high of $115 before beginning to decrease. Where will it go next?
A look at technical indicators in a long-term timeframe is required in order to find out.
Bearish Divergence
To better determine future price movements, the Litecoin price is analyzed at daily intervals alongside the RSI and the MACD below:
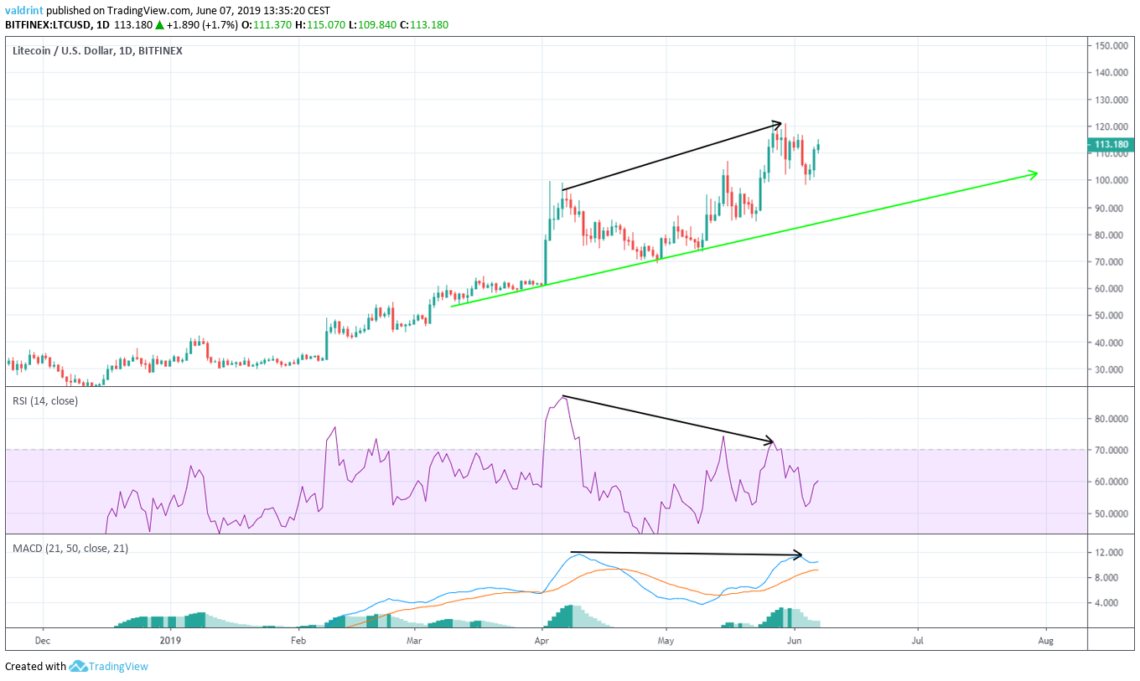
The Litecoin price has been following an ascending support line since it made a low of $53.43 on Mar 12.
Furthermore, there is bearish divergence developing in the RSI and the MACD. This is evident in the highs reached on Apr 5 and May 28. This is often a sign of price decreases.
One possible pattern of how this decrease will materialize is outlined below using Elliott Wave theory:
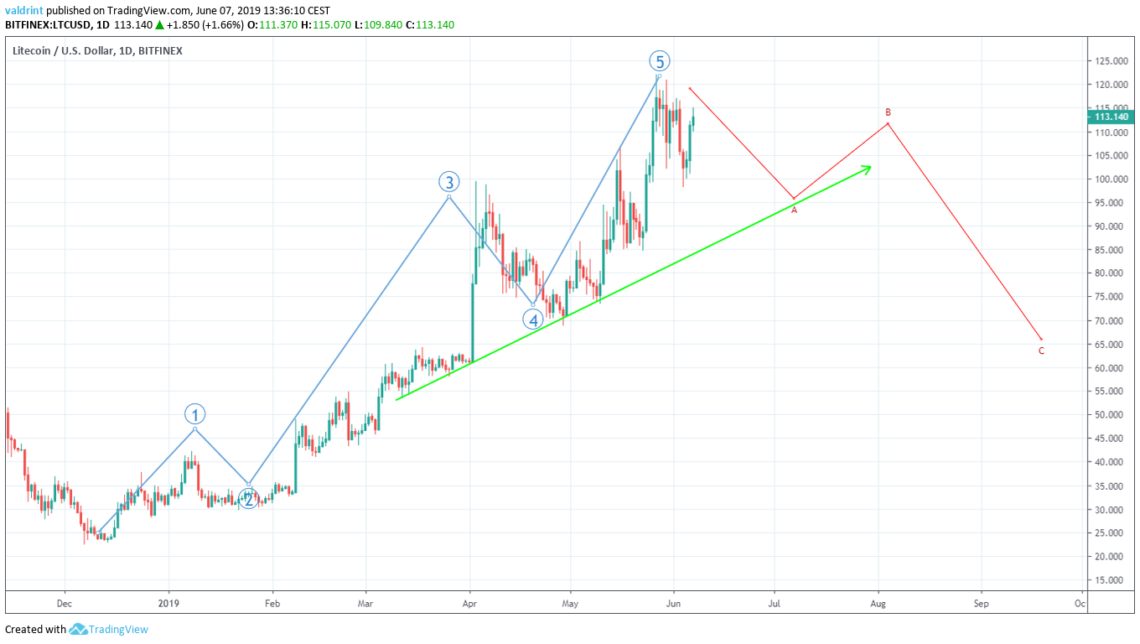
However, this pattern of decrease is a very broad hypothesis of how the Litecoin price might decrease. It is still too early to predict the exact price movements of this possible move.
Nevertheless, we believe a short-term decrease towards the ascending support line is inevitable.
However, this decrease will not likely follow a straight line. Let’s look at possible reversal areas between current prices and the support line.
Finding Long-Term Support
One support and one resistance area is traced for LTC/USD below. If the LTC price begins a decisive upward or downward move, they are likely to provide a reversal.
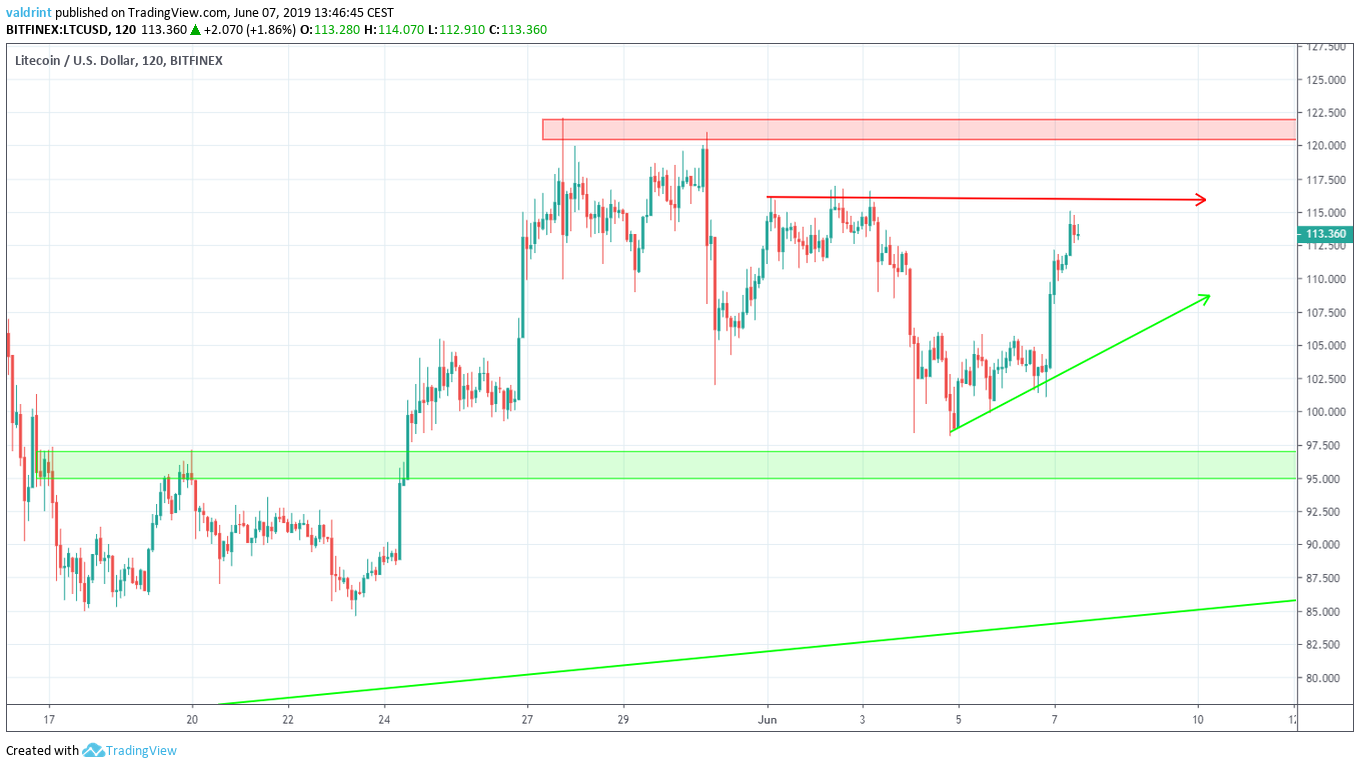
The closest support area is found near $96. An analysis of technical indicators supports the possibility that the Litecoin price will break down from the triangle and reach this area.
The closest resistance area is found near $122. A breakout from the triangle would be required for the price to reach this area. Technical indicators do not support this possibility.
Summary
The Litecoin price is trading inside an ascending triangle. Based on this analysis, it is likely that the price will eventually break down from this triangle. Afterward, it is likely that it will reach the support area outlined above.
Do you think the Litecoin price will reach the support area? Let us know in the comments below.
If you’re interested in 2019 and 2020 price predictions for Litecoin in dollars, click on the blue button below
Disclaimer: This article is not trading advice and should not be construed as such. Always consult a trained financial professional before investing in cryptocurrencies, as the market is particularly volatile.


