
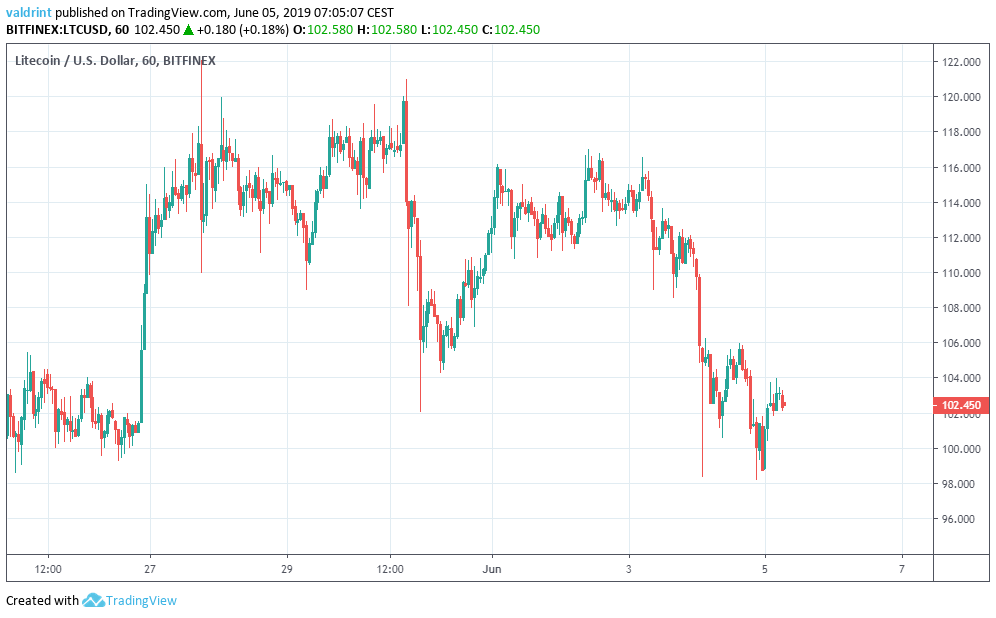
On May 27, the Litecoin price reached a high of $122. Similar highs were reached on May 30. The LTC price has been decreasing since.
In this analysis, we examine the Litecoin (LTC) price alongside technical indicators to determine whether the price is more likely to continue falling or rebound.
Litecoin Price (LTC): Trends and Highlights for June 5, 2019
- LTC has been on a downtrend since May 30.
- It is trading in a descending channel.
- Short-term bullish divergence is developing in the RSI.
- The price is trading in line with the moving averages.
- There is resistance near $104.
- There is support near $96.
Descending Channel
On May 27, the price reached a low of $109.9. A gradual increase ensued and the price reached a high of $121.0 on May 30. Since then, it has been gradually decreasing, trading inside the descending channel outlined below:
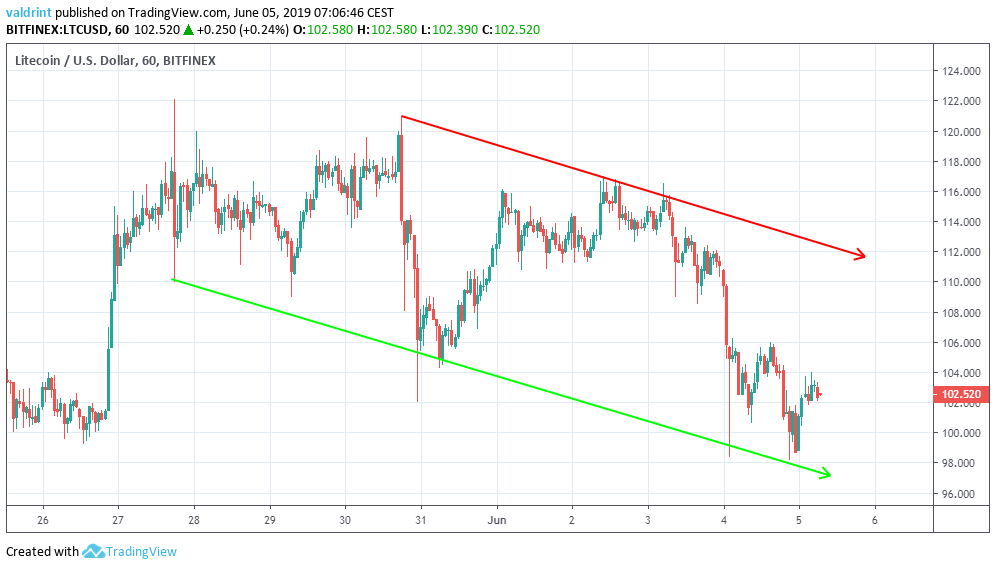
At the time of writing, the Litecoin price was trading close to the support line of the channel. On Jul 4, it made two lows near $98, before beginning short upward moves.
Will the LTC price rebound or are more decreases in store? Let’s take a look at some technical indicators
Technical Indicators
The Litecoin (LTC) price is analyzed alongside the RSI and the 10- and 20-period moving averages (MA) below:
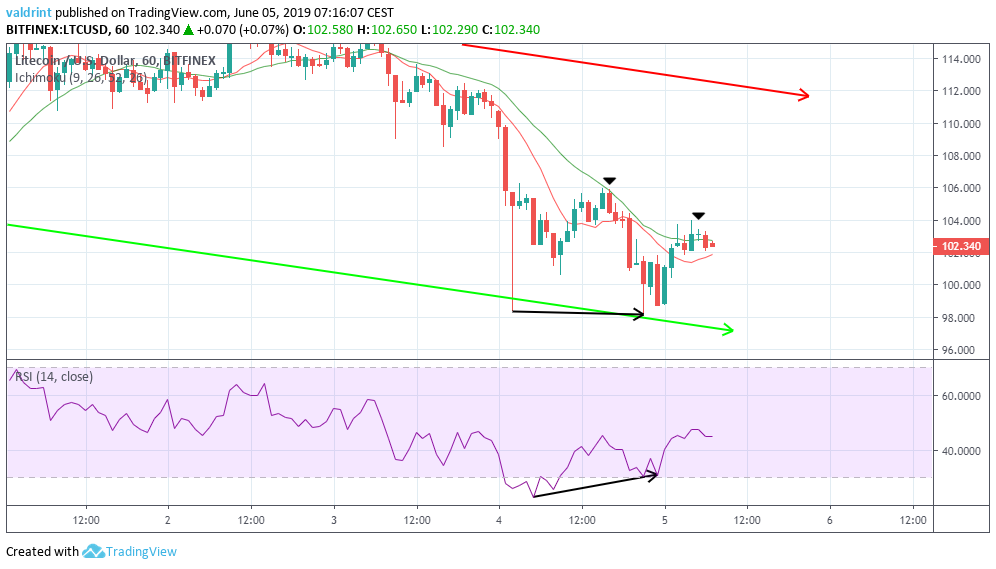
Furthermore, the price is very close to trading above both the 10- and 20- period moving averages. A bullish cross is also close to occurring.
On Jun 4, the MAs provided resistance to the price and a bullish cross was rejected. It is possible that the pattern will repeat itself. However, the bullish divergence supports an increase. A decisive movement above the MAs could trigger an upward move towards the resistance line of the channel.
However, this would only be a short-term increase. In our previous analysis, we stated that:
There is bearish divergence developing in the RSI. In this timeframe (3-day), this has not occurred since August 2017.
Current market movements have done nothing to invalidate our assumption, and the short-term divergence is not sufficient to do so.
Reversal Areas
Support and one resistance area are traced for LTC/USD below. They are likely to provide reversals in case the Litecoin price reaches these areas.
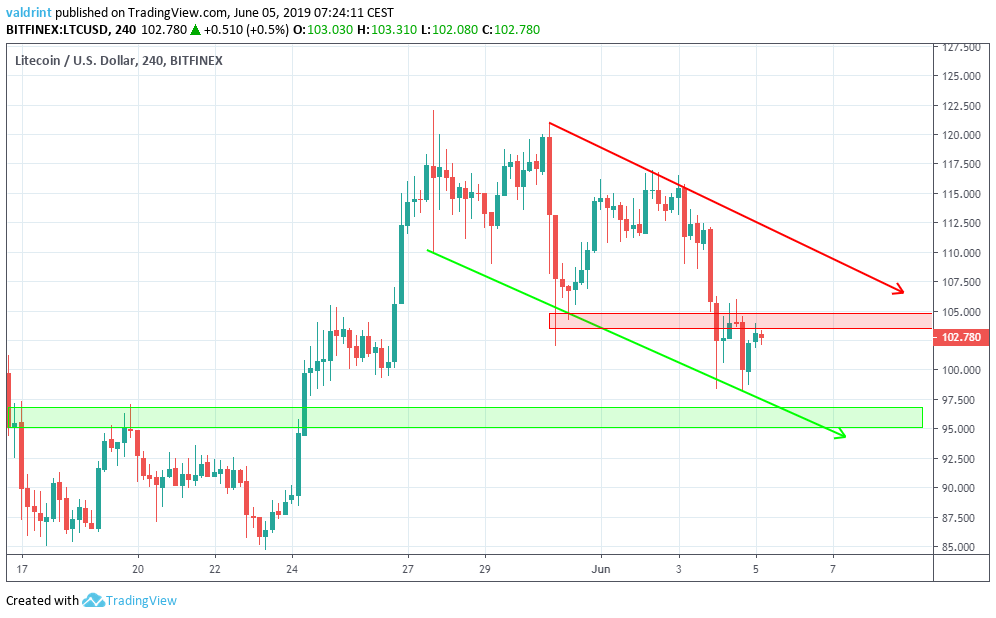
The closest support area is found near $96. If the LTC price keeps decreasing at the rate predicted by the channel, it is likely to reach this area on Jun 7.
Conversely, the closest resistance area is found near $104. The Litecoin price is currently trying to break out above it. A decisive movement above this area could trigger a rapid move towards the resistance line of the channel.
Summary
Based on this analysis, it is likely that the Litecoin price will continue to trade inside the confines of the descending channel. While short-term increases are possible, we believe that a breakout is unlikely.
Do you think the Litecoin (LTC) price will continue to trade inside the channel? Let us know in the comments below.
If you’re interested in 2019 and 2020 price predictions for Litecoin (LTC) in dollars, click on the blue button below
Disclaimer: This article is not trading advice and should not be construed as such. Always consult a trained financial professional before investing in cryptocurrencies, as the market is particularly volatile.
