


On May 30, the Litecoin price (LTC) reached a low of $102. A gradual increase ensued. The price reached highs near $116 on July 1 and 2.
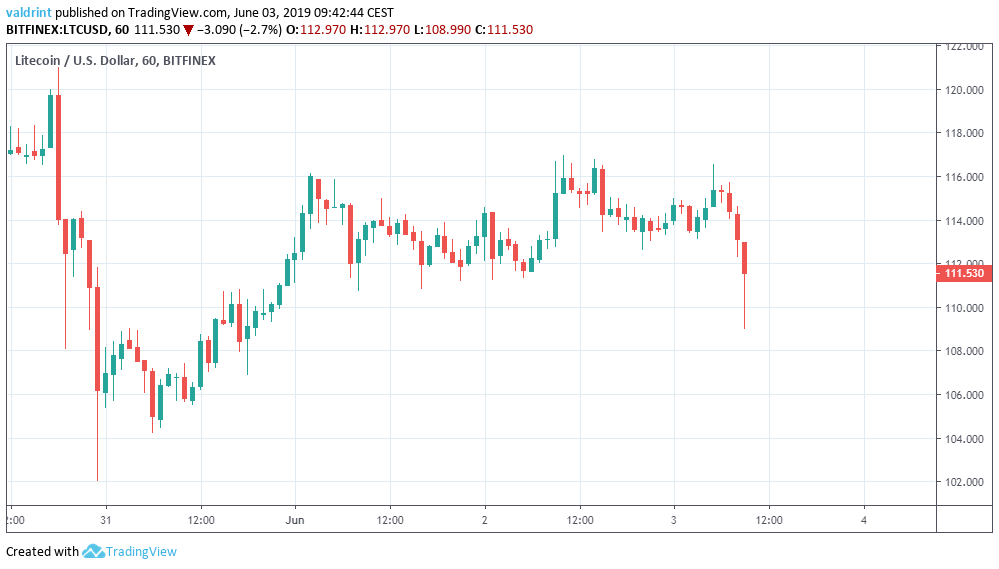
Afterward, the price began to decrease.
In this analysis, we examine Litecoin price (LTC) trends and indicators to determine whether the price will likely continue falling or rebound.
Litecoin price (LTC): Trends and Highlights for June 3, 2019
- LTC has been on an uptrend since May 30.
- It is trading in a horizontal channel.
- A bearish divergence has developed in long-term timeframes in the RSI.
- It is potentially beginning a three wave decrease formation.
- There is support near $102.
Horizontal Channel
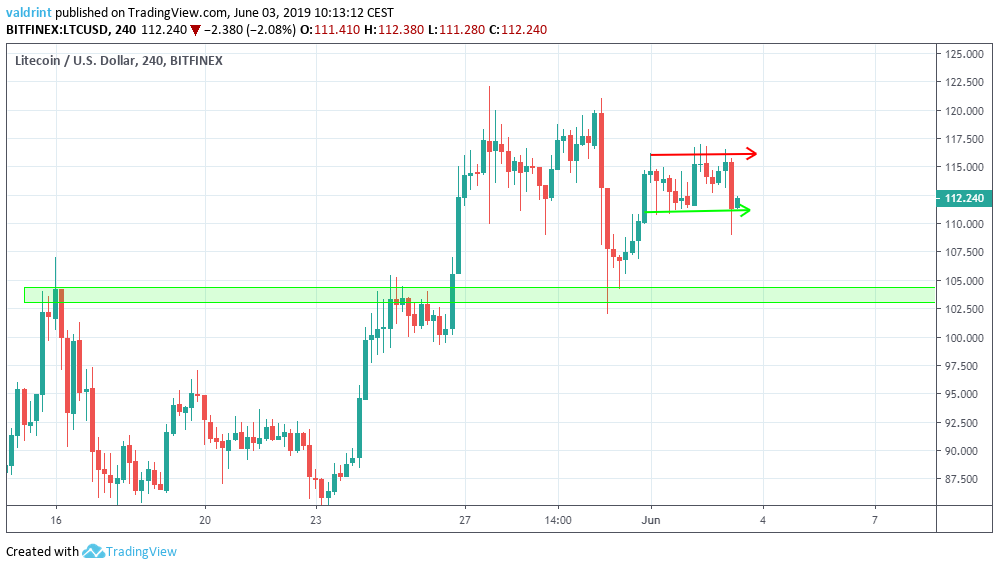
On June 1, the Litecoin price (LTC) reached a high of $116.1. A gradual decrease ensued and the price reached a low of $110.7 the same day. Since then, the price has been trading inside the horizontal channel outlined below:
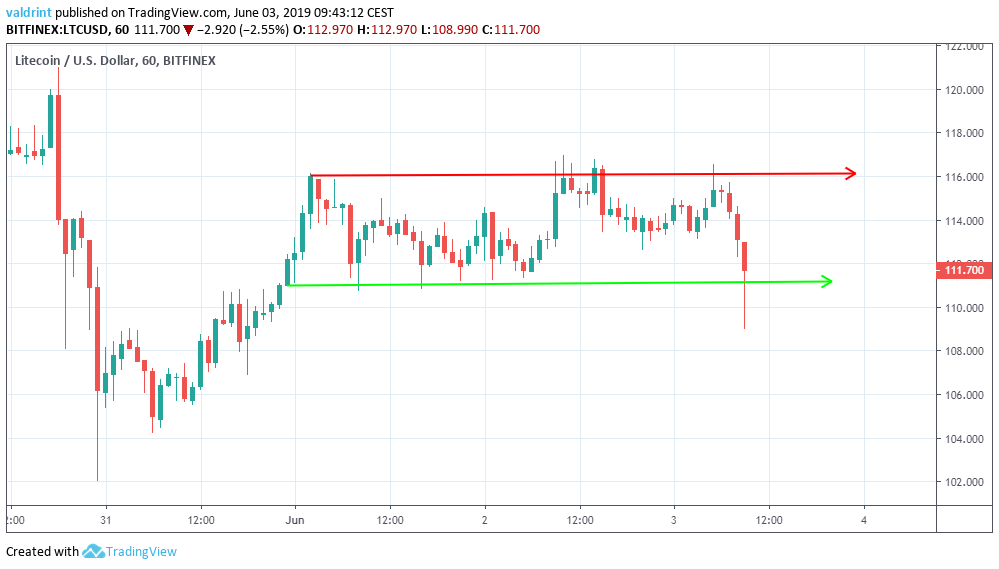
On June 3, the price broke down from the channel, only to immediately rebound and find support above it.
Will the price begin to increase or is a breakdown inevitable?
What About a Breakdown?
To better determine the likelihood of a breakdown, the Litecoin price (LTC) at three-day intervals alongside the RSI. One resistance area is also traced below:
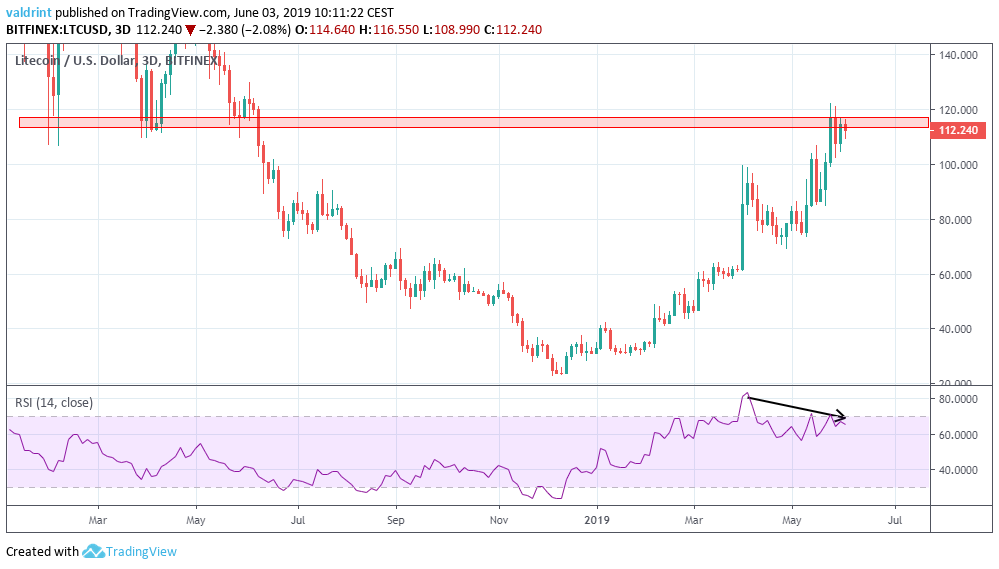
Furthermore, there is bearish divergence developing in the RSI. In this timeframe, this has not occurred since August 2017.
The use of this indicator makes it unlikely that the Litecoin price (LTC) will break out above this area. Even if it does so, we believe it will not occur during this first attempt. Rather, price decreases are likely to occur even if only in the short-term.
One possible pattern of how they will materialize is outlined below using Elliott Wave theory:
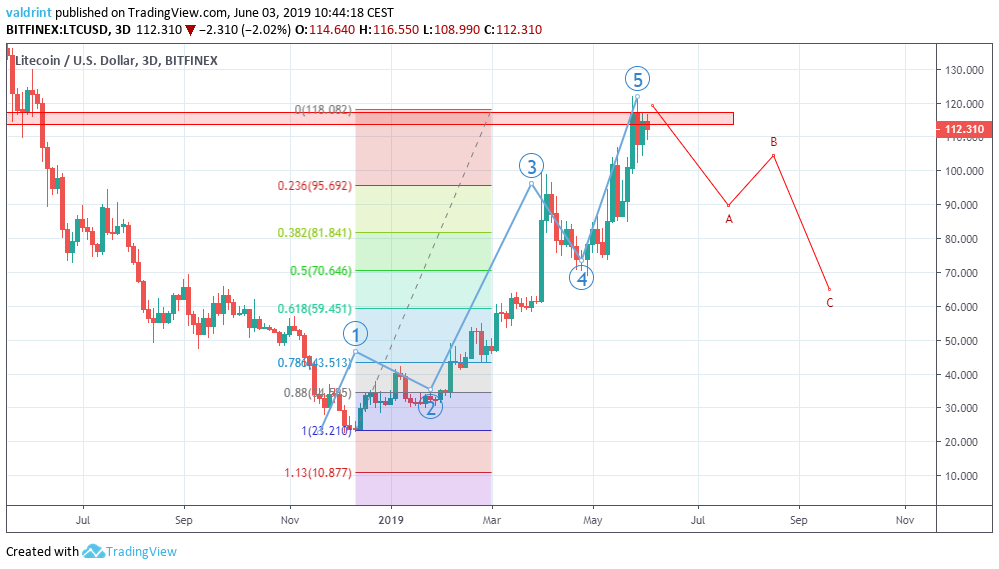
However, the pattern of decrease is a very broad hypothesis of how the Litecoin price (LTC) will decrease. It is still too early to predict the exact price movements of this possible move.
Nevertheless, we believe a short-term decrease is inevitable.
If it does occur, what is the closest level that will provide short-term support?
Finding Long-Term Support
A support area is traced for LTC/USD below. If the price breaks down from the short-term channel, it is likely to provide reversal.
The closest support area is found near $103. We believe that the Litecoin price (LTC) will break down from the channel and eventually reach this area.
Summary
Based on this analysis, it is likely that the price will eventually break down from the horizontal channel.
Do you think the price of LTC will reach the support area? Let us know in the comments below.
If you’re interested in 2019 and 2020 price predictions for Litecoin in dollars, click on the blue button below
Disclaimer: This article is not trading advice and should not be construed as such. Always consult a trained financial professional before investing in cryptocurrencies, as the market is particularly volatile.


