
On July 16, 2019, the Litecoin (LTC) price reached a low of ₿0.00799. An upward move ensued. The price reached a high of almost ₿0.01 the next day. After a slight decrease, similar highs were reached on July 25 and 31.
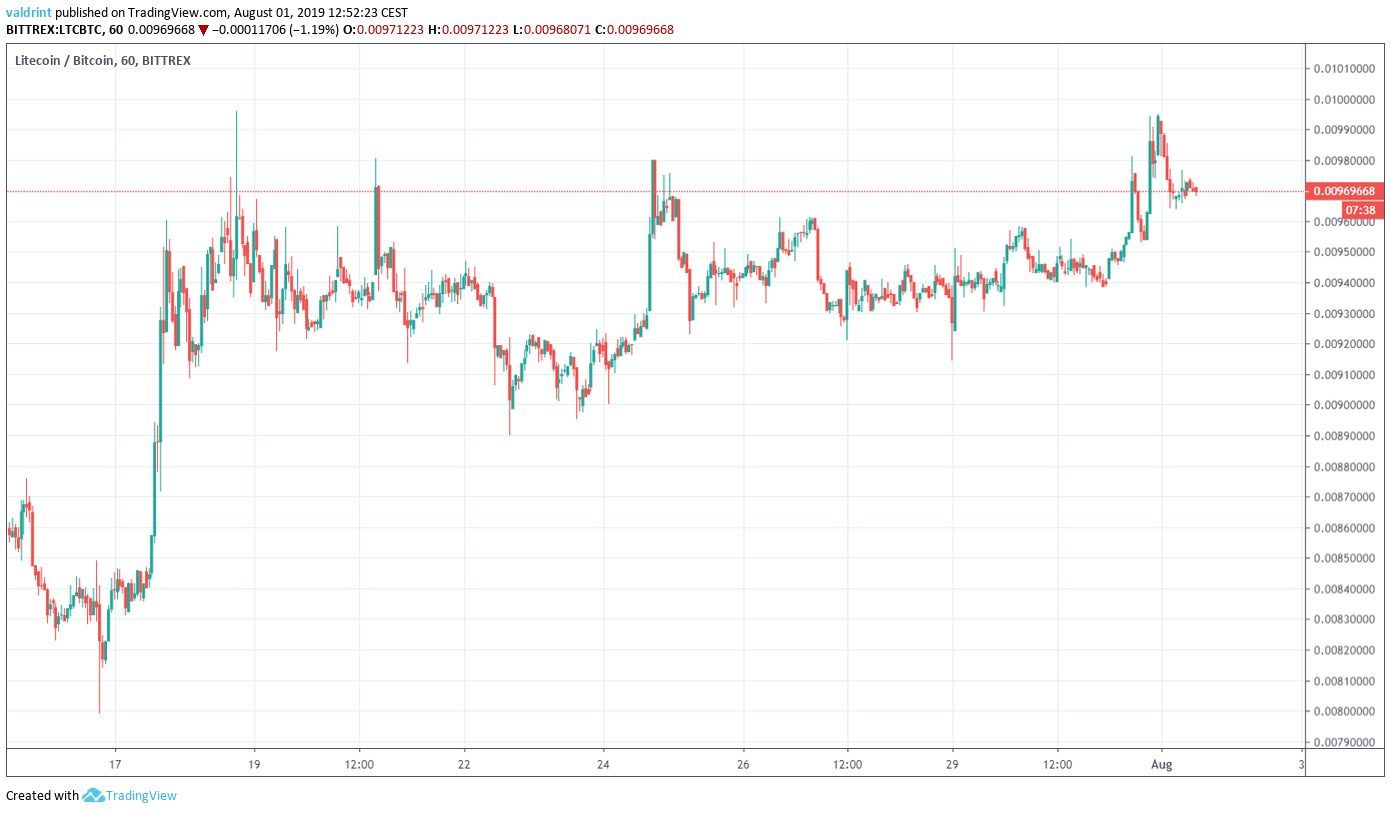
Will Litecoin break out above ₿0.01? Continue reading if you want to find out.
For our previous analysis, click here.
If you would like to trade cryptocurrencies quickly, securely, and with a simple registration process via our partner exchange, follow this link to sign up for free on Xcoex!
For those of you who like images and would prefer a video analysis, click below:
https://www.youtube.com/watch?v=iHZdlfhJpRM
Litecoin Price: Trends and Highlights for August 1
- LTC/BTC is trading inside an ascending triangle.
- It is following a long-term descending support line.
- Daily moving averages have made a bullish cross.
- There is resistance at ₿0.01 and ₿0.011.
Current Pattern
Since reaching a high on July 18, the Litecoin price has been trading inside the ascending triangle outlined below.
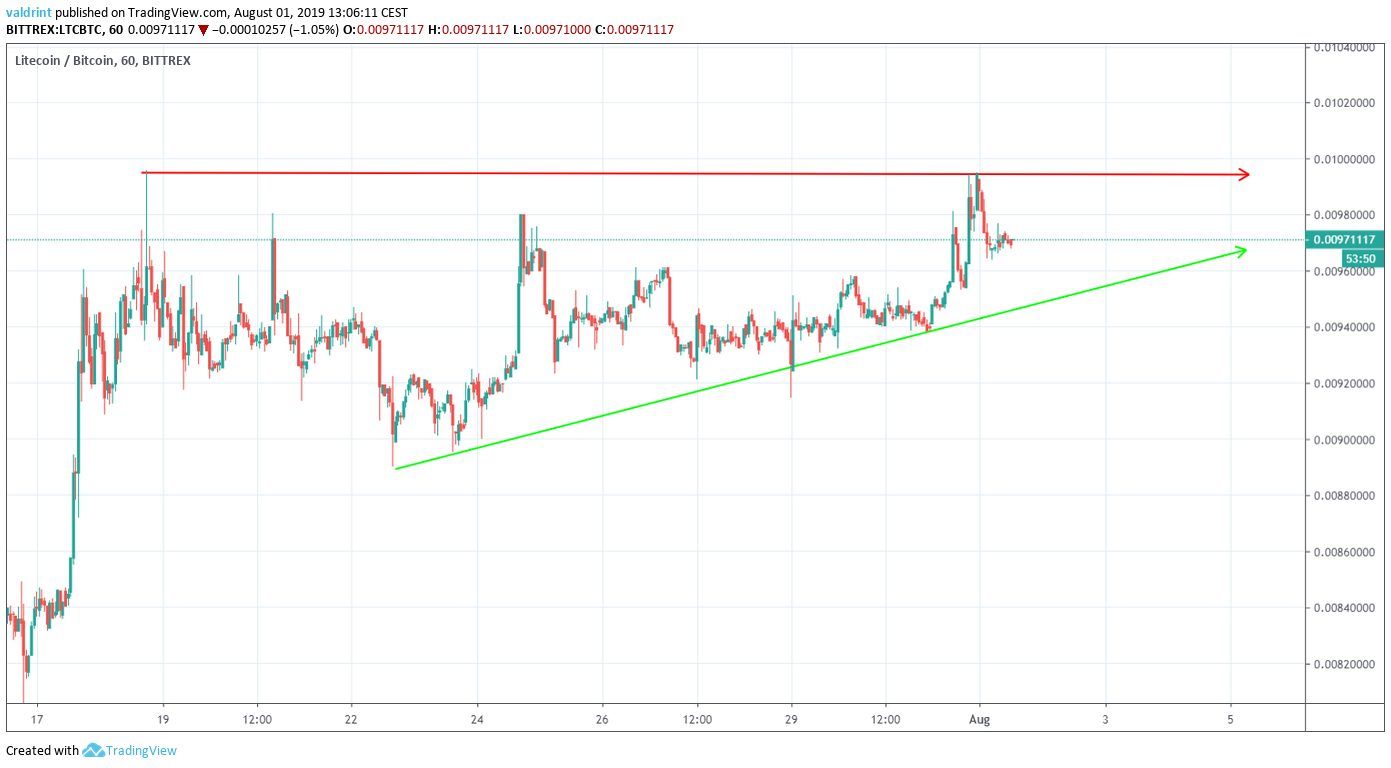
However, the resistance line has only been touched twice. However, due to recent price movement, LTC should face resistance around the ₿0.01 area.
Since the ascending triangle is considered a bullish pattern, a breakout seems more likely.
Additionally, since it is occurring after an upward move, it is very likely that it will act as a continuation pattern.
Let’s take a look at a longer-term time-frame in order to confirm our hypothesis.
Descending Support Line
A look at the daily time-frame shows that LTC has been following a descending support line since the beginning of April 2019.
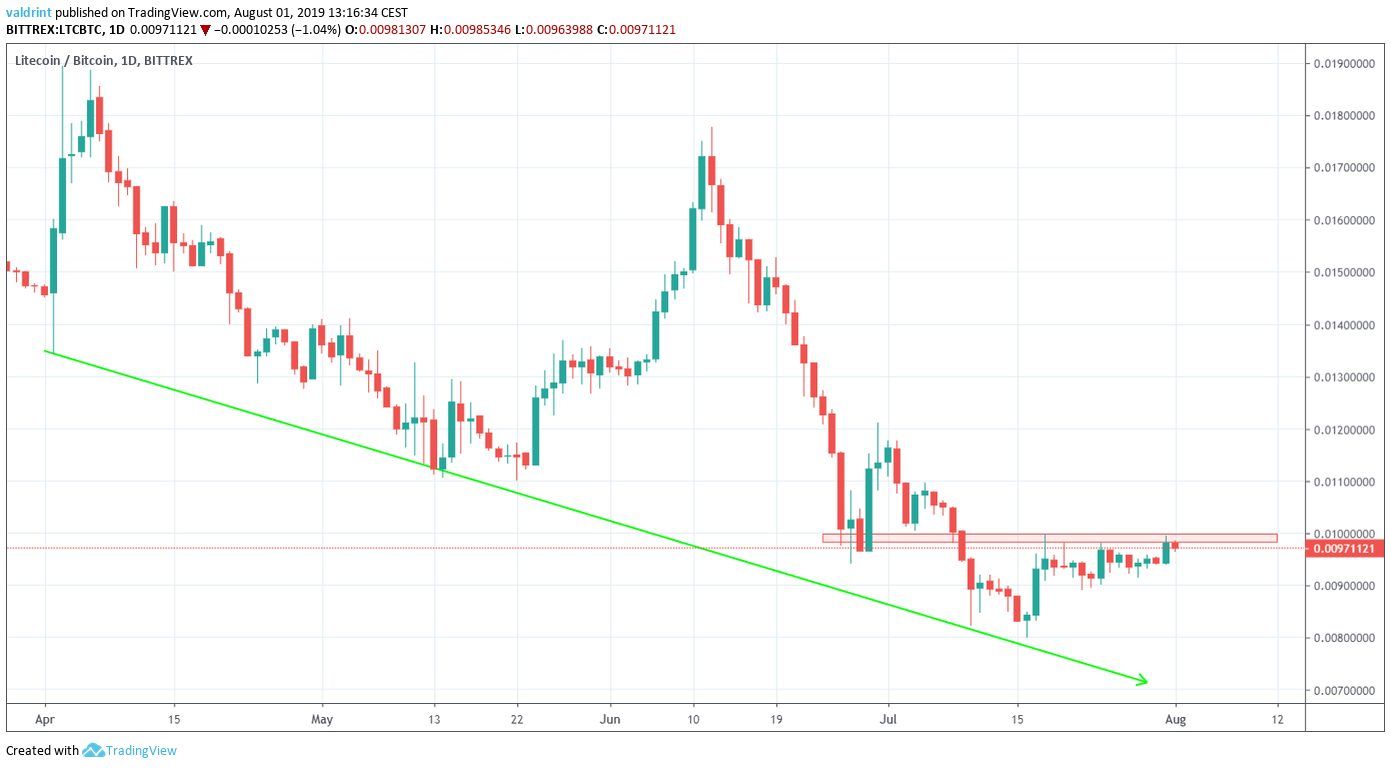
On July 16, it touched the support line and began an upward move.
Also, we can see that there is a resistance area at ₿0.01, coinciding with the horizontal resistance line of the triangle.
A look at the moving averages (MA) and the MACD suggests that the LTC price has begun an uptrend.
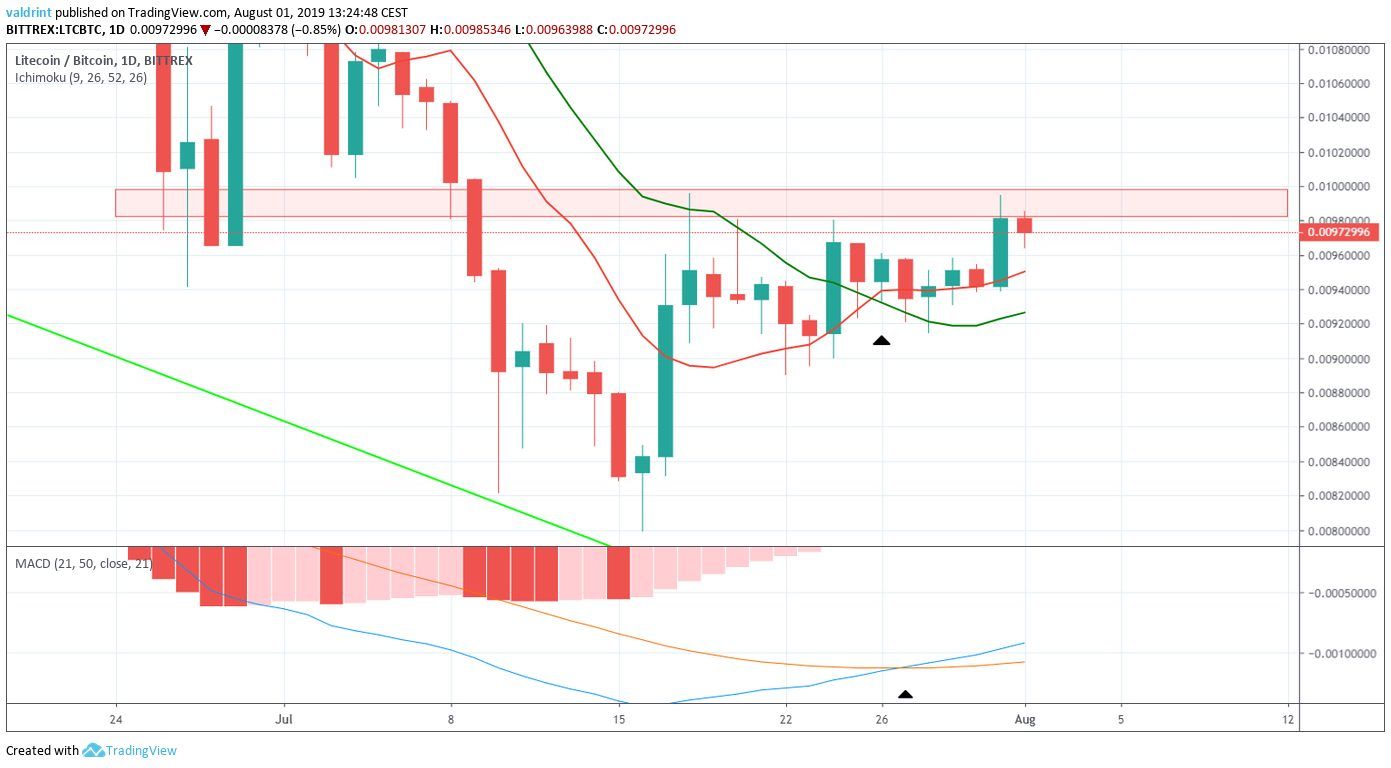
A bullish cross occurred on July 26. It was preceded by a bullish cross in the MACD a day earlier.
Since then, the Litecoin price has been trading above both MAs.
We have established that LTC is likely in an uptrend.
Now, let’s go back to a short-term outlook to see when it will move above resistance.
Future Movement
A look at the six-hour time-frame gives a similar sentiment to the daily one.
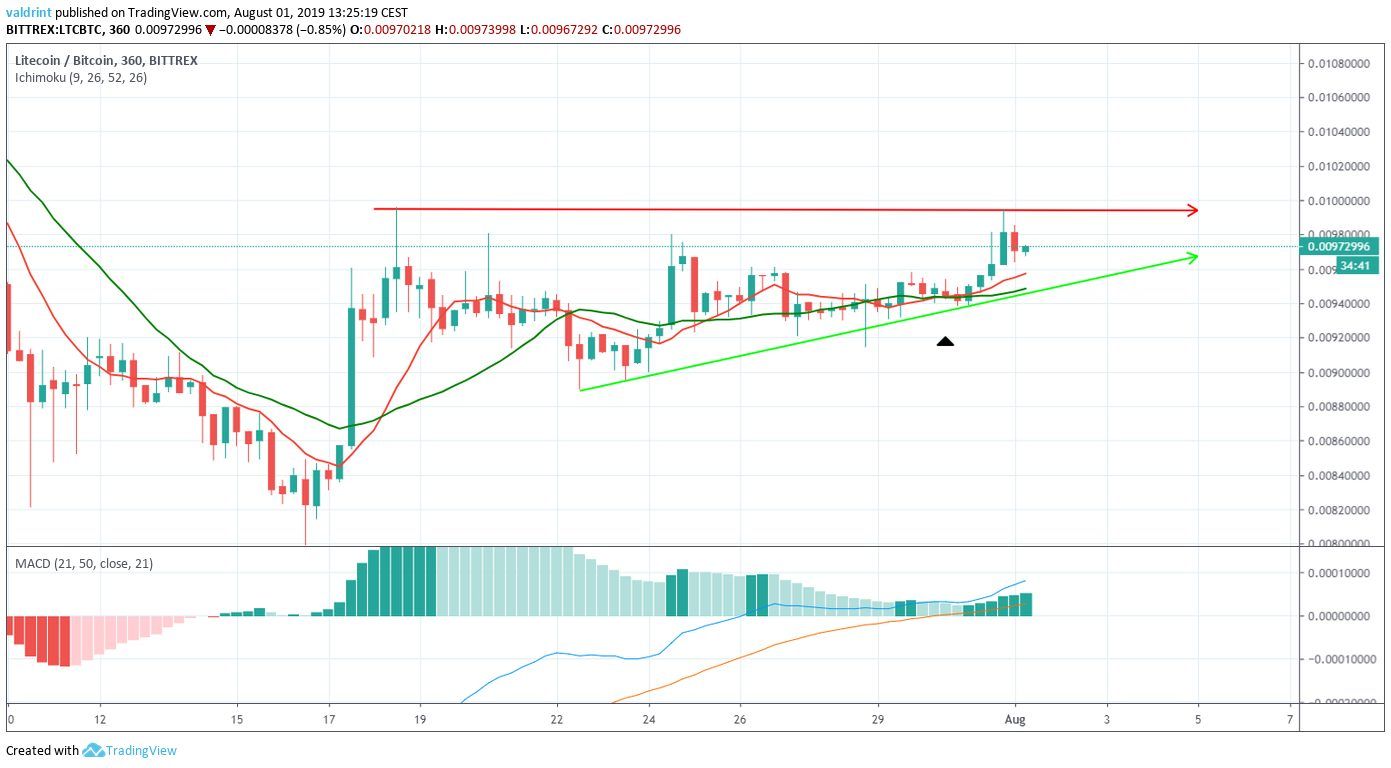
A bullish cross between the 10- and 20-period MAs transpired on July 30.
Furthermore, the MACD is in positive territory, having previously made a bullish cross.
Combined with our previous analysis, this makes us believe that the LTC price is likely to break out soon.
If it does, one resistance area is outlined below.
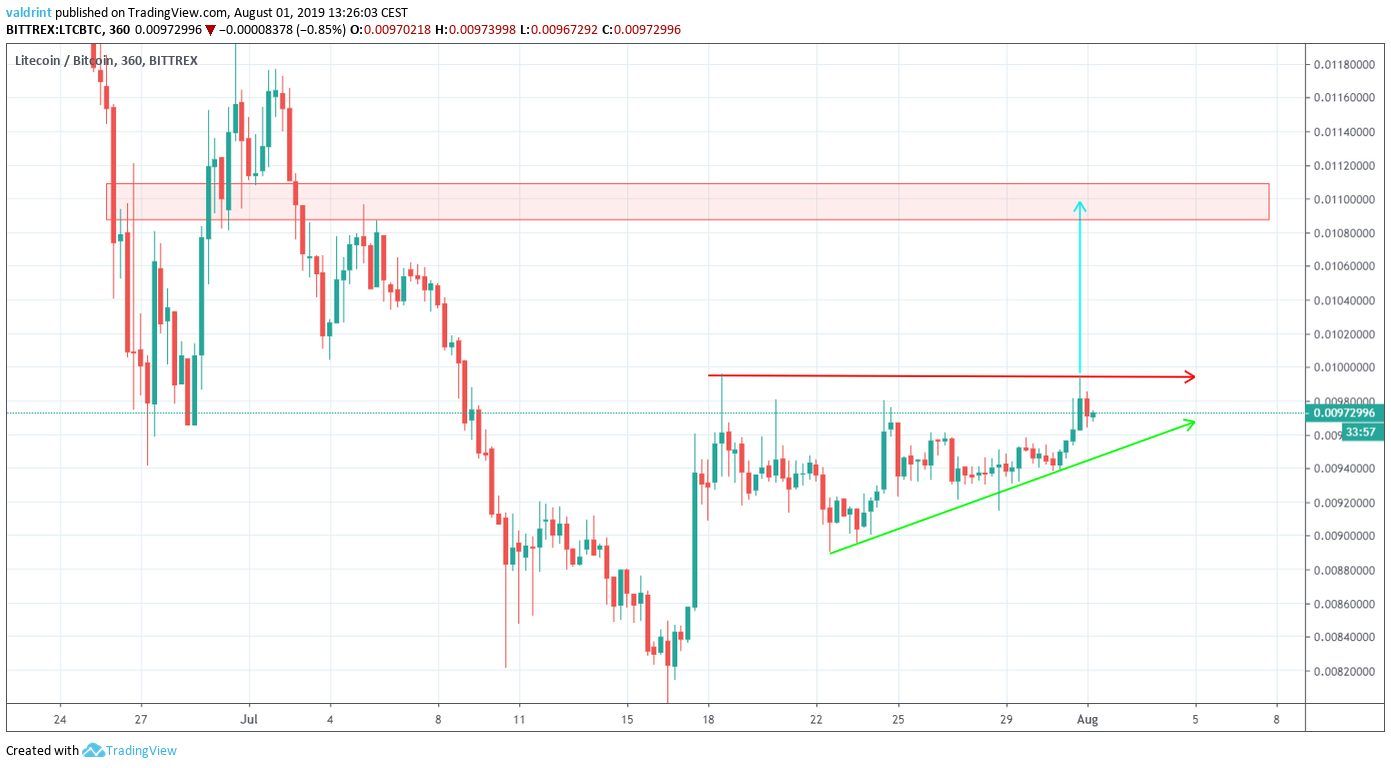
It is found at ₿0.011.
The same target is given if we project the height of the triangle to the breakout point (blue arrow)
Litecoin Price Summary
The Litecoin price is trading inside an ascending triangle.
According to our analysis, it is likely to break out and reach the resistance area outlined above.
Do you think Litecoin will break out from the ascending triangle? Let us know your thoughts in the comments below.
Disclaimer: This article is not trading advice and should not be construed as such. Always consult a trained financial professional before investing in cryptocurrencies, as the market is particularly volatile.
Images are courtesy of TradingView.
