


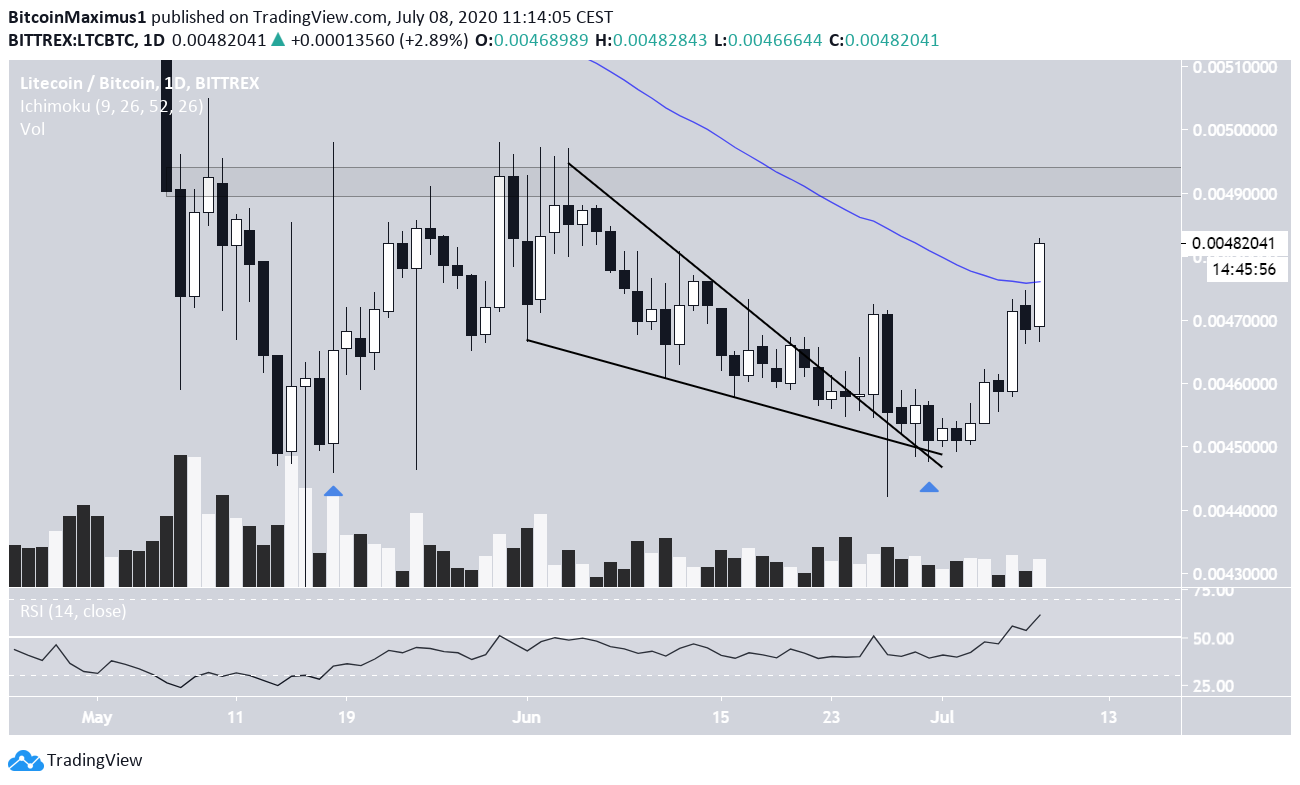
On June 25, the Litecoin (LTC) price broke out from a descending wedge. After retracing for a week, the price began an upward movement that is still ongoing.
The Litecoin price had been trading inside a descending wedge since June 1. The price broke out from the wedge on June 25 amid a bullish engulfing candlestick. However, the price decreased considerably the next day.
Litecoin Catches a Bounce
This decrease also completed a double-bottom pattern relative to the price on May 18.
Afterward, LTC began an upward move that is still ongoing. Today, the price moved above the 50-day moving average (MA), even though it has yet to reach a close above it.
The closest resistance area is found at ₿0.00492.
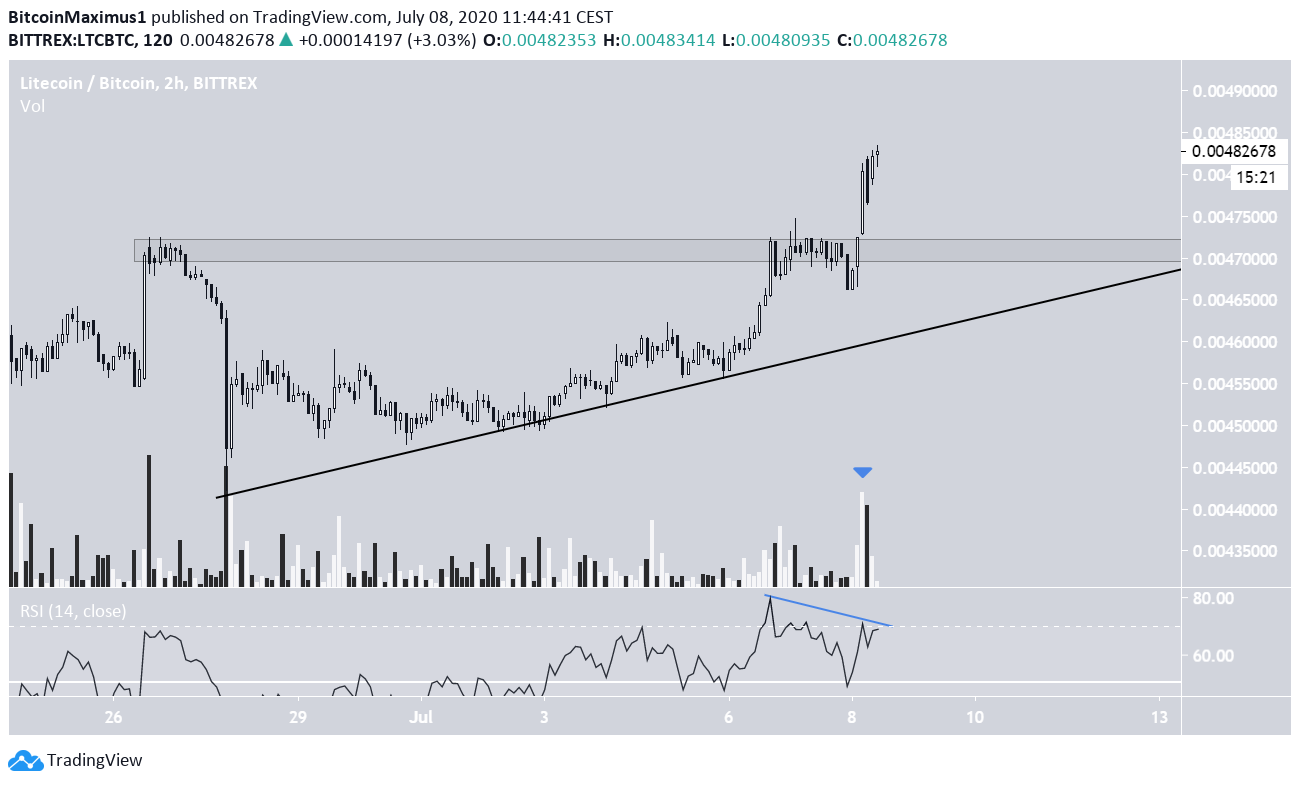
The two-hour chart reveals that LTC has been following an ascending support line since the upward move began. In addition, it shows that the price has broken out from the minor ₿0.0047 resistance area.
There is some bearish divergence developing in the RSI, which indicates that the move has begun to lose its strength. However, volume was the highest during the most recent bullish candlestick, negating some of the divergence.
Therefore, it would make sense for the price to continue increasing towards the resistance area outlined in the previous section, before dropping to the confluence of this support area/line.
Long-Term Movement
Cryptocurrency trader @TheEWguy stated that the correction for Litecoin is likely nearing its end and that he is expecting a bullish reversal to transpire.
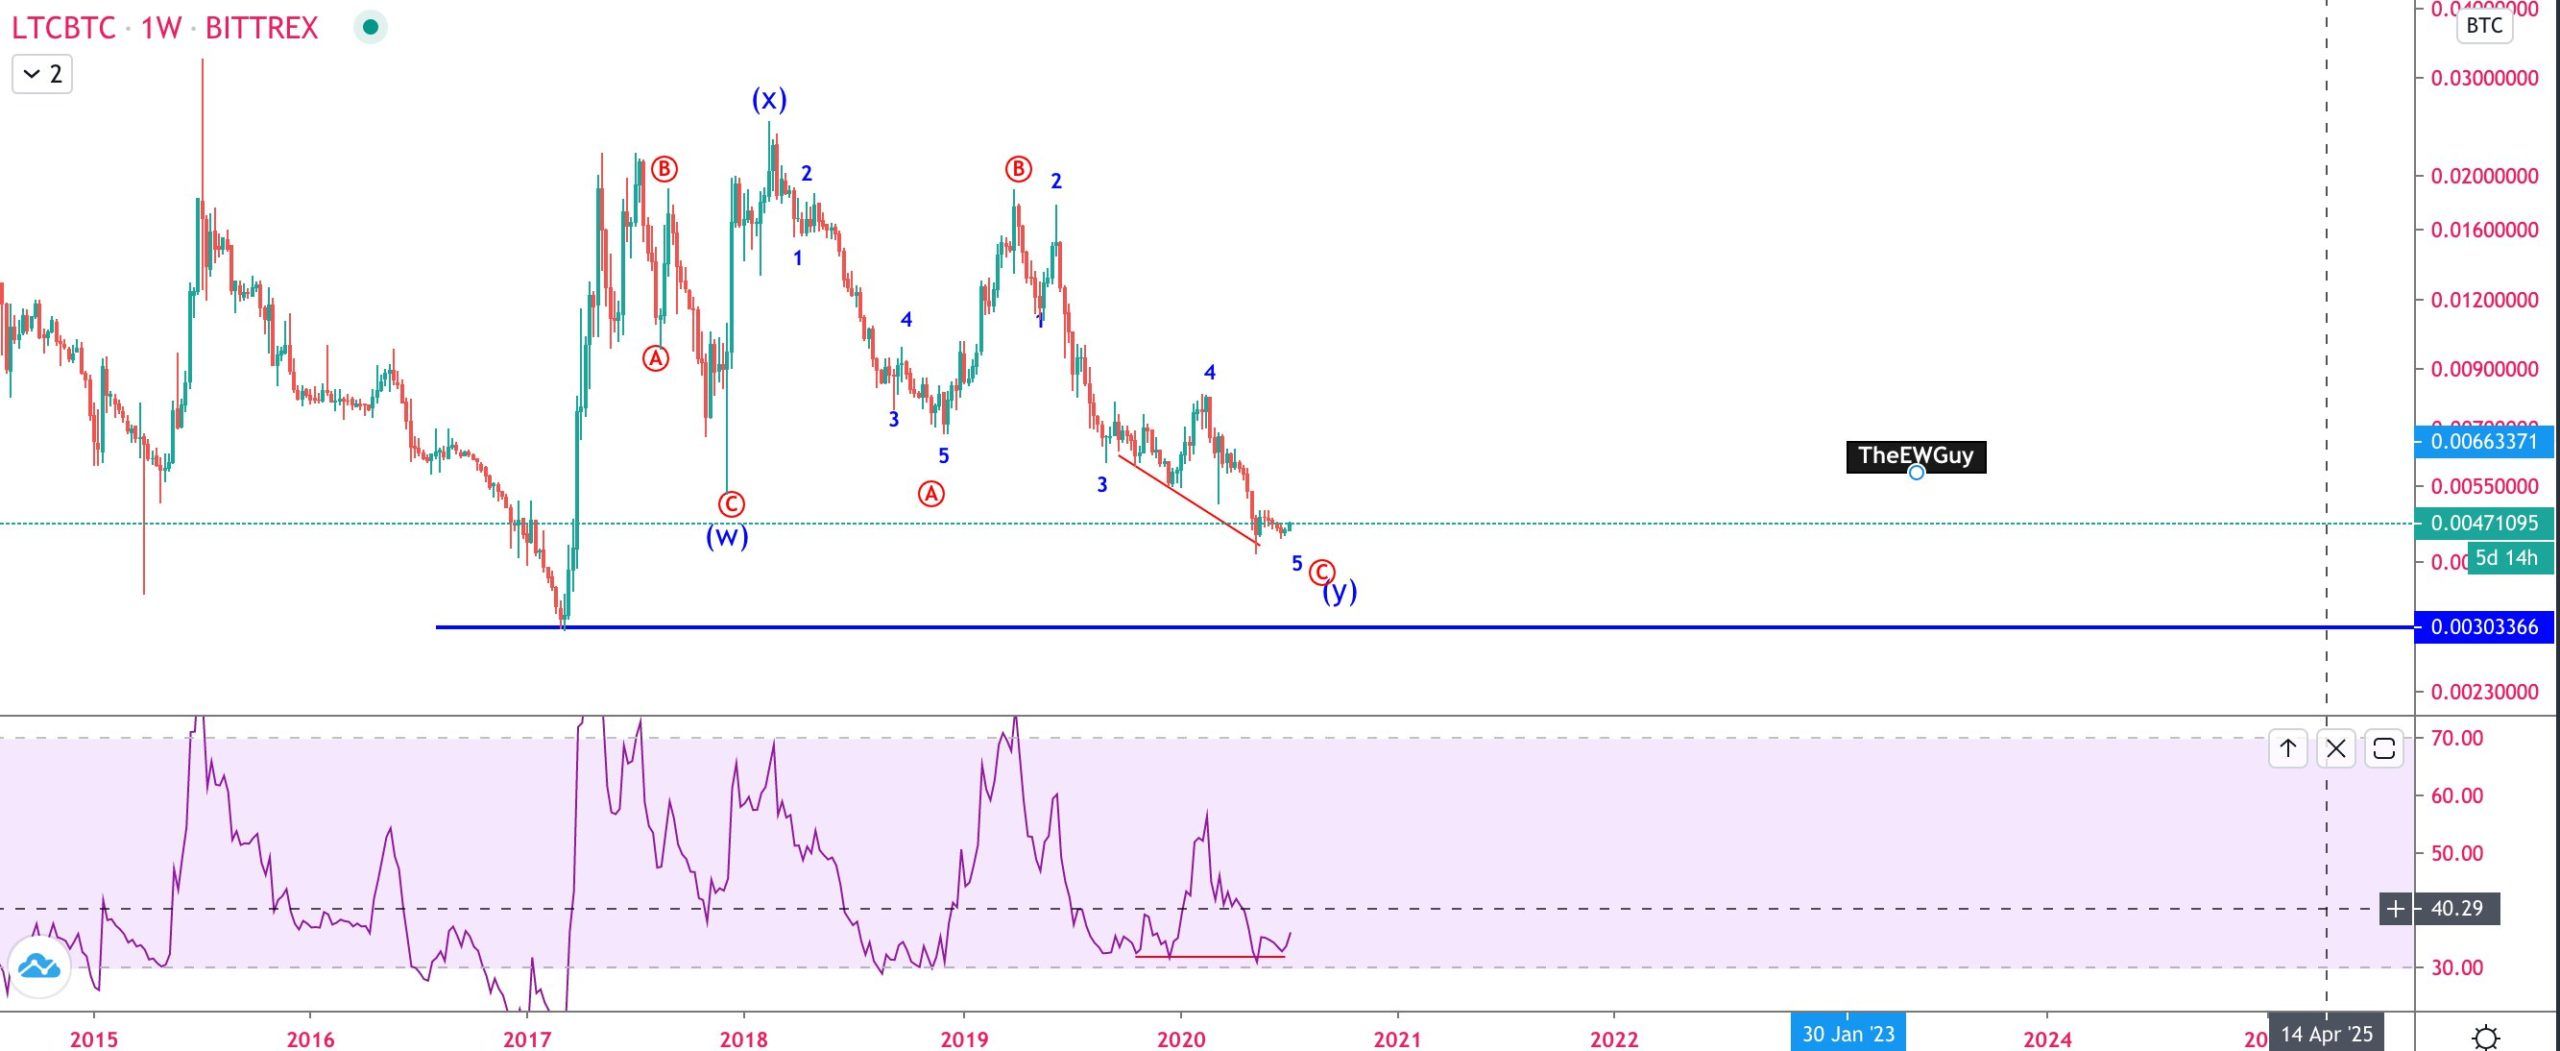
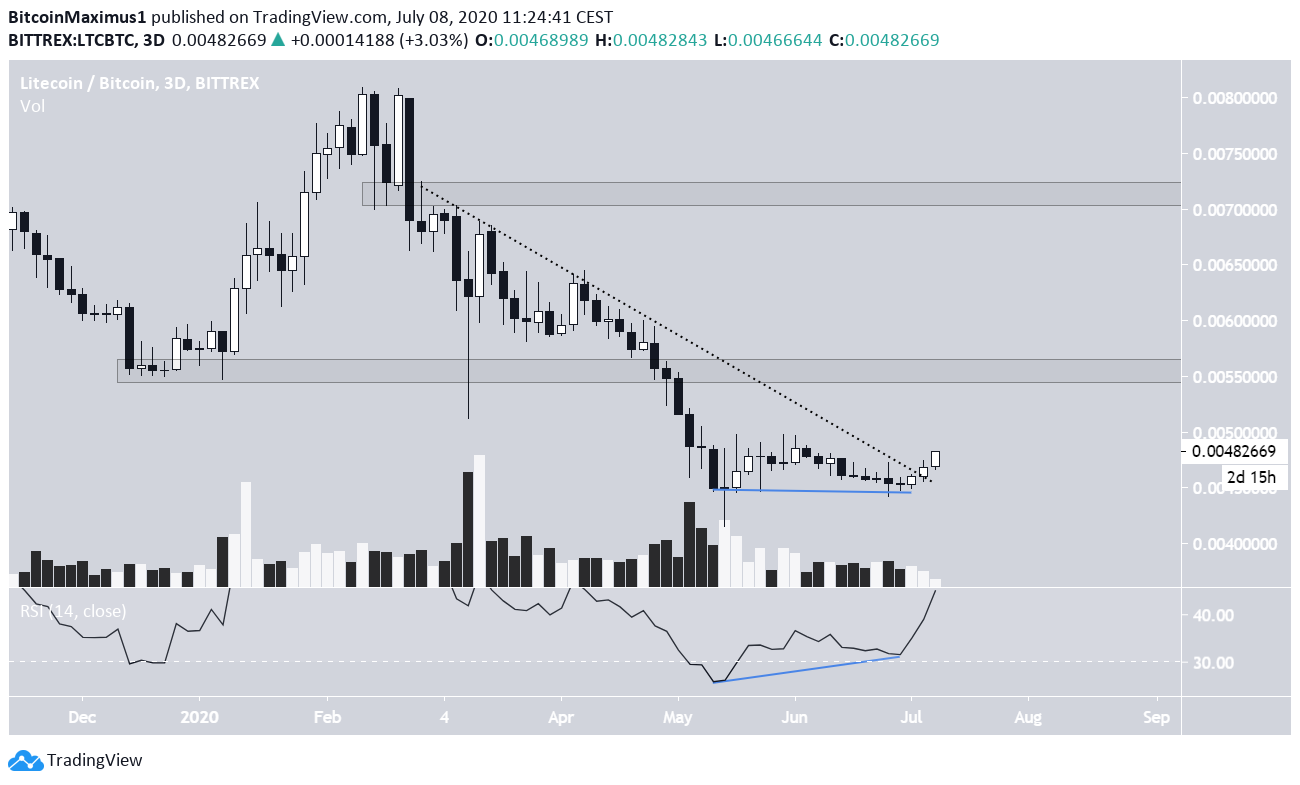
The long-term chart agrees with this assessment since LTC has created a long-term double-bottom combined with a bullish divergence in the RSI. Afterward, the price broke out from a descending resistance line that had previously been in place since Feb 1.
However, we can see the importance of the ₿0.005 resistance area, which previously acted as support. While the price seems almost certain to get there, we cannot yet determine if it will break out, especially on the first try.
If successful in breaking out, the next resistance area would be found at ₿0.0072.
To conclude, the Litecoin price has possibly begun a bullish trend. However, due to the considerable overhead resistance left to clear, this trend is not yet confirmed.


