


The Bitcoin (BTC) price has been decreasing since it reached a high of $9,379 on July 7.
Today, it broke out from a descending wedge, but could not sustain the higher prices.
Bitcoin Short-Term Breakout
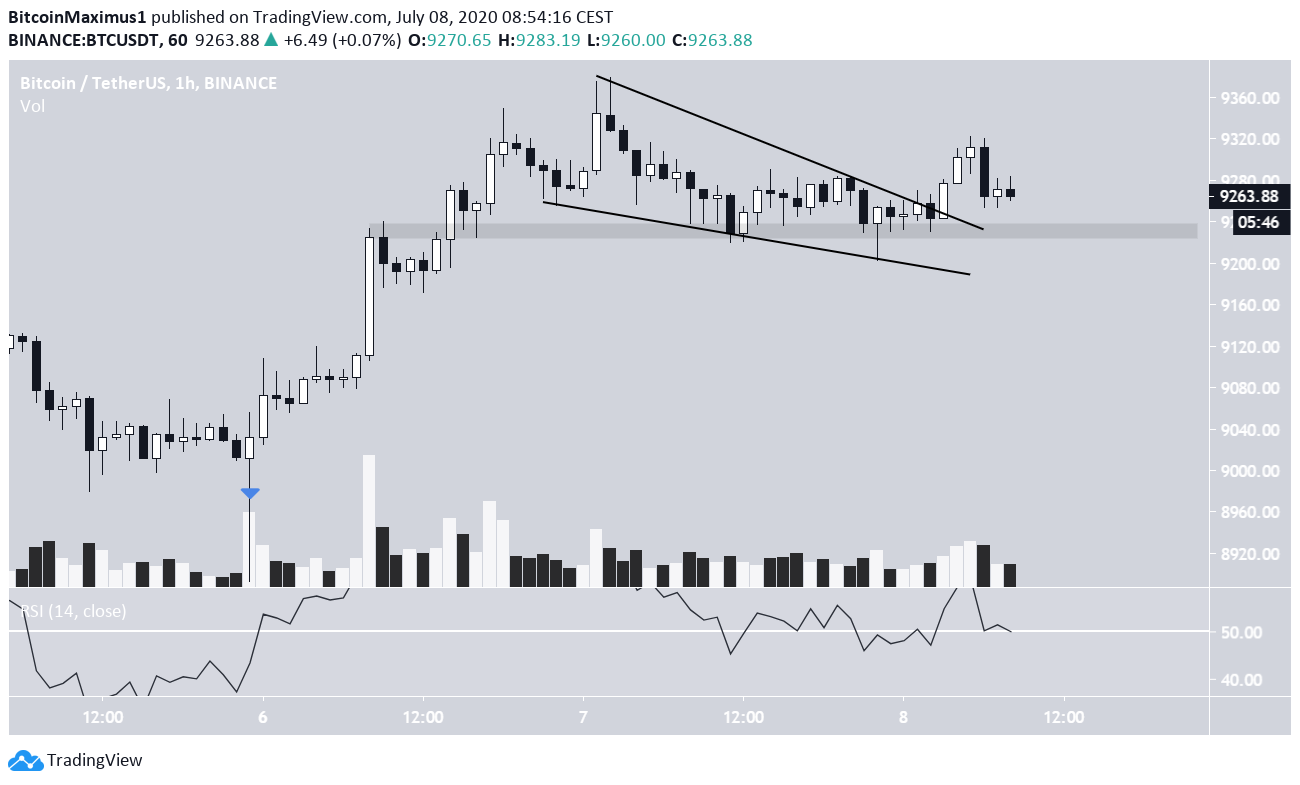
The hourly chart for BTC reveals that the price has been decreasing since a high of $9,379 reached on July 7. The decrease transpired in a descending wedge until the price created a hammer candlestick above the minor $9,250 support area and broke out.
However, the breakout transpired with barely above-average volume, and the price created a bearish engulfing candlestick as soon as it reached $9,320.
If the price were to decrease below the $9,250 support area, it would likely cause an RSI decrease below 50. This would likely mean that the breakout could not be sustained, BTC has begun a short-term bearish trend, and will be heading lower.
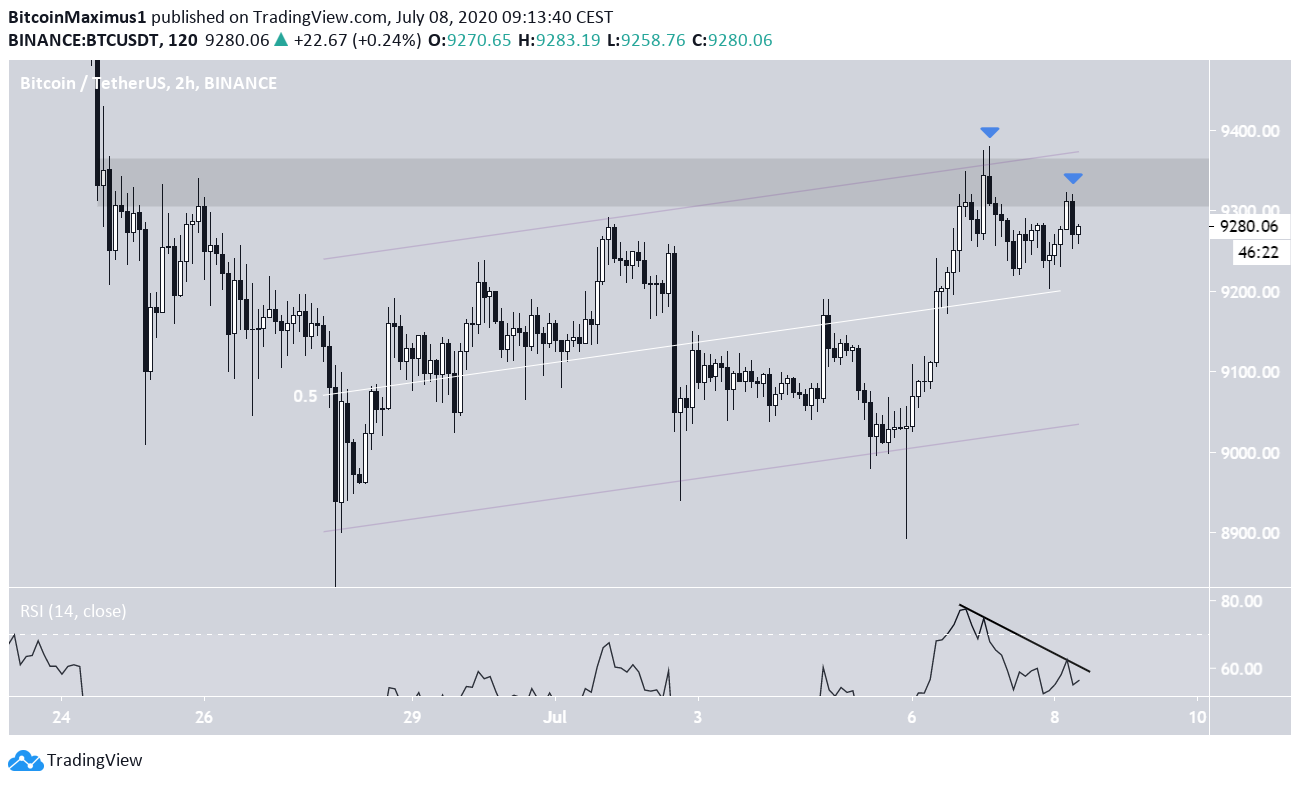
The two-hour chart reveals that the price is trading inside a parallel ascending channel, having been rejected from its resistance line on July 7. The line also coincides with the $9,350 resistance area, which has not been broken since June 25.
After the rejection, the price bounced at the 0.5 Fib level of the channel but created a lower-high afterward. This is the first such high since the rejection.
Furthermore, the RSI has created a descending resistance line, and until the line is broken, the trend is considered bearish. Once the price decreases below the 0.5 Fib line of the channel, the rate of decrease is expected to accelerate.
Long-Term Movement
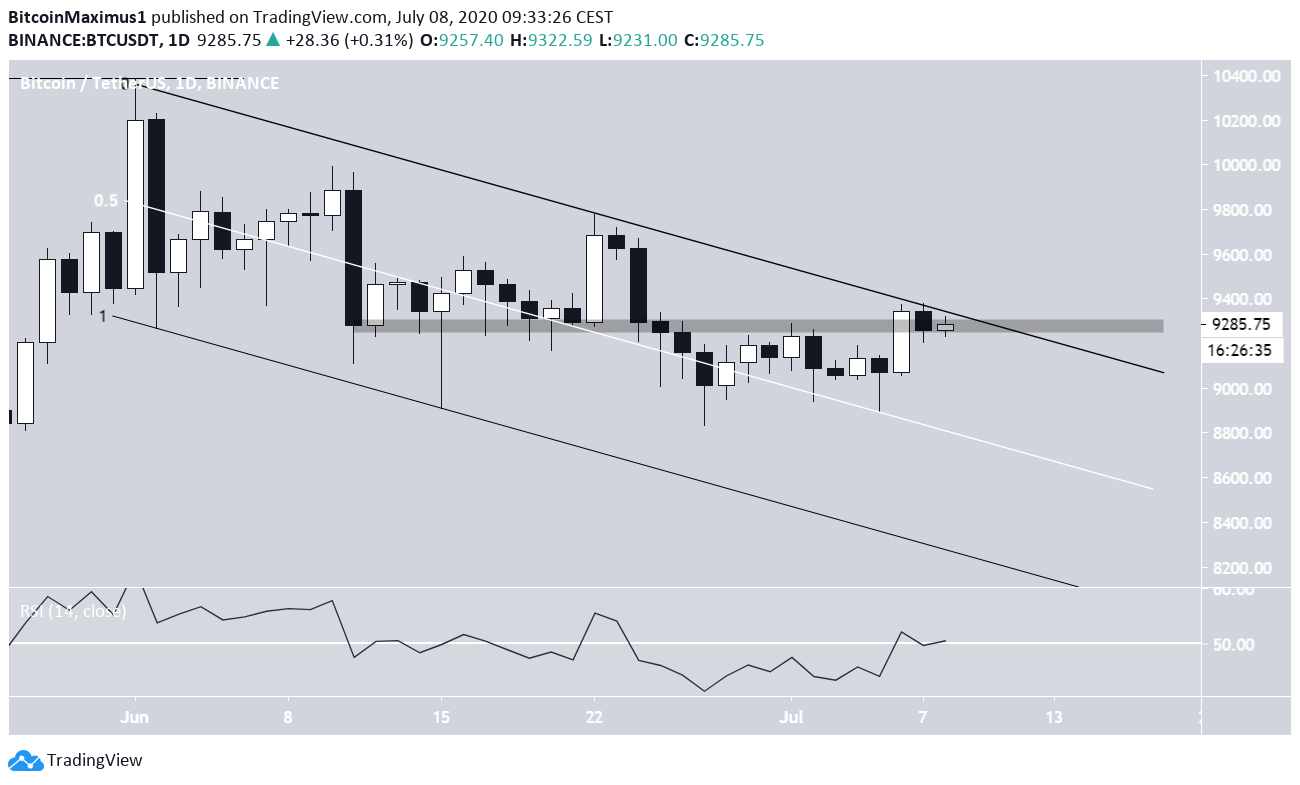
The daily chart reveals that the price has been trading inside a descending parallel channel since a high of $10,387 was reached on June 1. At the time of press, the price was trading very close to the resistance line of the channel, along with the $9,350 resistance area.
The RSI is sitting at 50, meaning that the trend is still undecided.
Due to the reasons from the short-term chart, it’s likely that BTC will get rejected and decrease, moving towards the 0.5 Fib level of the channel near $8,550.
For our previous analysis, click here.


