


The price of Litecoin (LTC) has enjoyed significant increases in 2019. The uptrend began on Dec 2018, when lows near $25 were reached.
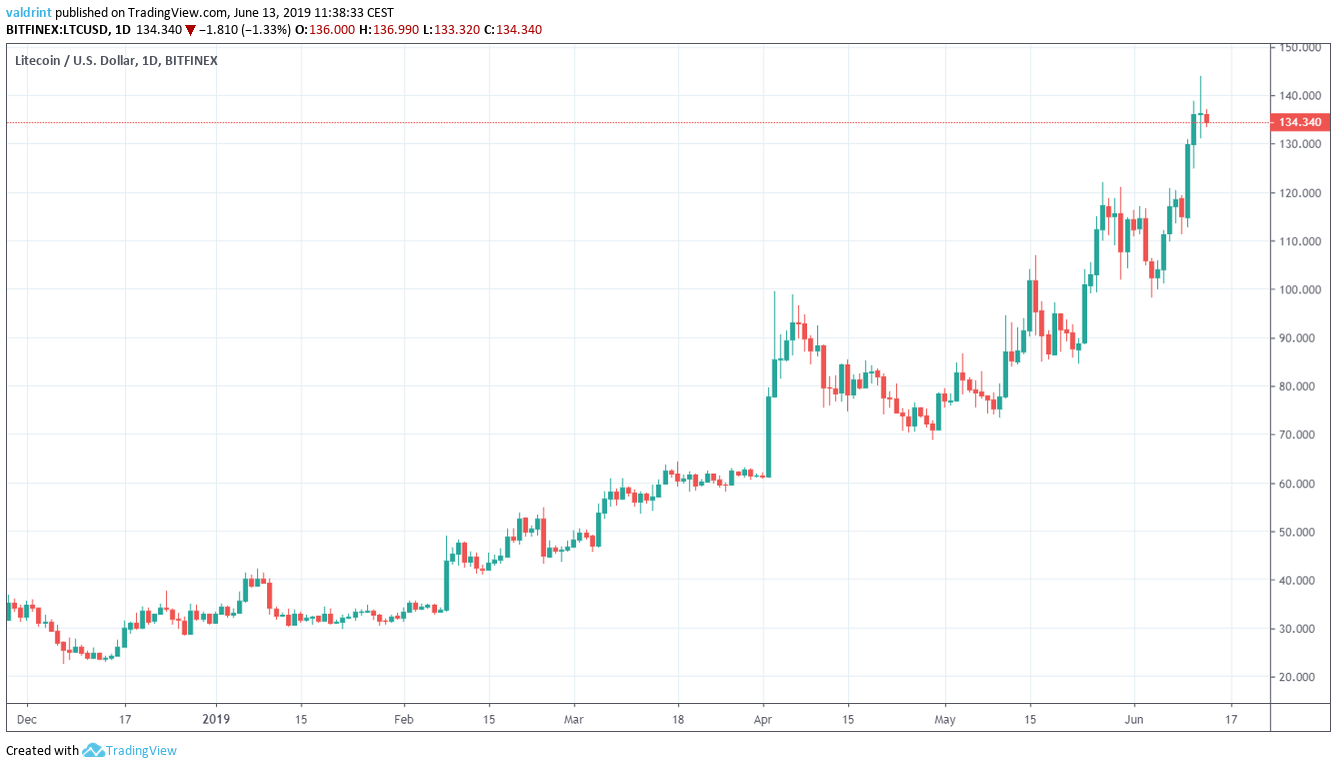
At the time of writing, the Litecoin price had made highs above $140 on June 12.
How long will this uptrend continue? Keep reading below in order to find out. (Click here for our previous analysis.)
Litecoin (LTC) Price: Trends and Highlights For June 13
- The LTC price has been following an ascending support line since Mar 11.
- It is possibly creating an evening star reversal pattern.
- There is a bearish divergence in the RSI.
- The 10- and 20-day moving averages have made a bullish cross.
- Resistance levels are found at $155 and $175.
Current Pattern
Since reaching lows near $55 on Mar 11, the Litecoin price has been following the ascending support line outlined below.
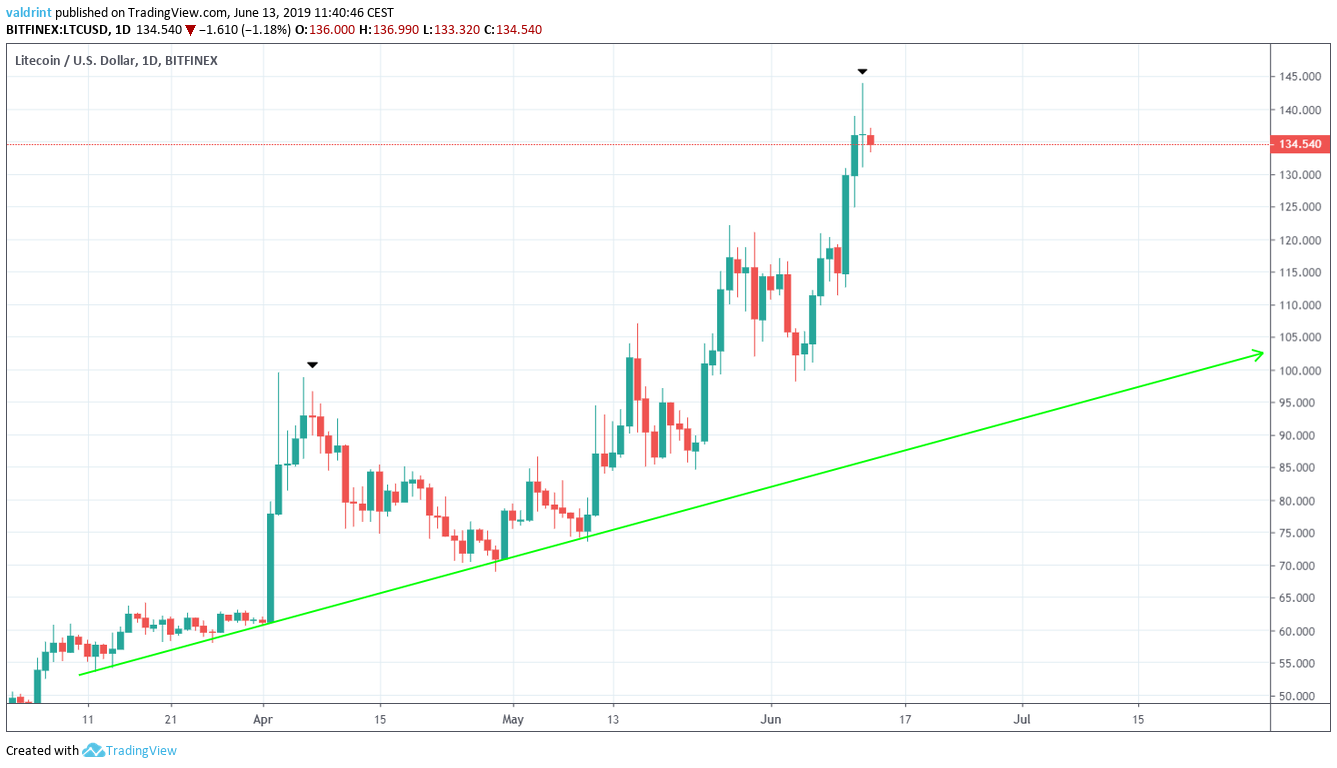
Throughout this period, the Litecoin price has been trading close to the support line with several exceptions. An upward move beginning on Apr 2 took the price significantly above the support area. After a decrease, another upward move which began on Apr 30 did the same.
One similarity between the two upward moves is the creation of Doji candlesticks near the tops; Doji’s have long upper/lower wicks without a significant body. This indicates that the current trend may be nearing its end.
The pattern would gain more significance if the candlesticks succeeding the doji would close below the opening price of the candlestick preceding it. In the case of our current high, a close below $130 would be required for this to occur. It would complete an evening star, which is considered a bearish reversal pattern.
On Apr 3, the ensuing move following the top was a decrease of 31 percent. This decrease took the price to the support line.
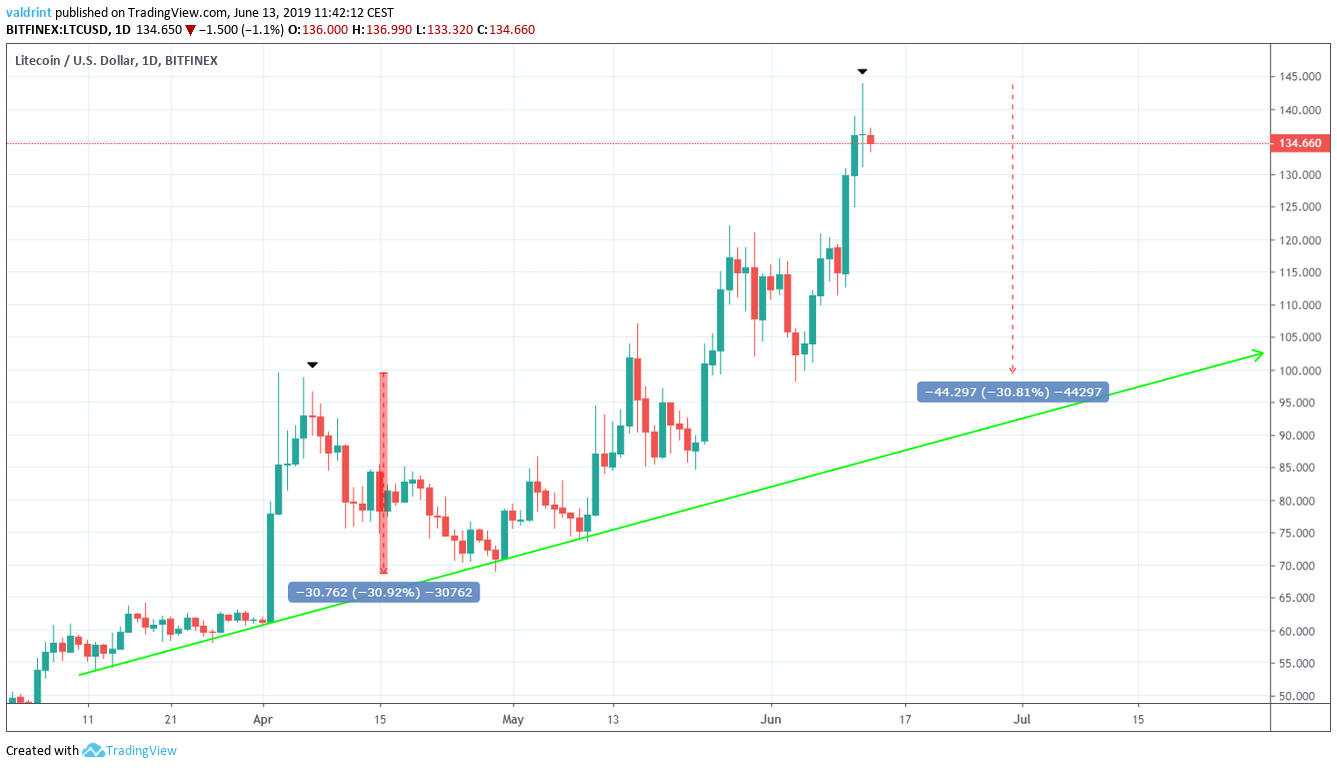
If LTC price movements follow a similar pattern, a decrease of 31 percent would take the price down to the support line.
Do the technical indicators support this possibility?
LTC Price: Technical Indicators
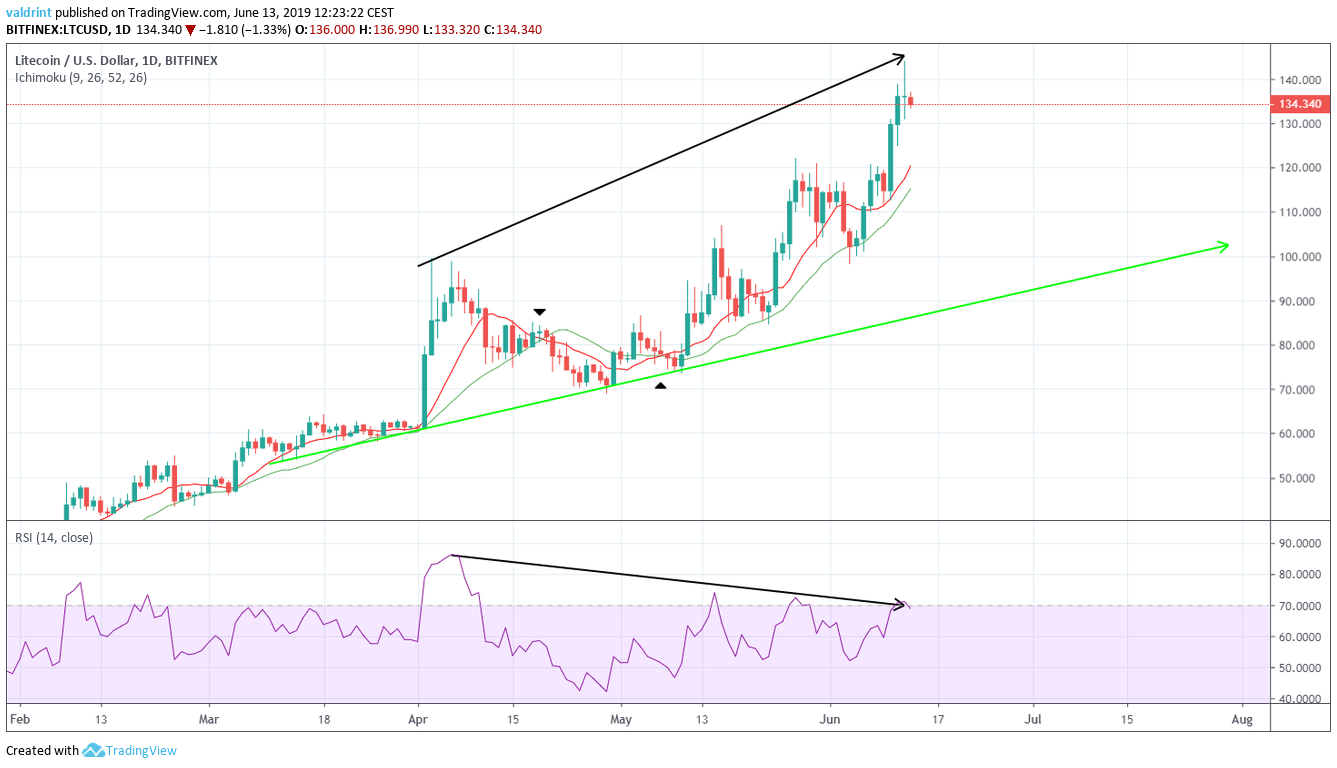
First, we can see that the 10- and 20-period MAs have made a bullish cross on May 9. This is usually an indication that an uptrend has begun. An upward move ensued shortly after and the price is currently trading above both moving averages.
However, there is a very significant bearish divergence developing in the RSI. This is an indication that the current trend may be nearing its end. Furthermore, it gives more significance to the possibility of the evening star pattern which was analyzed in the previous section.
Moving averages are lagging indicators. Thus, a downtrend can be well on its way once a bearish cross occurs. This was especially evident in the previous upward move in April. The Litecoin price had been on a downtrend since Apr 5, but the bearish cross occurred on Apr 18. Therefore, moving averages are usually used for confirming a trend, rather than predicting one.
Reversal Areas
A Fibonacci retracement is used from the high of $184 on May 6, 2018, to a low of $24 on Dec 13.
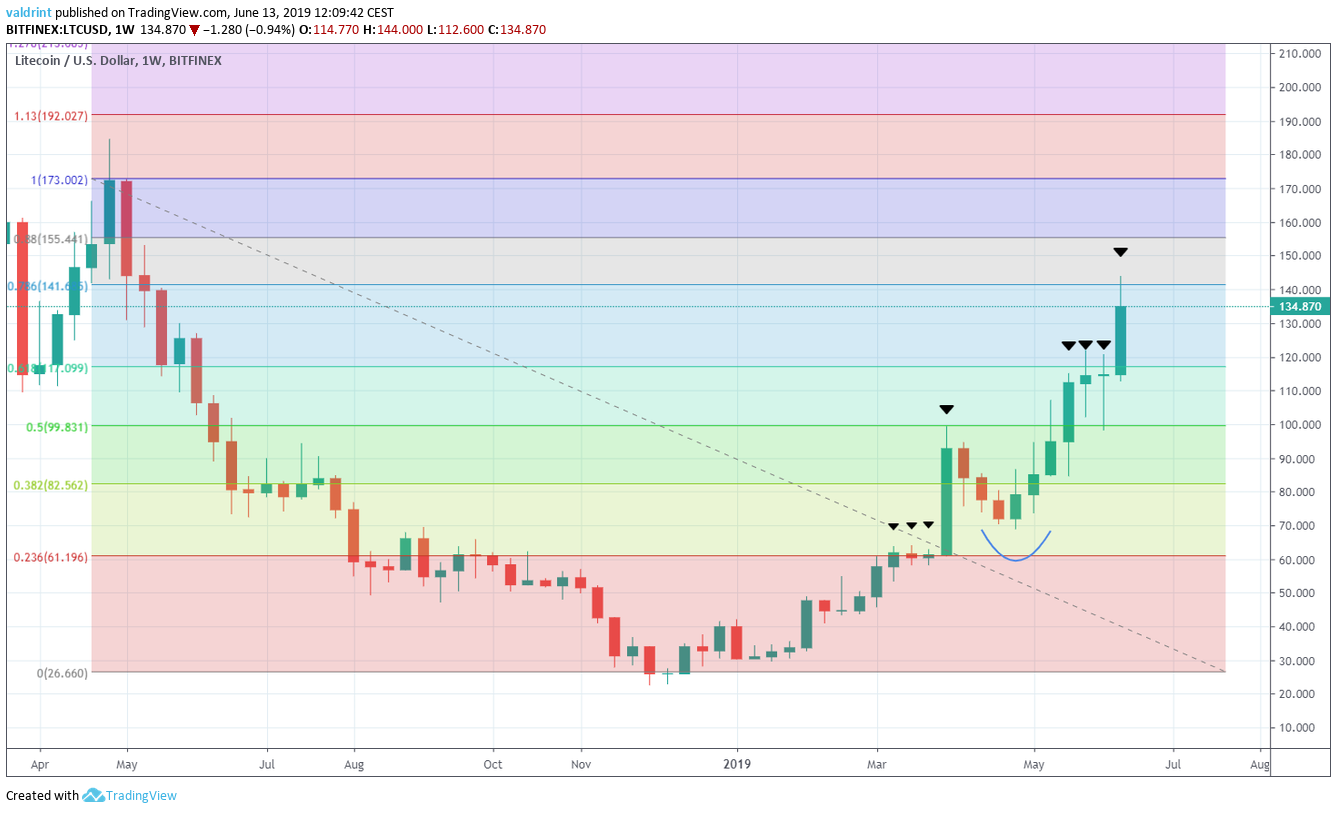
The Litecoin price has reacted to several fib levels. It found resistance at the 0.236 level in March, before the upward move on Apr took it to the 0.5 level, where a reversal began. The ensuing upward move took the price to the 0.618 level. After three weeks of struggling to break out, the price did so this week. It promptly reached the 0.786 level before retracing slightly.
One interesting development is the fact that very few higher lows have been reached. Aside from the one at the end of April, the rest of the upward move has seen the price shoot upward after a few candlesticks of consolidation.
The next resistance levels can be found at $155 and $175.
Will Litecoin’s impending block-reward halving continue to push the LTC price higher? Let us know your thoughts in the comments below!


