
Litecoin (LTC) has been decreasing since being rejected by the long-term $238 resistance area.
Litecoin is expected to consolidate between local highs and lows before eventually breaking out.
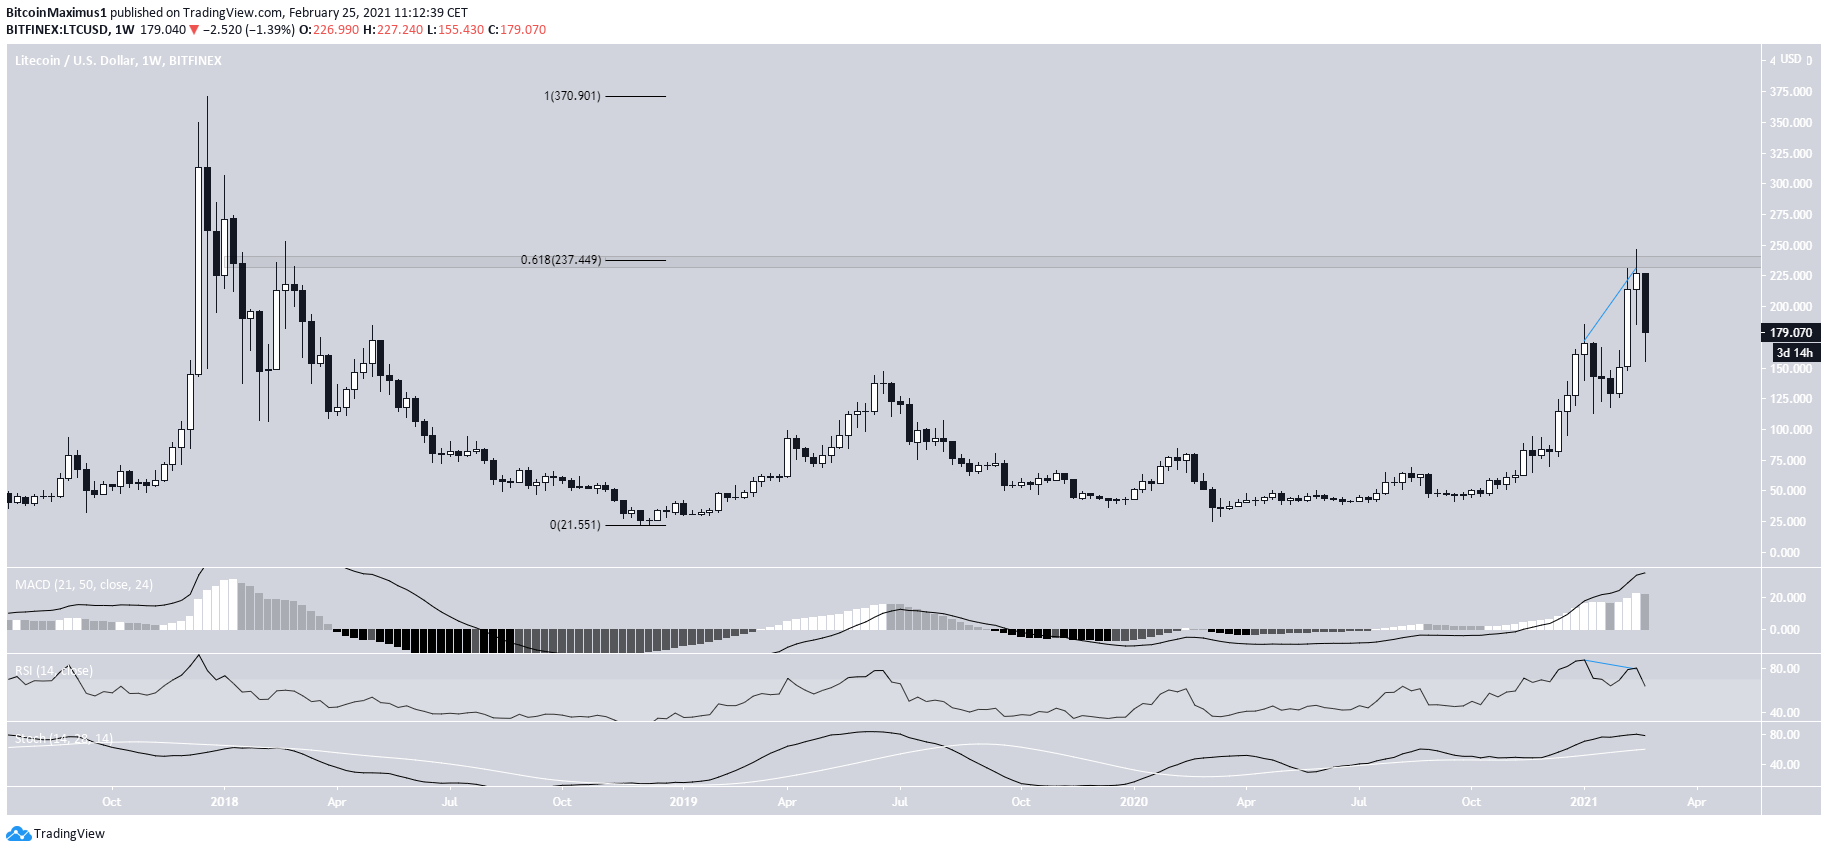
Litecoin Long-Term Levels
The weekly chart shows that LTC has been decreasing since reaching a high of $246.40 on Feb. 20.
The rejection occurred right at the 0.618 Fib retracement level measuring from the all-time high price.
Despite the rejection and subsequent drop, technical indicators are still bullish. Both the RSI and Stochastic oscillator are increasing.
While the RSI has generated a bearish divergence, a drop has already occurred as a result. It’s possible that LTC will also generate a hidden bullish divergence in its next low.
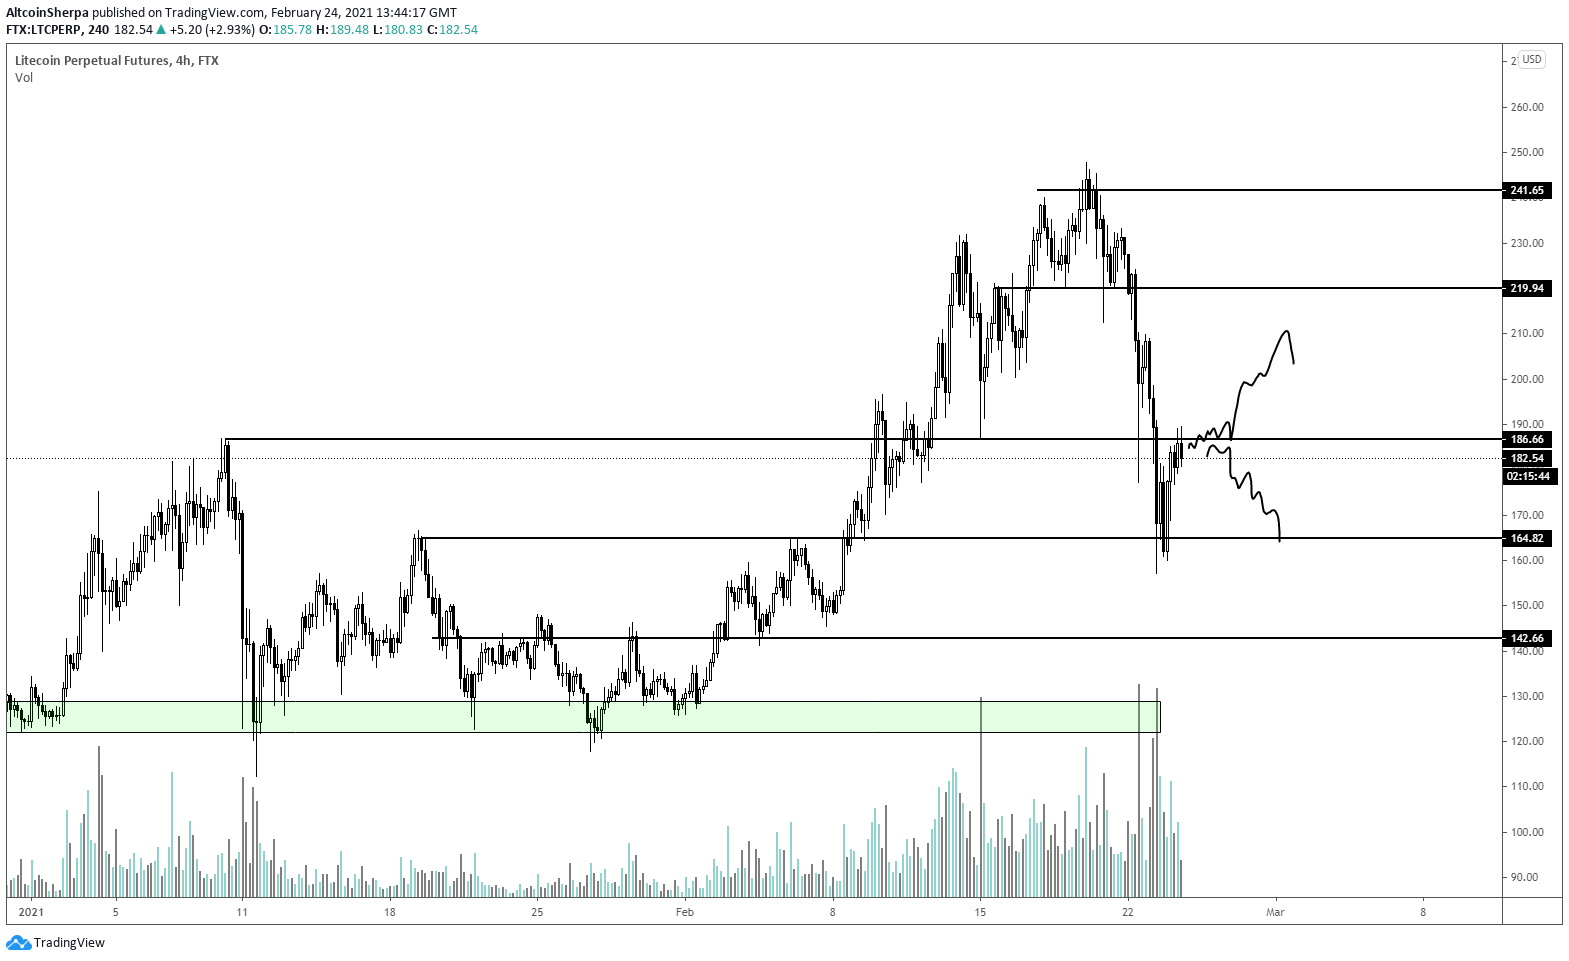
Current Movement
Cryptocurrency trader @Altcoinsherpa outlined an LTC chart, stating that whether or not it’s successful in breaking out above $186 will determine the direction of the next movement.
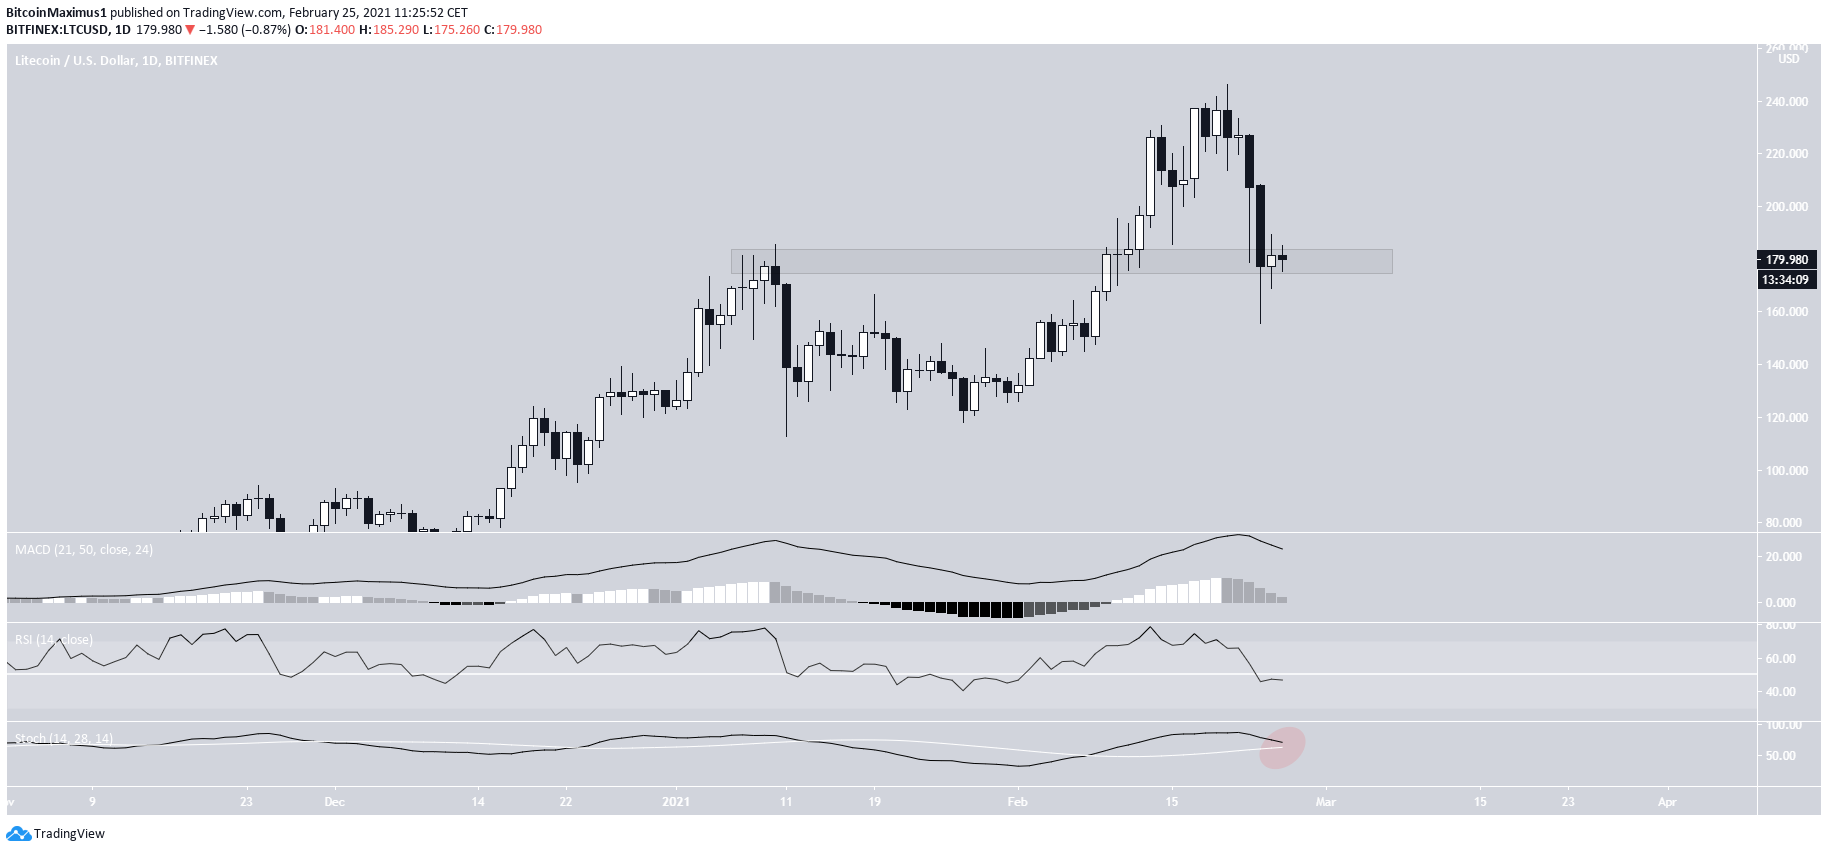
A look at the daily chart shows that LTC is trading inside the $180 area, which previously acted as resistance. While LTC is still in the process of validating it, the area would be expected to act as support.
However, technical indicators are undecided. The RSI has just crossed below 50 and the Stochastic oscillator could make a bearish cross.
Therefore, whether LTC breaks down from or bounces at the $180 area will go a long way in determining the direction of the future trend.
Wave Count
The wave count suggests that LTC has completed an extended wave three (white) of a bullish impulse that began in March 2020.
LTC is likely in wave four. It’s expected to continue correcting before potentially breaking out once more and making an attempt at reaching a new all-time high.
If the correction develops into a fourth wave triangle or a running flat, then it’s possible that LTC has already reached its low.
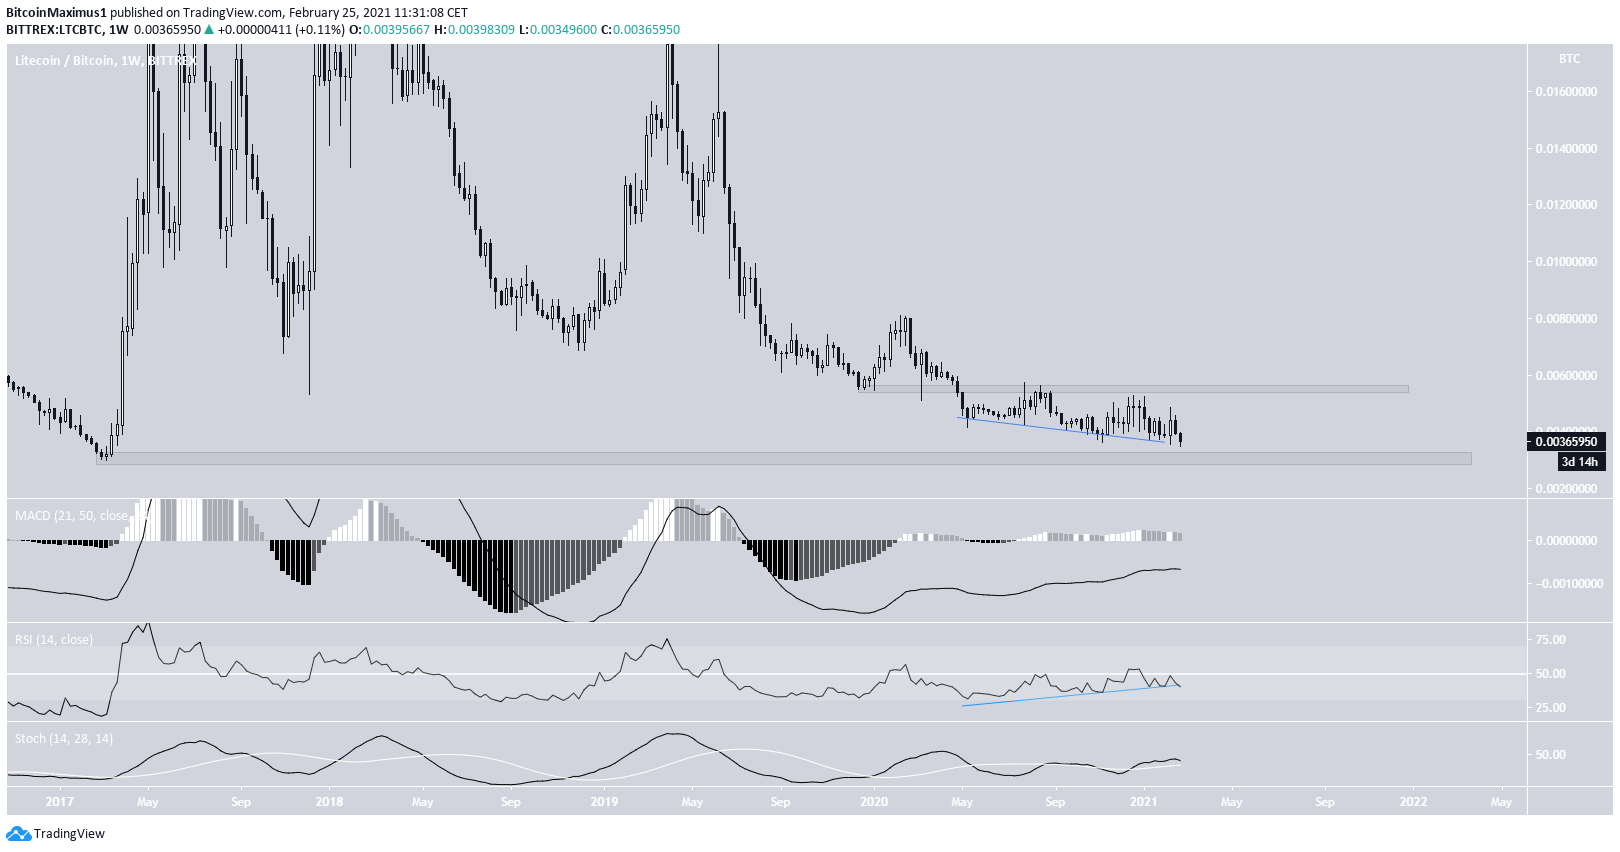
LTC/BTC
The weekly chart shows that LTC/BTC is trading very close to its all-time low levels of ₿0.003.
Technical indicators are showing bullish reversal signs, evident by the bullish divergence in the weekly RSI. However, the trend cannot be considered bullish until LTC reclaims the previous breakdown level at ₿0.0055.
Doing so would confirm that the long-term trend is bullish.
Conclusion
Litecoin is expected to continue consolidating before eventually breaking out.
While LTC/BTC is showing strong bullish reversal signs, the long-term trend cannot be considered bullish until it manages to break out above ₿0.005.
For BeInCrypto’s latest Bitcoin (BTC) analysis, click here
