


After failing to sustain its upward movement, Litecoin (LTC) has fallen back to a long-term horizontal support level. A breakdown below this level could cause a rapid fall below $100.
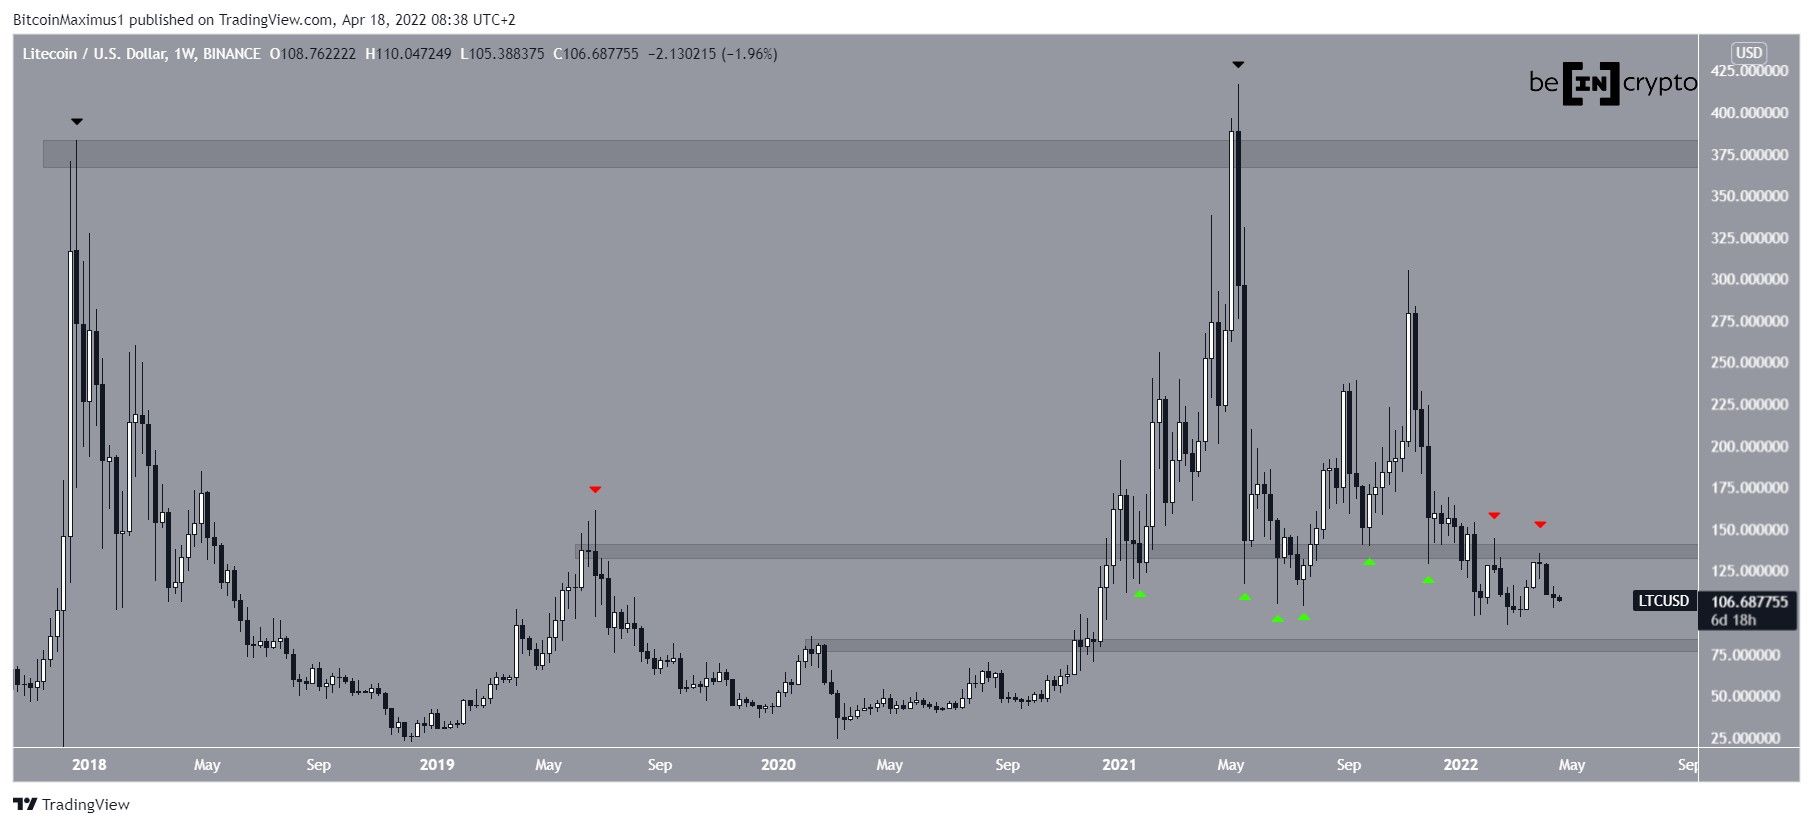
Litecoin has been falling since reaching an all-time high price of $417 on May 10. At the time, this had created a double top (black icons) relative to the previous all-time high from December 2017. The double top is considered a bearish pattern that often leads to bearish trend reversals, as was the case in LTC.
Following this, the price broke down from the $140 area, which had been intermittently acting as both support and resistance since May 2019. The area was validated as resistance once more at the beginning of January 2022 (red icon).
The next closest support area is found at $80.
Will LTC break down?
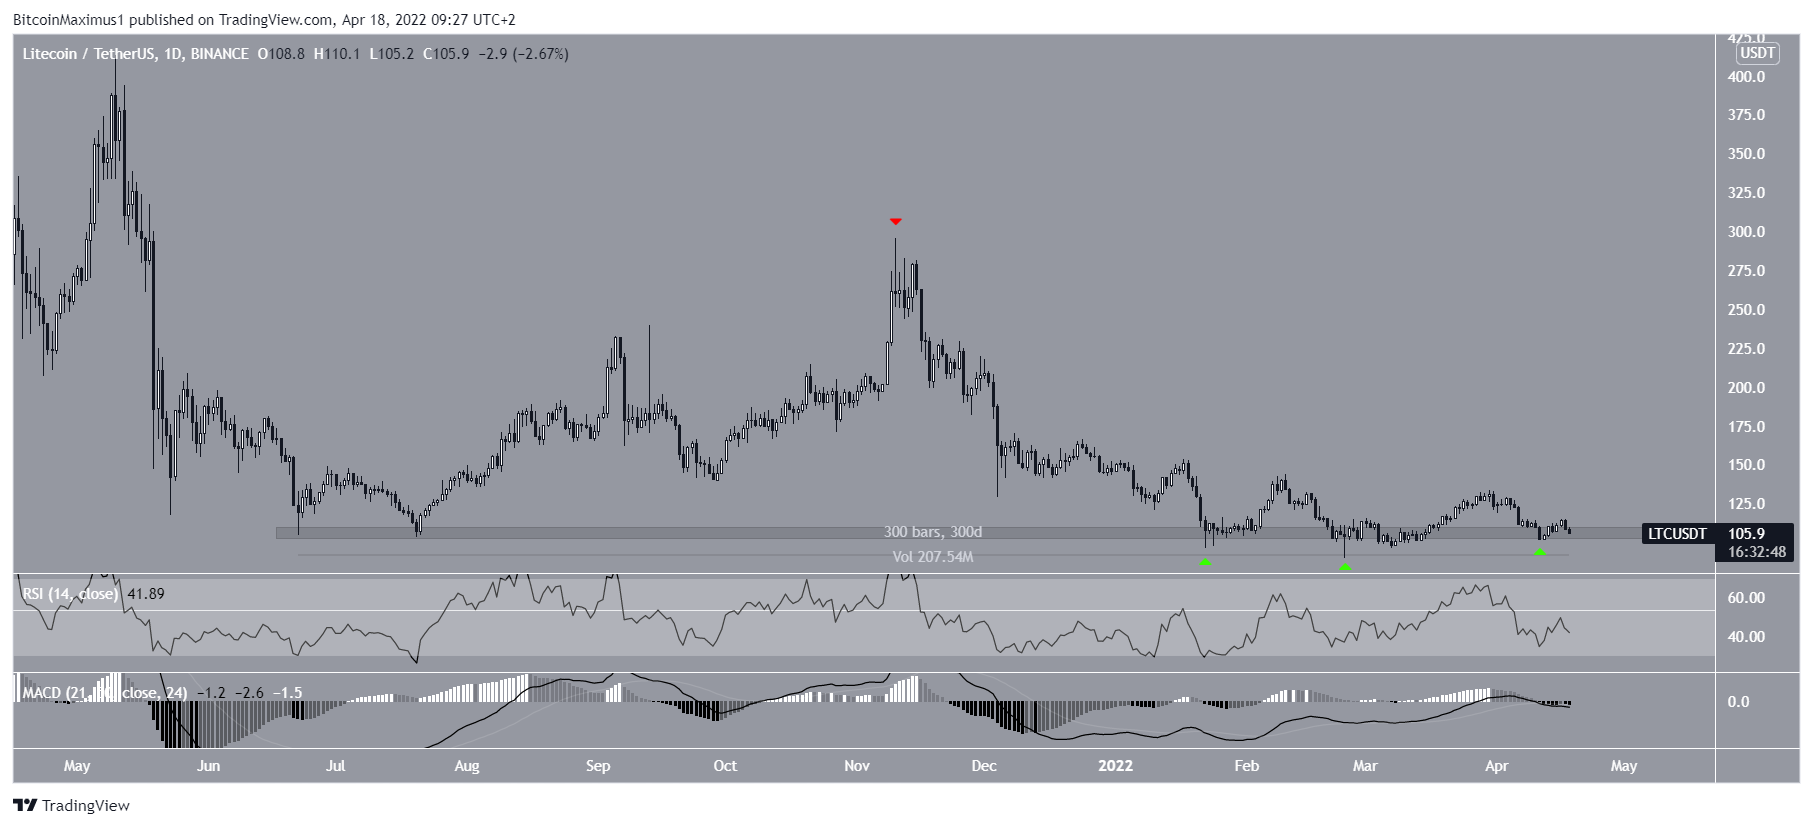
The daily time frame provides a bearish outlook.
The price action shows that LTC has been falling since November 2021 (red icon) and has now returned to the $105 area, which has been acting as support for the past 300 days.
While LTC has rebounded from this level multiple times (green icon), it has failed to initiate any significant upward movement as a result.
Technical indicators in the daily time frame are also bearish. This is visible in the falling RSI and MACD. The RSI is below 50 and the MACD is negative, both of which are considered signs of a bearish trend.
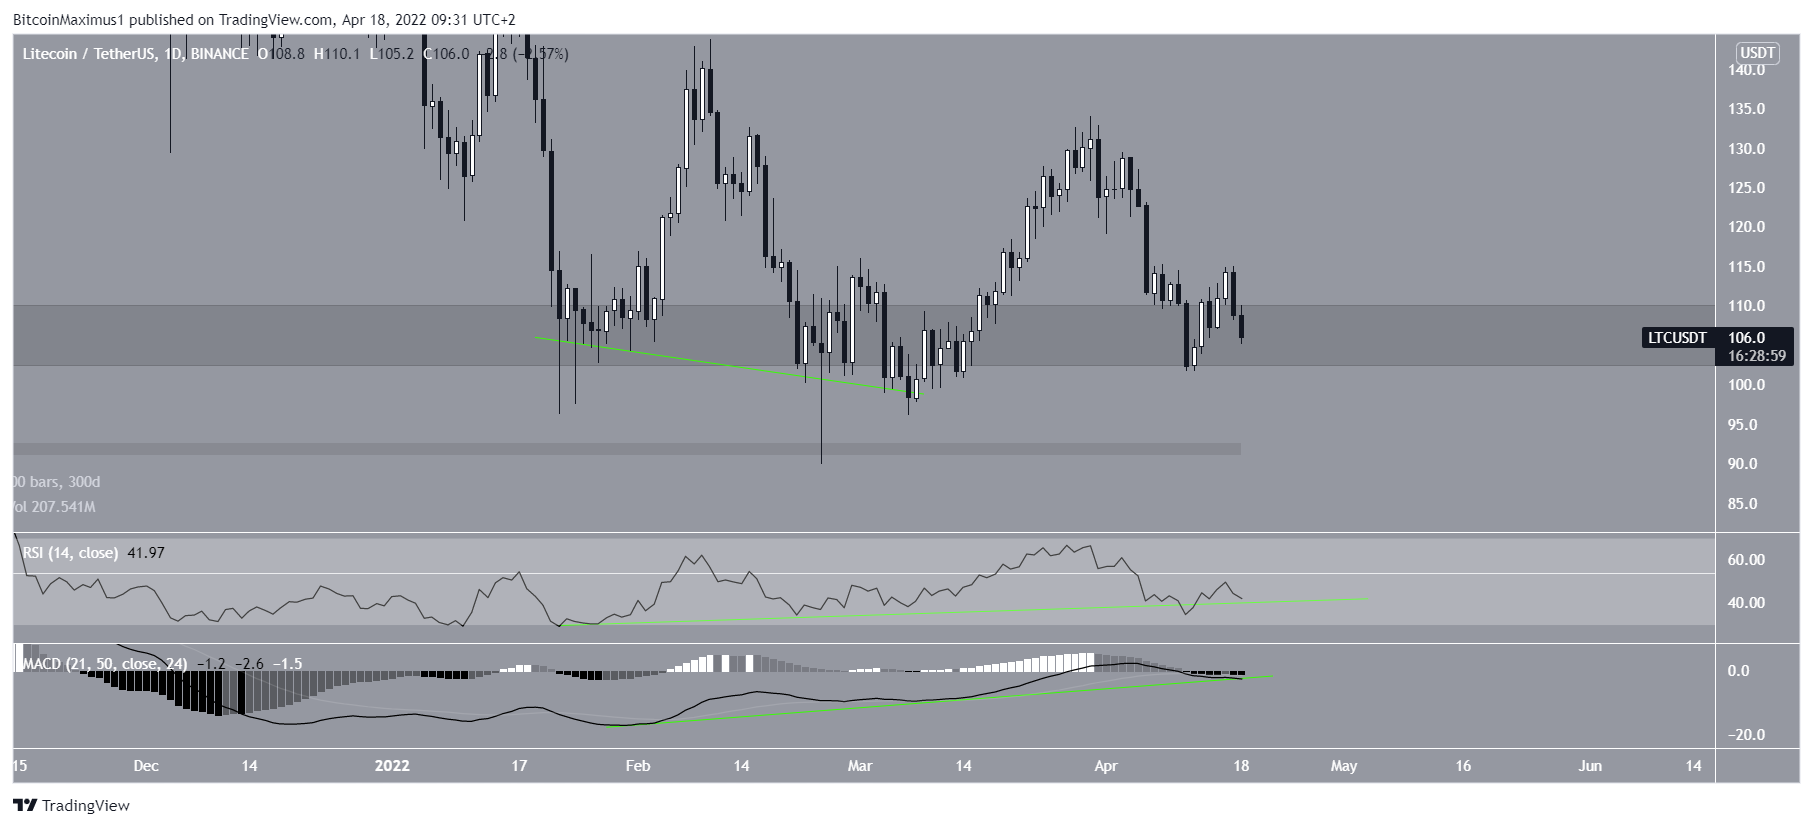
If LTC reaches a close below the $105 level, it could cause a rapid drop to retest long-term lows.
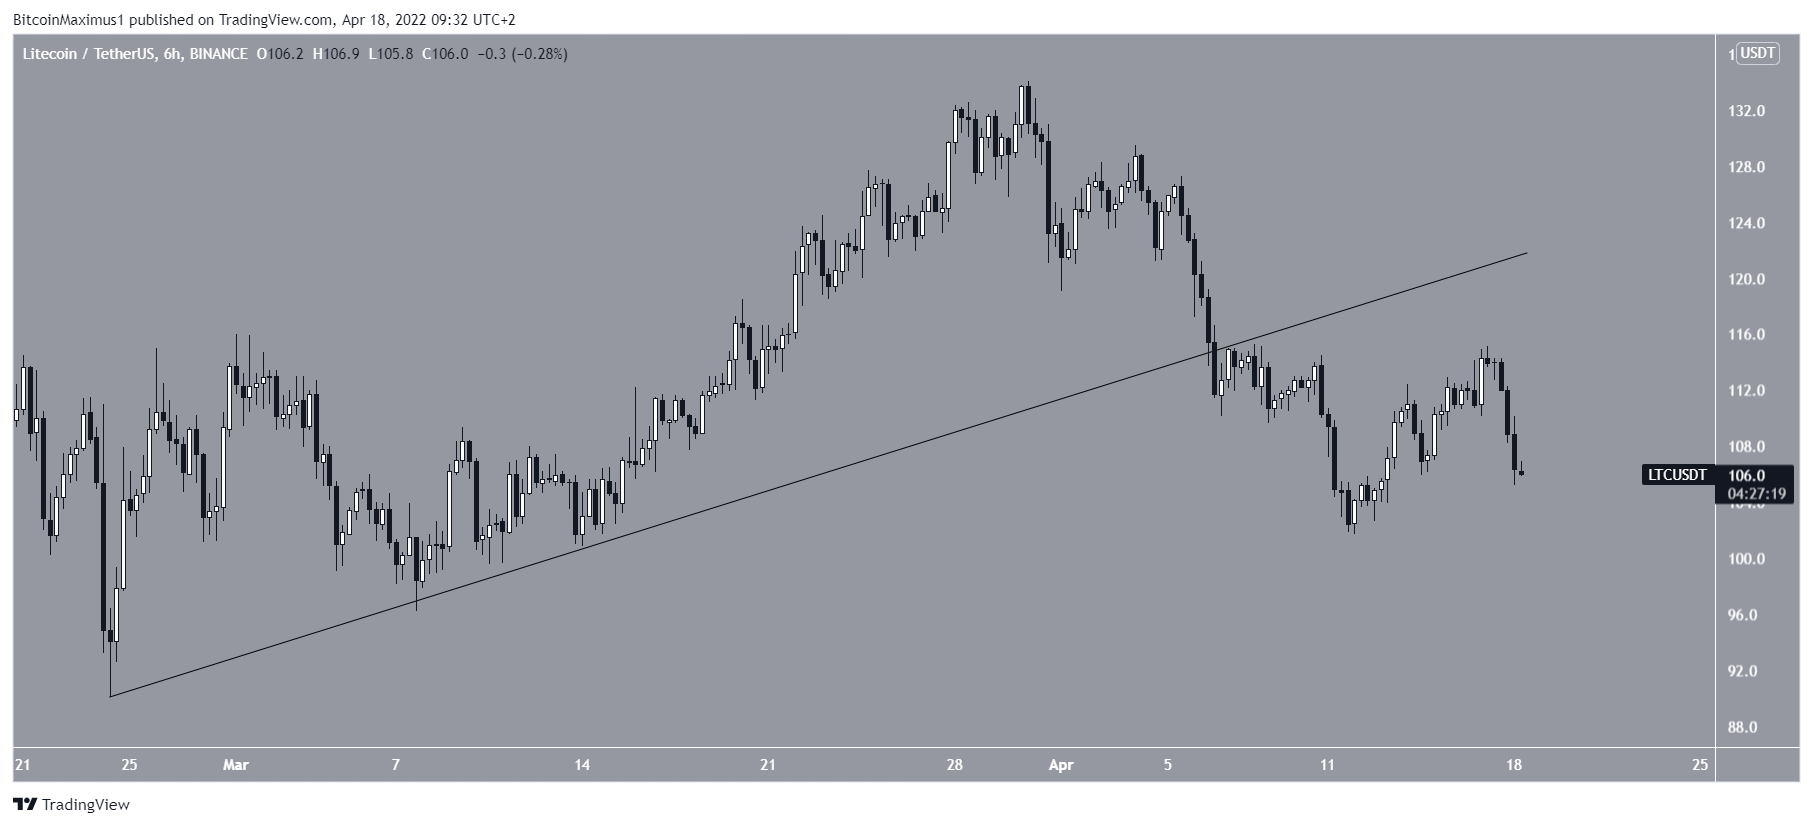
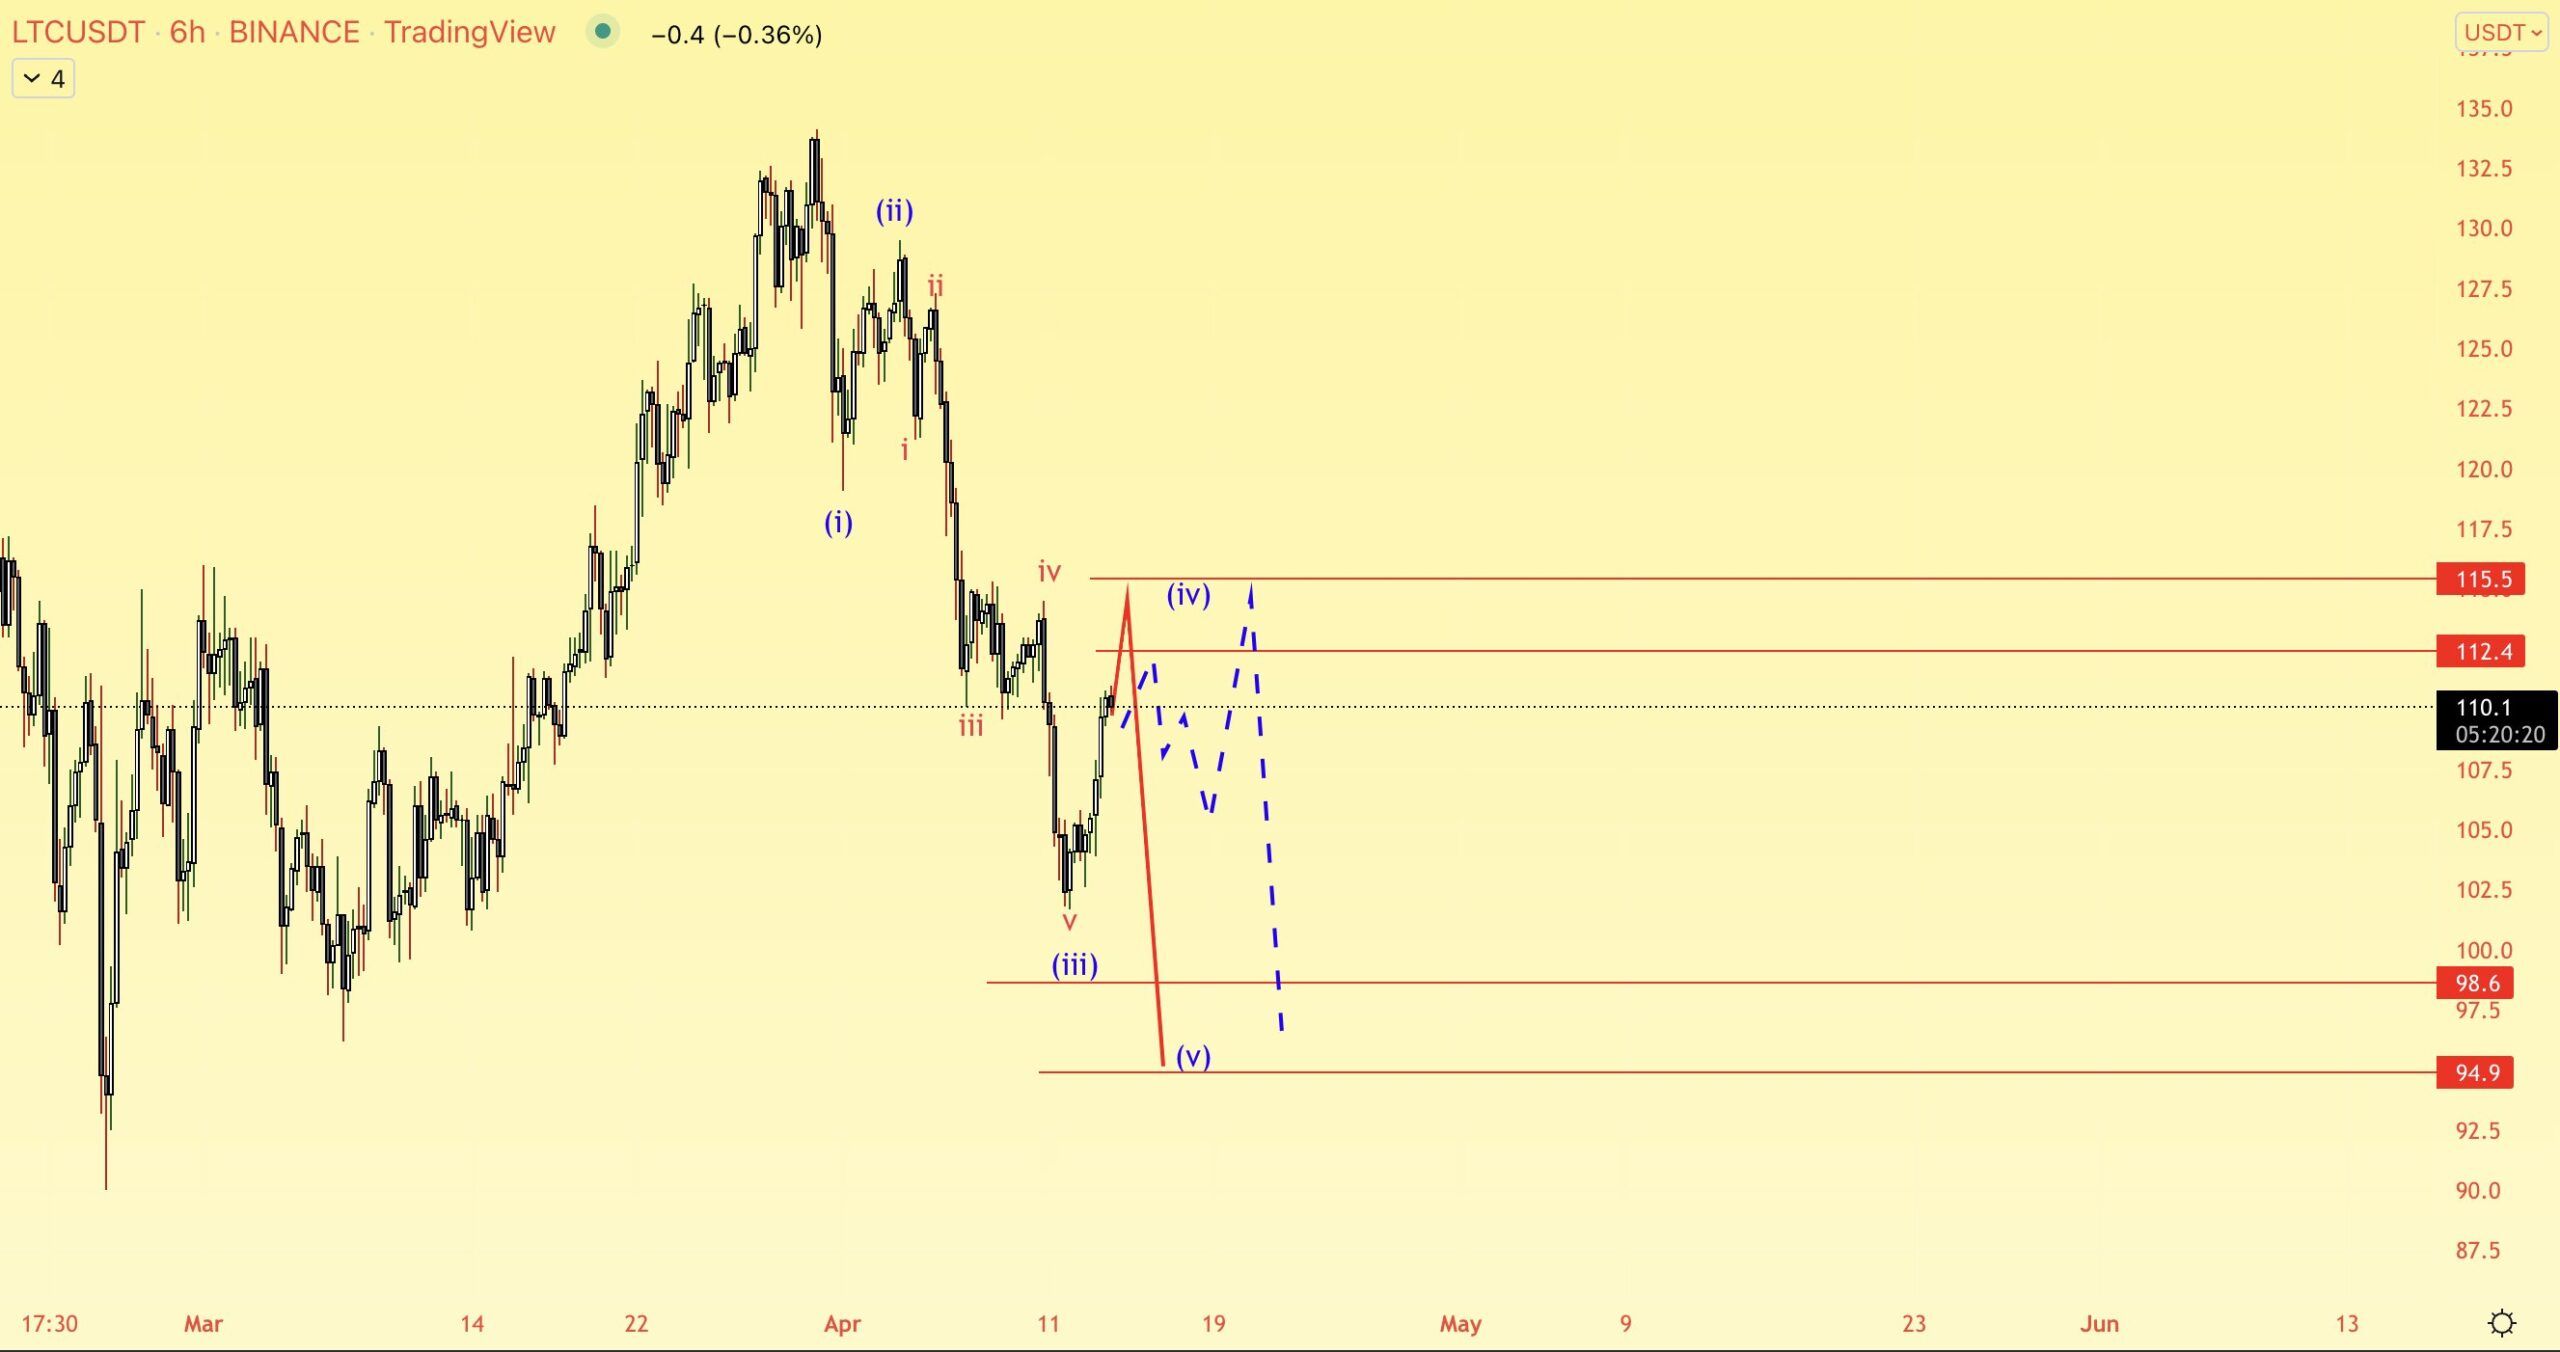
The six-hour chart also shows that LTC has broken down from an ascending support line that had been in place since Feb. 24. This is a sign that the ongoing upward move has likely come to an end.
The trendline of the bullish divergences (green lines) in the daily RSI and MACD provides a bit of optimism but is not sufficient enough to negate all the other bearish signals.
Wave count analysis
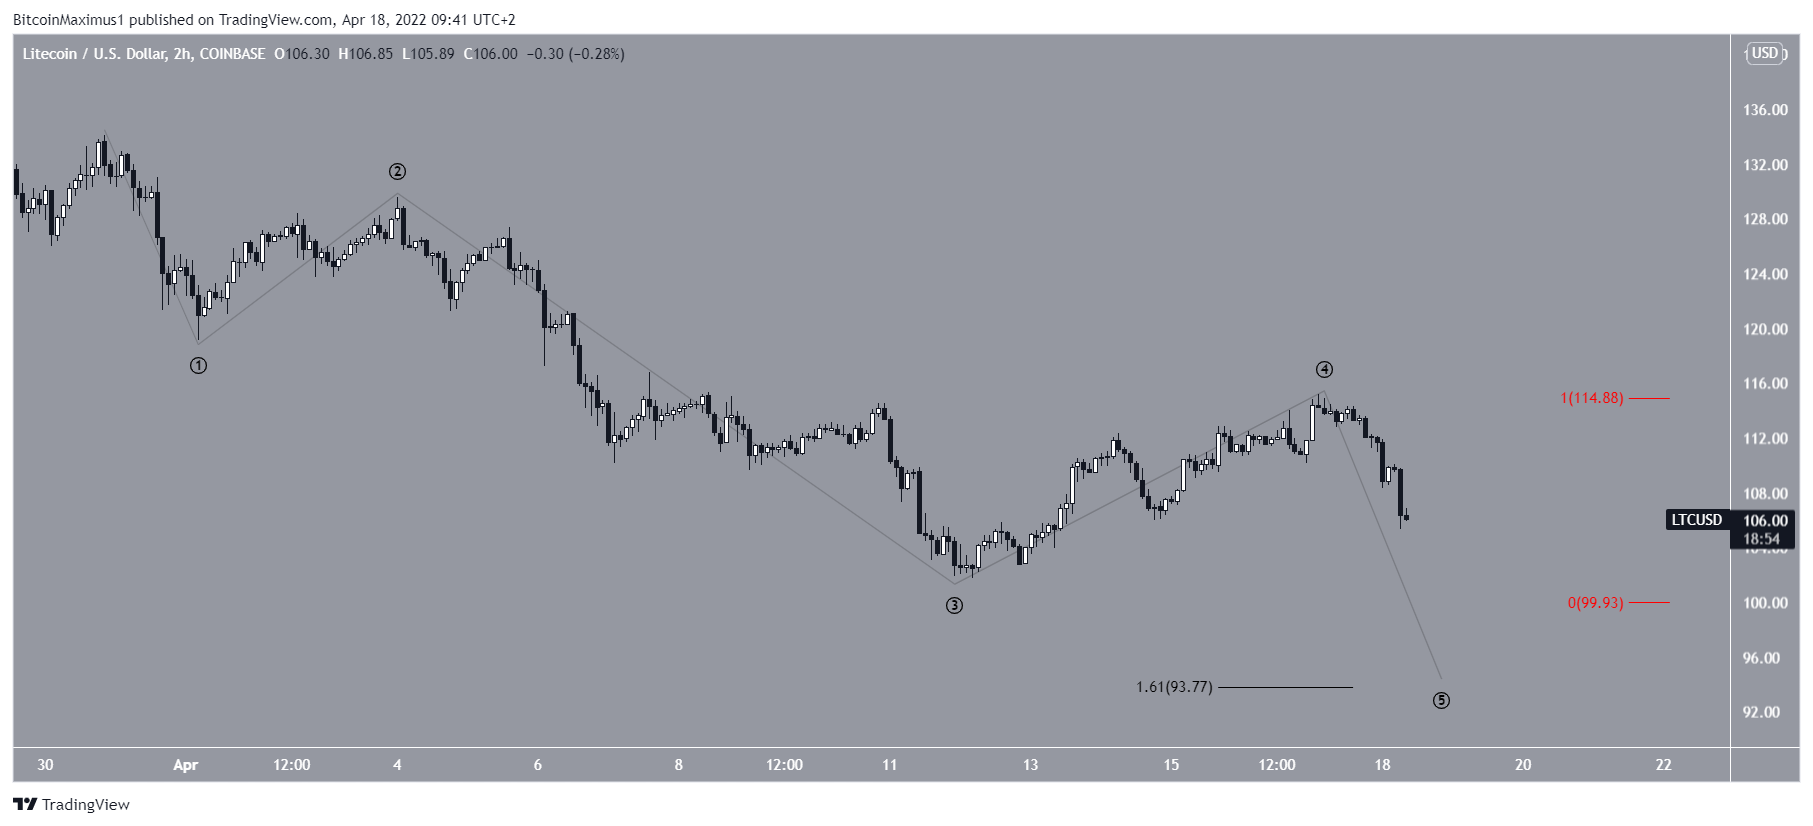
Cryptocurrency trader @Altstreetbet tweeted an LTC chart and stated that another drop will likely complete the fifth and final wave.
The first target for the bottom of this movement is found at $99. If reached, it would sweep the April 11 lows before potentially rebounding. This target is found by projecting the length of wave one (red).
The second target is a bit lower at $93.80, created by the 1.61 external Fib retracement resistance level.
As a result, it seems likely that LTC will retest its April lows before it can resume any movement to the upside.
For BeInCrypto’s latest Bitcoin (BTC) analysis, click here


